Publisher’s version / Version de l'éditeur:
Proceedings of the International Conference on Port and Ocean Engineering Under Arctic Conditions, 2013
READ THESE TERMS AND CONDITIONS CAREFULLY BEFORE USING THIS WEBSITE. https://nrc-publications.canada.ca/eng/copyright
Vous avez des questions? Nous pouvons vous aider. Pour communiquer directement avec un auteur, consultez la
première page de la revue dans laquelle son article a été publié afin de trouver ses coordonnées. Si vous n’arrivez pas à les repérer, communiquez avec nous à [email protected].
Questions? Contact the NRC Publications Archive team at
[email protected]. If you wish to email the authors directly, please see the first page of the publication for their contact information.
NRC Publications Archive
Archives des publications du CNRC
This publication could be one of several versions: author’s original, accepted manuscript or the publisher’s version. / La version de cette publication peut être l’une des suivantes : la version prépublication de l’auteur, la version acceptée du manuscrit ou la version de l’éditeur.
Access and use of this website and the material on it are subject to the Terms and Conditions set forth at
High-speed imaging of ice-on-ice crushing Gagnon, R.E.
https://publications-cnrc.canada.ca/fra/droits
L’accès à ce site Web et l’utilisation de son contenu sont assujettis aux conditions présentées dans le site LISEZ CES CONDITIONS ATTENTIVEMENT AVANT D’UTILISER CE SITE WEB.
NRC Publications Record / Notice d'Archives des publications de CNRC:
https://nrc-publications.canada.ca/eng/view/object/?id=e2a3f82a-2f7c-4c38-b839-0ec8d30c12a5 https://publications-cnrc.canada.ca/fra/voir/objet/?id=e2a3f82a-2f7c-4c38-b839-0ec8d30c12a5
HIGH-SPEED IMAGING OF ICE-ON-ICE CRUSHING
R.E. GagnonOCRE/NRC, St. John’s, NL, Canada
ABSTRACT
High-speed imaging (15,000 images/s) has been used to observe the behavior of truncated- pyramid freshwater ice samples crushing against an initially-flat freshwater ice ‘platen’ at –10o
C at a rate of 20 mm/s. For most tests a polycrystalline sample was crushed against a monocrystalline platen. Two tests involved the cases where both the pyramid sample and platen were monocrystalline and where they were both polycrystalline. The ice behavior was viewed through the ice platen. Remarkably the behavior of the ice in all cases resembled that of prior tests where ice pyramids were crushed against rigid steel and acrylic platens and where observations included spalling, high-pressure zones and low-pressure zones. Spalling rates for the polycrystalline sample tests were significantly influenced by the resonant frequency of the ice-apparatus system, ~ 350 Hz, and the load records showed several extended segments of lock-in at that frequency. This implies that the spalling rates were generally in the vicinity of the resonant frequency of the system and this lead, at times, to the rates adjusting to match the system resonant frequency. While small elastic oscillations of the ice-apparatus system were evident in the sawtooth load record for the monocrystalline ice sample test these did not result in lock-in since the spalling rate was much lower than the polycrystalline case and much more stress built up in the system between spalling events, that is, the load sawteeth had much higher amplitudes and longer periods. The difference in behavior of the monocrystalline and polycrystalline ice can be attributed to the presence of grain boundaries and the random c-axis orientations of the grains, where both promote spalling fractures. Adhesive effects, due to rapid refreezing of liquid produced during crushing, were also observed in the load records at the ends of the tests where load went negative briefly as the crushed ice pyramid was pulled away from the ice platen.
INTRODUCTION
Ice-ice interaction, and associated crushing, occurs in several instances both terrestrially and elsewhere in the solar system. When broken sea ice is forced to move, as a result of wind and/or current shear forces, against a shoreline or to flow in a constricted channel ice pieces collide and crush against one another at contact points. Similarly, ice pieces moving down a river through a narrow area or round a bend experience collisions with other ice pieces that sometimes cause an ice jam. Also, when ice masses move against structures crushed ice is produced. Inside this material ice-on-ice crushing occurs between particles and chunks as the material is forced to extrude away from high-pressure zones at the structure/ice interface. Ice-on-ice crushing also occurs when icebergs and ice islands clear paths through sea ice covers when driven by current or when grounded in a moving ice flow. When ships impact sea ice ridges load transfer occurs at contact points between ice blocks that comprise the ridge and results in ice-on-ice crushing and energy dissipation. The dynamics of ridge keel and sail formation also involve ice-on-ice impact and crushing. On a smaller scale in certain
POAC’13
Espoo, Finland
Proceedings of the 22nd International Conference on Port and Ocean Engineering under Arctic Conditions June 9-13, 2013 Espoo, Finland
atmospheric conditions small ice particles collide with existing ice layers on aircraft components to increase the accumulation. A thin layer of pressurized flowing melt is known to be generated during ice crushing (Gagnon, 1994a). It follows that the relief of pressure near the end of an ice-on-ice collision could lead to rapid refreezing of the liquid due to its super-cooled state and heat loss to cold surrounding ice, with consequent adhesive effects. Finally we mention ice-on-ice crushing in fault zones on tectonically active moons such as the Saturnian moon Enceladus (e.g. Smith-Konter and Pappalardo, 2008). Additionally, ice-on-ice collisions occur when ice-on-ice masses collide with Saturn’s F-ring (e.g. Attree et al., 2012; Tiscareno et al., 2011). In all of these scenarios some degree of ice-on-ice crushing occurs at the contact areas and the crushing plays a role in the load transfer characteristics, the energy balance of the interactions, and the dynamics and cohesiveness of the system. Ballistic-speed ice-on-ice impact experiments have been performed before (Kato et al., 1995) where impact craters were analysed after tests. Here we present the first detailed in situ observations of ice behavior during ice-on-ice crushing within the brittle regime at a comparatively slow rate that is more typical of terrestrial interactions.
APPARATUS AND ICE PREPARATION
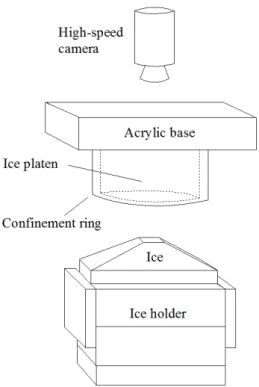
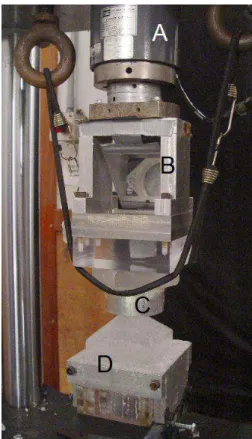
Fig. 1 is a schematic of the test setup, where an ice sample, confined in a rigid holder, is ready to be pressed against a transparent ice platen in a testing frame as high-speed images are acquired from the opposite side of the platen. Fig. 2 is a photo of the actual apparatus and ice just prior to a test. Most ice samples were polycrystalline and one was mono-crystalline with the c-axis oriented vertically. Each ice specimen, initially a block 13 cm x 13 cm x 10 cm, was trimmed at the top to the shape of a truncated pyramid with a slope of about 40o. The top of the pyramid was rounded slightly by hand melting. Details of the procedure for preparing the ice specimens and mounting them in the ice holder are given by Gagnon (1994a). The ice holder and the method of growing large single crystals are also described. The tests were carried out at –10oC and the actuator was moving at a nominal rate of 20 mm/s. The load data for the tests were acquired at 20,000 samples per second. The high-speed imaging camera (Fastcam-APX RS) was running at a capture rate of 15,000 images per second and each image was 256 x 256 pixels in size, the
maximum allowable resolution for the camera at this image acquisition rate.
The ice platen was a machined solid cylinder of ice with parallel flat end faces. It was confined within a holder that consisted of a thick acrylic base that was glued to an aluminum confining ring (ID 86 mm x height 48 mm). The ice platen was machined to have a slightly smaller diameter than the inner diameter of the confining ring and the same approximate height. To install the ice, the holder was brought to a temperature slightly above 0oC while the ice platen was slightly colder than 0oC. The platen was then inserted into the holder so that it was centered relative to the ring. A small amount of melting initially occurred at the bottom face of the ice platen. The ice then bonded, and conformed perfectly, to the acrylic due to freezing of the thin interfacial melt layer. Then clamps were used to press a Styrofoam pad Fig. 1. Schematic of the test setup for the crushing experiments.
against the top face of the ice platen. Snow, followed by water at OoC, was then poured in to fill the small gap between the cylindrical wall of the ice and the inner face of the confining ring. Then the ambient air temperature was dropped to – 10oC so that the water froze, thereby securing the ice platen in the holder. The clamps prevented any lifting or relative movement of the ice platen and holder during the freezing process. Such precautions ensured that the ice was properly bonded to the base of the holder and the confining ring. This prevented pre-cracking and non-uniform bonding that would otherwise mar the behavior of the ice during the crushing tests. The ice platen, when properly installed in its confinement holder, mimicked an infinite plane of ice.
In these experiments we had chosen to use the top of a truncated ice pyramid to crush against a flat ice platen. In nature where ice-on-ice crushing is involved it is much more likely that a corner or pointed portion of one participating ice mass will, at the local scale, interact with a relatively flat portion of another participating ice mass rather than point-on-point or flat-on-flat interactions.
Polycrystalline ice was grown by filling a box, insulated at the top and sides, with freshwater ice grains (~ 4 mm in diameter) and flooding the box, while under vacuum, from the bottom with deaerated water near OoC. Separated by a gap from the insulating material at the top of the box was a thin rubber membrane that kept the
ice-water mixture compacted after flooding. The mix was then allowed to freeze from the bottom upwards by exposing the metallic bottom of the box to cold air at -10oC in a cold room. The rubber membrane at the top allowed for the expansion of the water as it froze. Fig. 3 shows a thin section of the granular ice. The ice was stored for 7 days before the tests began.
RESULTS AND DISCUSSION
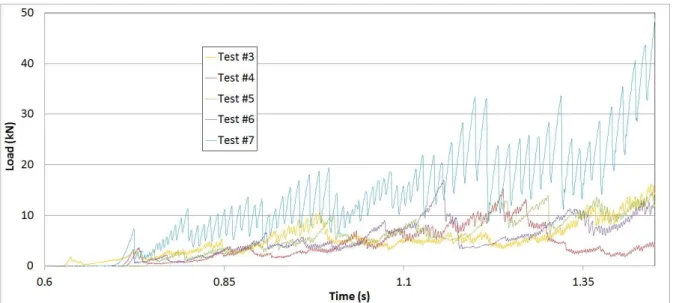
Table 1 shows the ice sample and ice platen types used for the five tests discussed here. Fig. 4 shows the load records for the five ice crushing experiments: Test #7 corresponds to a single-crystal pyramid crushing against a single-crystal platen; Test #6 corresponds to the case where both the ice platen and the ice pyramid were polycrystalline; Tests #4 and #5 correspond to the case where polycrystalline ice pyramids were crushed against a single-crystal platen; Test #3 corresponds to the case where a polysingle-crystalline ice pyramid was crushed against a thick acrylic platen.
Table 1. Test sample and platen types used for each experiment.
Monocrystalline Pyramid Polycrystalline Pyramid Acrylic Platen Test #3
Monocrystalline Ice Platen Test #7 Test #4 and Test #5 Polycrystalline Ice Platen Test #6
Fig. 2. Photo of apparatus. (A) Load cell; (B) reinforced housing and mirror for viewing the crushing contact area through the ice platen; (C) confining ring with ice platen inside; (D) pyramid ice sample in ice holder.
Initially we will focus on the broad characteristics of the data. It is obvious that during Test #7, corresponding to a single-crystal pyramid crushing against a single-crystal plate, that the sample failed catastrophically at time ~1.46 s on
the record. The top portion of the pyramid shattered due to the build-up of strain energy and could not support any substantial load until the ice platen encountered some fresh intact pyramid ice. This was evident in the high speed imaging record. Hence, for the sake of comparing the data from Test #7 with the other tests we have shown expanded views of portions of the load data from the beginnings of the tests up to ~1.45 s in Figs. 5 and 6.
The load time series for Tests #3-6 show basic similarities (Figs. 4 and 5). While the traces do not overlap at any particular segment in time it can be seen that the traces fluctuate so the order of highest to lowest values changes from time to
time so that one could argue that the traces are quite similar qualitatively and, when averaged over time, quantitatively. Indeed if we average the load values of the traces up to the point in time where the large failure of Test #7 occurred, that is time ~1.45 s, we get values of 5.09 kN, 4.51 kN, 6.58 kN and 5.61 kN for Tests #3-6 respectively, corresponding to an average value and standard deviation of 5.44 kN ± 0.76 kN. Test #7 averaged to that point in time, on the other hand, gives a distinctly higher value of 15.42 kN.
The highly expanded view of the tests shown in Fig. 6 illustrates several features of the ice behavior and its connection with the behavior of the ice-apparatus system. Note that the high speed imaging records show a spalling event for each of the small sawtooth oscillations in the load records for Tests #3-6 and for each large sawtooth in the record for Test #7. Spalling rates for all of the polycrystalline samples (Tests #3-6) were significantly influenced by the resonant frequency of the ice-apparatus system (~ 350 Hz), and several segments in the load records resembled lock-in at that frequency (e.g. Fig. 6, A, Test #6). This implies that the Fig. 3. A thin section of the lab-grown polycrystalline ice. The unit on the scale at the right is mm. The ice porosity was very low since the bulk ice was virtually transparent.
Fig. 4. Load time series for the five ice crushing experiments. The tests were conducted at -10oC with a nominal actuator speed of 20 mm/s.
spalling rates were lower than, but in the vicinity of, the resonant frequency of the system and this lead to the rate adjusting upwards at times to match the system resonant frequency, as previously observed and discussed by Gagnon (2011). The amplitude of the rounded load sawtooth associated with any particular spalling event generally was small, as is evident in the low-amplitude oscillations predominant in the records of Tests #3-6 (Fig. 6). Occasionally a larger spalling event would occur in a load record (e.g. Fig. 6, B, Test #5) or the spalling rate would for a segment become significantly less than the resonant frequency of the ice-apparatus system, (Fig. 6, C, Test #6) but generally it stayed in the vicinity of the system resonant frequency. In contrast, while small elastic oscillations of the ice-apparatus system (Fig. 6, D, Test #7) were evident in the load record for Test #7, where monocrystalline ice was used, these did not result in spalling or lock-in. The spalling rate in this case was much lower than in the polycrystalline ice case and much more stress built up in the system between spall events, i.e. the load sawteeth had much higher amplitudes and longer periods.
Fig. 5. Expanded view of the load data shown in Fig. 4, where only the data before time ~1.45 s, i.e. the time of catastrophic failure of the sample in Test #7, is presented.
The difference in behavior of the monocrystalline and polycrystalline ice samples can be attributed to the presence of grain boundaries in the latter case where grain-boundary sliding, and the associated stress concentrations, is likely the dominant mechanism that leads to crack formation under the present circumstances (e.g. Frost, 2001). Note that some extremely small air bubbles, from the ice growth process, reside at the grain boundaries and they may have some influence. Individual grains exhibit variable susceptibility to fracture depending on the loading direction relative to the c-axis. Indeed some of the high speed image data from the present tests shows instances where one grain that is part of a high-pressure zone will shatter whereas the grain immediately adjacent to it will not shatter. Hence, it is not surprising that the monocrystalline ice pyramid was much less susceptible to cracks than the polycrystalline ice samples because there were no grains or grain boundaries in the ice. Furthermore in Test #7 the loading direction was along the c-axis of the ice, and it has been shown that fracture is harder to initiate in the prismatic plane than in the basal plane (Frost, 1996). Additionally, when spalls occur in the polycrystalline ice case the spall size is often on the scale of the grain size of the ice, in contrast to the monocrystalline case where the spall size is generally much larger. Note that the magnitude of the load drop associated with a spalling event correlates with the size of the spall that separates from the intact ice. Hence the sawtooth load drops associated with Test #7 are greater than the load drops associated with Tests #3-6 since the spalls are larger for the reasons discussed above. Qualitatively the sawtooth load record for Test #7 looked similar to previous crushing tests using monocrystalline pyramid samples crushing against an instrumented metallic platen (Gagnon 1994b) and quantitatively the load values at a crushing depth of 10 mm were comparable.
There is another observation that is of some relevance regarding the load data. It was noted that at the ends of the ice-on-ice crushing tests, at the point where the actuator reversed direction and began to withdraw the pyramid samples from the ice platen, the load momentarily went negative to a small extent (roughly 60 N). That is, the ice sample and platen had bonded together so that a tensile load could be supported. In one case (Test #5) the ice platen remained bonded to the crushed ice pyramid after the test thereby stretching the bungee cord that normally kept the acrylic base of the platen holder in flush contact with another thick acrylic plate that was attached to the load cell (Fig. 2). The load time series shows that the bonding strength was greater than the force required to overcome air pressure initially to separate the flat base of the platen holder from the flat acrylic plate attached to the load cell (Fig. 7). The adhesion between the ice platen and the pyramid samples may be explained by the presence of a thin pressurized flowing melt layer (Gagnon 1994a) between
Fig. 7. Load time series for Test #5, corresponding to the end of the test where the ice sample had freeze-bonded to the ice platen as the actuator withdrew.
the intact ice platen and intact hard zones of the pyramid samples that rapidly freezes as flow stops when the pressure is released, and in so doing bonds the sample and platen together. Normally during crushing the viscous pressurized liquid layer is always flowing and generating heat that produces more melt (Gagnon 1994a).
For all tests using a monocrystalline ice ‘platen’ it was noted that the platen stayed relatively intact while apparently wearing somewhat (to a depth of roughly 1 cm). The wearing process is similar to that which happens to the ice pyramid sample. In the case of the platen there is some near surface spalling that occurs to the sides of the central region in addition to rapid melting that occurs in the central region where hard zones of the ice pyramid tend to be located during crushing. Fig. 8 shows a thin section of the monocrystalline ice platen that was removed from the confining ring following Test #7. Conical-shaped cracks (Fig. 8, A) are visible extending from the top central region where the ice has clearly worn (Fig. 8, B), i.e. melted, to a depth of ~8 mm. The hazy material (Fig. 8, C) to the sides of the central region is the refrozen remnant of wet spall debris from both the ice pyramid and the ice platen itself. The polycrystalline ice platen
behaved in a similar way during Test #6, however, many small cracks appeared starting from the central region that grew in number as the test progressed. Gagnon and Bugden (2007) had noted similar behavior during edge crushing experiments of thick sections of polycrystalline ice. These small cracks were associated with the granular nature of the ice, as mentioned above, however they did not seem to reduce the strength of the ice in the loading direction since the load record and visual behavior were similar to the other tests.
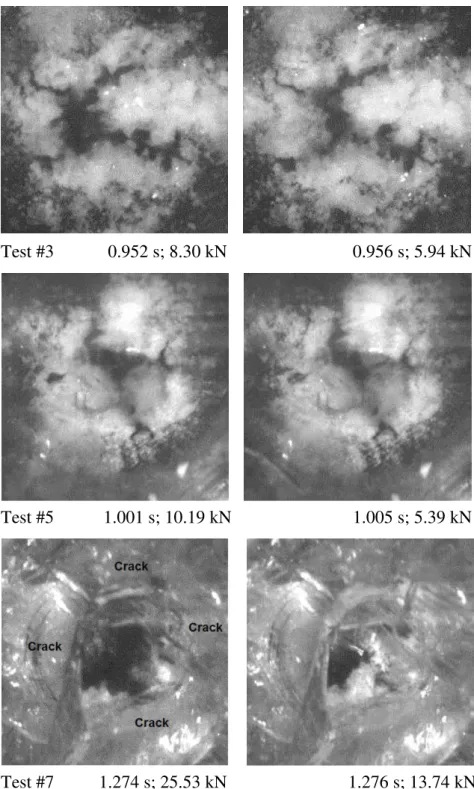
We now consider some of the visual data from the tests. Here we show image pairs from Tests #3, #5 and #7 (Fig. 9). Test #5 was a repeat of Test #4 using the same monocrystalline ice platen after Test#4 since it had experienced only a few minor cracks and had only eroded to a depth of about 1 cm. It was therefore deemed suitable for retesting after scraping off the loose crushed ice debris and flattening the top surface by melting with a warm metallic plate. Tests #3 and #5 had the same test parameters (-10oC; 20 mm/s) except that sample 3 was crushed against an acrylic platen whereas sample 5 was crushed against a flat monocrystalline ice ‘platen’. Remarkably the load records and the images of the ice contact areas are similar. In Fig. 9 each image pair shows the ice contact area just prior to and after a spalling event. High-pressure zones (the dark areas) surrounded by low-pressure zones (light areas) are common to all images. In each case a spalling event corresponds to a portion of the intact ice in a high-pressure zone separating from the intact ice and shattering to become light-colored low-pressure pulverized material. The process has been discussed before along with other aspects such as the production of melt at high-pressure zones (Gagnon, 1999) and within the pulverized material as it flows away from high-pressure zones (Gagnon and Daley, 2005). For Tests #3 and #5 we note that the high-pressure zones are somewhat dendritic in shape. This is Fig. 8. Thin section of the monocrystalline ice platen used in Test #7. (A) Conical-shaped cracks; (B) relatively undamaged central region where most hard zone contact occurred; (C) refrozen remnants of wet spall debris. The dark band at the left corresponds to the mix of snow and water that was used to freeze the outer perimeter of the ice platen to the confining ring.
Test #3 0.952 s; 8.30 kN 0.956 s; 5.94 kN
Test #5 1.001 s; 10.19 kN 1.005 s; 5.39 kN
Fig. 9. Image pairs from three tests, including time signatures and corresponding load values. For Test #3 the view is through an acrylic platen that the ice was crushed against, whereas the views for Test #5 and Test#7 were through monocrystalline ice platens. Each image pair shows the ice contact area just prior to and after a spalling event. All images show centrally located hard zones (dark areas) with surrounding soft zones (light areas). The two images of ice contact from Test #7 are partially compromised because at that time in the test a series of optically-reflective cracks, in a cone-shaped formation (see Fig. 8), prevented a full view of the hard zone and surrounding soft zone. However, the view is sufficient to clearly see the spall event where a portion of the central intact ice (dark area) has turned into pulverized spall debris (light area), similar to the other image pairs. Each image is 35 mm wide.
due to the polycrystalline nature of the ice samples. This contrasts with the more regular shaped high-pressure zones observed for Test #7, where monocrystalline ice was used for the pyramid sample. Note that due to conical-shaped fractures that developed in the ice platen as the load increased (Fig. 8, A) the view of the ice contact area for Test #7 was partially blocked for most of the visual record. The spalling behavior was nevertheless clearly visible.
For these test results adequate synchronization of imaging and load (to within 1 ms) was achieved by associating a number of distinctive events in the load record with corresponding distinctive events from the imaging record such as initial ice contact and prominent spalling episodes.
CONCLUSIONS
Visual records of the contact region during ice-on-ice crushing have been obtained for the first time. The visual information and load data indicate that the same ice crushing processes occur during ice-on-ice crushing as they do for ice crushing against rigid metallic or acrylic platens. Polycrystalline ice samples generally yield lower load values than monocrystalline ice samples with the c-axis vertical. The shapes of the high-pressure zones for polycrystalline ice samples are somewhat dendritic whereas for monocrystalline ice samples the zones are more regular shaped. The differences in load values and high-pressure zone shape characteristics are due to a propensity for cracks at grain boundaries and within grains of weak c-axis orientation in the case of the polycrystalline ice. A consequence of this is that spalling rates are much higher and of much lower load amplitude for the polycrystalline ice case. It appears that depressurization and stoppage of flow of the thin melt layer between the ice platen and the high-pressure zones of the ice pyramid lead to rapid freezing of the liquid and consequent bonding of the ice sample to the ice platen at the ends of the ice-on-ice tests.
ACKNOWLEDGEMENTS
The author would like to thank the Program of Energy Research and Development (PERD) and OCRE/NRC for their financial support of this research. The author is also grateful to Austin Bugden for technical assistance during the test program.
REFERENCES
Attree, N. O., Murray, C. D., Cooper, N. J. and Williams, G. A., 2012. Detection of low-velocity collisions in Saturn’s F ring. Astroph. J. Lett. 755, L27.
Frost, H. J., 1996. Modelling and Observation of Crack Nucleation in Ice Due to Elastic and Plastic Anisotropy – Final Report. U.S Army Research Office, Project Number: 28649-GS, Dartmouth College.
Frost, H. J., 2001. Mechanisms of crack nucleation in ice. Engineering Fracture Mechanics, Volume 68, issues 17-18, December 2001, 1823–1837.
Gagnon, R.E., 1994a. Melt Layer Thickness Measurements During Crushing Experiments on Freshwater Ice. Journal of Glaciology, 1994, Vol. 40, No. 134, 119-124.
Gagnon, R.E., 1994b. Generation of Melt during Crushing Experiments on Freshwater Ice. Cold Regions Science and Technology, 1994, Vol. 22, No. 4, 385-398.
Gagnon, R. E., 1999. Consistent Observations of Ice Crushing in Laboratory Tests and Field Experiments Covering Three Orders of Magnitude in Scale. Proceedings of the 15th
International Conference on Port and Ocean Engineering under Arctic Conditions, POAC-99, Helsinki, Finland, Vol. 2, 858-869.
Gagnon, R.E., 2011. An inside look at ice-crushing induced vibration and lock-in. Proceedings of POAC 2011, Montreal, Canada. Paper No. 125.
Gagnon, R. E. and Bugden, A., 2007. Ice Crushing Tests Using a Modified Novel Apparatus. Proceedings of POAC-07, 235-244.
Gagnon, R. E. and Daley, C., 2005. Dual-axis video observations of ice crushing utilizing high-speed video for one perspective. Proceedings of the 18th International Conference on Port and Ocean Engineering Under Arctic Conditions, Potsdam, New York, p. 271-281.
Kato, M., Iijima, Y., Arakawa, M., Okimura, Y., Fujimura, A., Maeno, N. and Mizutani, H., 1995. Ice-on-Ice Impact Experiments. ICARUS 113, 423-441.
Smith-Konter, B., and Pappalardo, R.T., 2008. Tidally driven stress accumulation and shear failure of Enceladus's tiger stripes. Icarus, 198, 435-451.
Tiscareno, M. S., Mitchell, C. J., Murray, C. D., Dinino, D., Burns, J. A., Hedman, M. M., Beurle, K., Evans, M. W. and Porco, C. C., 2011. Observations of ejecta clouds produced by impacts onto Saturn’s rings. EPSC-DPS Joint Meeting 2011, abstract 1407.