Publisher’s version / Version de l'éditeur:
The Journal of Physical Chemistry A, 116, 25, pp. 6771-6784, 2012-05-29
READ THESE TERMS AND CONDITIONS CAREFULLY BEFORE USING THIS WEBSITE. https://nrc-publications.canada.ca/eng/copyright
Vous avez des questions? Nous pouvons vous aider. Pour communiquer directement avec un auteur, consultez la première page de la revue dans laquelle son article a été publié afin de trouver ses coordonnées. Si vous n’arrivez pas à les repérer, communiquez avec nous à PublicationsArchive-ArchivesPublications@nrc-cnrc.gc.ca.
Questions? Contact the NRC Publications Archive team at
PublicationsArchive-ArchivesPublications@nrc-cnrc.gc.ca. If you wish to email the authors directly, please see the first page of the publication for their contact information.
NRC Publications Archive
Archives des publications du CNRC
This publication could be one of several versions: author’s original, accepted manuscript or the publisher’s version. / La version de cette publication peut être l’une des suivantes : la version prépublication de l’auteur, la version acceptée du manuscrit ou la version de l’éditeur.
For the publisher’s version, please access the DOI link below./ Pour consulter la version de l’éditeur, utilisez le lien DOI ci-dessous.
https://doi.org/10.1021/jp303546r
Access and use of this website and the material on it are subject to the Terms and Conditions set forth at
Raman and infrared spectroscopy of α and β phases of thin nickel
hydroxide films electrochemically formed on nickel
Hall, David Scott; Lockwood, David J; Poirier, Shawn; Bock, Christina;
MacDougall, Barry R
https://publications-cnrc.canada.ca/fra/droits
L’accès à ce site Web et l’utilisation de son contenu sont assujettis aux conditions présentées dans le site LISEZ CES CONDITIONS ATTENTIVEMENT AVANT D’UTILISER CE SITE WEB.
NRC Publications Record / Notice d'Archives des publications de CNRC:
https://nrc-publications.canada.ca/eng/view/object/?id=b3b680ee-2127-4e26-a132-aca16a447a3c https://publications-cnrc.canada.ca/fra/voir/objet/?id=b3b680ee-2127-4e26-a132-aca16a447a3c
Raman and Infrared Spectroscopy of α and β Phases of Thin Nickel
Hydroxide Films Electrochemically Formed on Nickel
David S. Hall,
†,‡David J. Lockwood,
§Shawn Poirier,
§Christina Bock,
‡and Barry R. MacDougall*
,†,‡ †Department of Chemistry, University of Ottawa, D’Iorio Hall, 10 Marie Curie, Ottawa, ON K1N 6N5, Canada
‡
Energy, Mining and Environment, National Research Council Canada, M-12, 1200 Montreal Rd, Ottawa, ON K1A 0R6, Canada
§
Information and Communications Technologies, National Research Council Canada, M-50, 1200 Montreal Rd, Ottawa, ON K1A 0R6, Canada
ABSTRACT: The present work utilizes Raman and infrared (IR) spectroscopy, supported by X-ray diffraction (XRD) and X-ray photoelectron spectroscopy (XPS) to re-examine the fine structural details of Ni(OH)2, which is a key material in many energy-related applications. This work also unifies the large body of literature on the topic. Samples were prepared by the galvanostatic basification of nickel salts and by aging the deposits in hot KOH solutions. A simplified model is presented consisting of two fundamental phases (α and β) of Ni(OH)2and a range of possible structural disorder arising from factors such as impurities, hydration, and crystal defects.
For the first time, all of the lattice modes of β-Ni(OH)2have been identified and assigned using factor group analysis. Ni(OH)2films can be rapidly identified in pure and mixed samples using Raman or IR spectroscopy by measuring their strong O−H stretching modes, which act as fingerprints. Thus, this work establishes methods to measure the phase, or phases, and disorder at a Ni(OH)2 sample surface and to correlate desired chemical properties to their structural origins.
1. INTRODUCTION
The oxides and hydroxides of Ni have been extensively studied for many potential applications including energy storage,1−12 electrochromic devices,13,14 and photocatalysis.15 Corrosion studies of Ni have focused on the investigation of the nature of its surface layers and passivation phenomena.16−19
Two phases of Ni(OH)2, denoted α and β, were first established from X-ray diffraction (XRD) patterns,2 and their physical properties have since been thoroughly investigated utilizing infrared spectroscopy (IR),1,4,6,7,14,20−28 Raman spec-troscopy,5,22,29−39 extended X-ray absorption fine structure (EXAFS),30,40 inelastic neutron scattering (INS),41 neutron diffraction,42−44 and more detailed XRD studies.10,31,45,46 Typically, Ni(OH)2is prepared by the basification of an aqueous nickel(II) salt solution either by the addition of an alkali hydroxide or ammonia or by the electrochemical reduction of water. The joint effects of current density or base solution concentration, nickel concentration, and the counterions determine the product phase, crystallinity, and, in the electro-chemical approach, the current efficiency.47,48 Literature
references to Ni(OH)2 that do not specify the phase usually refer to well-crystallized, high purity β-Ni(OH)2. β-Ni(OH)2is available commercially. This phase, which occurs in nature as theophrastite, has hexagonal scalenohedral symmetry and is isostructural to brucite [Mg(OH)2].2,11,49−51 Most generally, α-Ni(OH)2 has trigonal symmetry consisting of planes of β-Ni(OH)2 intercalated with water. This hydroxide has been given the general formula Ni(OH)2−xAx/n·yH2O, where 0 ≤ x ≤ 1, 0 ≤ y ≤ 2, and n is the anionic charge of an impurity An−.2,27
However, the existence of intermediate phases due to disorder, hydration and the incorporation of impurities has been proposed and numerous methods of denoting these materials exist, including αam, α*, α′, IS, and βbc.11,21,52,53These notations are used inconsistently between reports by different authors and are often ambiguous and redundant.
Several studies have linked structural changes in Ni(OH)2 electrodes and devices to their performance. As an example, the Ni(OH)2/NiOOH redox pair is used extensively for the anodes of secondary alkaline batteries, including NiCd and NiMH,54and it is generally agreed to be limited by electron and proton conductivities, which depend on the crystal microstructure.41In one study, the incorporation of Co impurities in a β-Ni(OH)2 electrode was observed to improve its charge capacity, although the simultaneous incorporation of other types of structural disorder was not considered, and therefore, it cannot be conclusively stated whether structural disorder or impurities are responsible for the performance improvements.29In another
example, the electrochromic efficiency and stability during electrochemical cycling of precipitated Ni(OH)2 films were linked to the nickel salts used during preparation, although, without further details of the structural differences, the authors were unable to determine the origin of the differences between samples.14This demonstrates the need for methods to measure
the incorporation of anions from commonly used nickel salts,
Received: April 12, 2012
Revised: May 22, 2012
Published: May 29, 2012
such as sulfate, chloride, and nitrate, and separately examine other types of disorder, such as hydration and crystal defects. Such work will allow more systematic investigations of the link between structural changes and material performance.
Although impurities and defects can improve electrode per-formance, they can also cause instability; for instance, α-Ni(OH)2 is not currently used in battery applications because its charge capacity tends to decrease more rapidly on cycling than that of β-Ni(OH)2electrodes.29One can consider, as an example, that the slow leaching of impurities could cause other problems, e.g., chloride anions initiate pitting corrosion of certain metals that may be used elsewhere in a device. Thus, methods to clearly identify different types of disorder and impurities in the different phases of Ni(OH)2will allow useful disorder to be incorporated while simultaneously deliberately avoiding problematic disorder that destabilizes the material.
The introduction of such terms as active/deactivated α and active/deactivated β to describe Ni(OH)2 electrodes demon-strates a lack of knowledge about both of these phases and reaffirms their practical importance.52 A more complete
description of the two main phases of Ni(OH)2 and any intermediates will be invaluable to research focused on applied Ni(OH)2 electrochemistry. The ability to measure and, ultimately, to control the types of disorder present in an electrode or catalyst material will allow for the optimization of its performance, as determined by charge capacity, electrochromic efficiency, or catalytic activity, while simultaneously enabling improvements in the long term stability of an electrode or device. The present work utilizes Raman and IR vibrational spectroscopy using modern instruments that offer higher resolution and sensitivity than previously reported, supported by XPS and fixed incidence XRD measurements, to re-examine the fine structural details of Ni(OH)2. It is from the combination of these four analytical techniques with a review of previous studies that we now present a comprehensive, yet simplified, model of Ni(OH)2 that considers its possible phases, incorporation of impurities and structural disorder. For example, our XRD patterns of β-Ni(OH)2show crystallographic disorder, which allows us to rationalize the appearance of additional, and previously unidentified, stretching modes in the Raman and IR spectra. As another example, N peaks in the XPS spectra of α-Ni(OH)2prepared from a Ni(NO3)2solution indicates that nitrate anions are incorporated in its structure. By observing the relative intensities of Raman and IR peaks for the sample, we conclude that the nitrate anions occupy at least two distinct chemical environments. This study identifies and assigns, for the first time, all of the lattice modes of β-Ni(OH)
2 using factor group analysis and summarizes the known Raman and IR peaks for both α- and β-Ni(OH)2.
2. EXPERIMENTAL METHODS
2.1. Material Preparation. Metallic Ni foil (Alfa Aesar, ≥99%, 0.127 mm) electrodes (1 cm × 2 cm) were attached to Ni wire (Alfa Aesar, 99.9%, 0.065 mm diameter) by electric arc welding. The wire and one end of the electrode were covered with Teflon tape. The Ni foil substrates were washed with acetone and ethyl alcohol before sonicating them in high purity water (Millipore Milli-Q, 18.2 MΩ cm). Immediately after, the substrates were cleaned in an acid bath (50% acetic acid, 30% phosphoric acid, 10% sulfuric acid, 10% nitric acid, 85 °C) for 30 s then rinsed again with excessive amounts of high purity water. Ni hydroxide films were formed by the conditions and treatments listed in Table 1. A Ni wire (∼10 cm long) served as a
counter electrode. Electrochemical treatments were performed using a Solartron Analytical 1470E multistat controlled with MultiStat software (v. 1.5a, Scribner Associates Inc.). Deposition solutions were prepared from NiSO4·6H2O (Alfa Aesar, ≥ 98%), NiCl2·6H2O (J.T. Baker, assay = 100.7%), and Ni(NO3)2·6H2O (Alfa Aesar, ≥ 98%). All solutions were prepared with high purity water. Solution concentrations were selected for efficient precipitation based on reported studies.48The current density and deposition times were selected to form α-Ni(OH)2 films generally sufficiently thick to be identified by the spectroscopic methods. Aging solutions were prepared from KOH pellets (Fisher Scientific, ACS certified).
Sample α1 was prepared in duplicate, and each sample was analyzed by XRD, XPS, Raman spectroscopy, and FT-IR spectroscopy to confirm reproducibility in the sample prepara-tion and measurement methods. Sample α3was also prepared twice, and each sample was analyzed by XPS, Raman, and FT-IR spectroscopy to further confirm reproducibility. Samples β1, β2, and β3were stored in high purity water after aging in base and were dried immediately before analysis. The preparation methods for the β-phase samples were considered to be well-controlled and reproducible because the α-phase samples were found to be reproducible, and the measurements for the three β-phase samples gave similar results.
2.2. X-ray Diffraction (XRD). Samples were analyzed using a Bruker AXS D8 DISCOVER diffractometer. Fixed incidence (5°) measurements were taken at 0.02° point−1and 3 s point−1 using a Cu Kα X-ray source (λ = 1.54 Å). Data were smoothed for presentation with a 10-point, second order Savitzky−Golay filter. 2.3. X-ray Photoelectron Spectroscopy (XPS).Samples were analyzed with a Kratos Analytical Axis Ultra DLD equipped with a mono Al Kα X-ray source. Survey spectra, used for elemental quantification, were collected at 160 eV pass energy, and high-resolution spectra of the Ni 2p and the C 1s regions were collected at 20 eV pass energy. All spectra were collected at a 54° takeoff angle. Spectra were processed with CasaXPS (v. 2.3.16dev95, Casa Software Ltd.) using Shirley backgrounds and the Ni 2p peak positions and widths for β-Ni(OH)2, NiO, and Ni metal reported by Biesinger et al. The elemental relative sensitivity factors (RSF) provided by Kratos Analytical were used for elemental quantification. Measured binding energies were adjusted to compensate for the shift that arises from a buildup of electrostatic charge by setting the adventitious hydrocarbon C 1s peak to the binding energy 284.8 eV.55
2.4. Raman Spectroscopy.The Raman measurements were performed at room temperature (22 °C) employing 1 mW of 457 nm laser light (Cobalt Twist diode-pumped solid state laser) for excitation in a backscattering geometry using the confocal microscope with a 100× objective on a Jobin-Yvon T64000 triple Table 1. Methods Used for Sample Preparation
sample materialstart
current density
(mA cm−2) time solution temperature(°C)
α1 substrate −2.5 10 min 0.1 M
NiSO4
22 α2 substrate −2.5 10 min 0.1 M NiCl2 22
α3 substrate −2.5 2 min 0.1 M Ni(NO3)2 22 β1 α1 N/A 185 h 30% KOH 90 β2 α2 N/A 185 h 30% KOH 90 β3 α3 N/A 185 h 30% KOH 90 α/β α2 N/A 140 h Water 22
spectrometer operated in the subtractive mode and equipped with a back-illuminated Si charge-coupled-device detector. The sample surfaces, in general, were not planar, comprising flatter areas surrounded by hilly areas. The laser beam diameter (∼0.8 μm) was sufficiently small to lie within these regions and so measurements were made in three areas on each sample: a flatter area, a hilly area, and an area combining both topological areas. Generally, the features observed in each spectrum were the same for all areas, but the hilly regions gave the strongest signal consistent with their greater film thickness (∼1 μm higher than the flatter areas). From depth dependent measurements of the Raman intensity in flatter areas using the confocal feature of the Raman microscope, the Ni(OH)2 film thicknesses were estimated to be ∼5 μm. Some of the samples exhibited irregular cracks in the film (see, for example, Figure 1) that were probably
introduced by stress during drying of the films. These cracks, which could reach down to the Ni substrate, were avoided during Raman measurements. Data were smoothed for presentation with a 25-point, second order Savitzky−Golay filter.
2.5. Fourier Transform-Infrared (FT-IR) Spectroscopy. The infrared measurements were performed at room temperature
in a nitrogen-purged sample chamber using a Bruker Hyperion microscope with a 15× objective on a Bruker Tensor 27 FT-IR operated in the reflective mode and equipped with a mercury cadmium telluride (MCT) detector. The light diameter was several millimeters and thus included both topological areas described above. An untreated substrate was used to set the instrument zero. Spurious peaks arising from H2O and CO2in the sample chamber were removed from the spectra with OPUS software (v.4.2, Bruker Optik GmbH).
3. RESULTS AND DISCUSSION
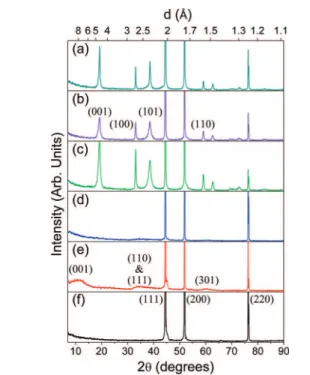
3.1. X-ray Diffraction Patterns. All measured XRD patterns show three intense peaks that arise from the metallic Ni substrate, thus indicating that the X-rays penetrate the entire film (Figure 2). The relative intensities of the Ni metal (220) peaks in
the β-Ni(OH)2samples are much weaker than for the α films. This indicates that the transmission at this angle is greater for the α than for the β films, implying that the β films are more crystalline than the α films and, from the relative intensities between samples, qualitatively shows that the sample thickness is β1> β2> β3. The patterns from the β-Ni(OH)2films show all the expected peaks for this phase.44The (100) peaks are sharper than the (001) and (101) peaks, which indicates that there is greater order within the ab-plane than along the c-direction. This observation, with the layered structure of β-Ni(OH)2, implies stacking faults of uniform Ni(OH)2sheets. From the full-width half-maxima of the (100) peaks, the β-films have similar crystallinity within the ab-plane, whereas the disorder in the
c-direction is the greatest for sample β33and the least for sample β1. The weak, broad diffraction peaks in the α-Ni(OH)2samples demonstrate that these are highly disordered films, which is expected from previous studies that report similar diffraction patterns for α-Ni(OH)2.10 Only the Ni substrate was clearly Figure 1.Photographs taken through the Raman microscope objective
with objectives of (a) 50× and (b) 100× showing the cracked and bumpy nature (hence the fuzzy focus in regions of different height) of the Ni(OH)2film for sample α3.
Figure 2.Diffraction patterns for samples (a) β1, (b) β2, (c) β3, (d) α2, (e) α3, and (f) Ni metal substrate with the Miller indices for the first diffraction peaks of each material identified. All patterns are plotted on the same intensity scale. A Cu Kα X-ray source was used.
observed in the XRD pattern for sample α1because the samples were thinner and had a high degree of structural disorder.
3.2. X-ray Photoelectron Spectra.The XPS measurements of samples β1, β2, and β3(see Figure 3a) agree well with reported
β-Ni(OH)2spectra.55Sample β1shows that some K (∼2%) from the KOH aging solution remained on the surface. β2is pure, and β3contains a small amount of Ca (∼0.7%), likely from impurities present in the Ni(NO3)2salt used to deposit this film. Sample α3
was prepared twice, and Ca was detected in only one of the films (∼0.2%). Sample α1contains S (∼2%), α2contains Cl (∼2%), and sample α3contains N (∼3%). This suggests that impurities, i.e., sulfate, chloride, and nitrate anions, are incorporated during electrochemical precipitation of α-Ni(OH)2and are eliminated from the structure during the aging from the α to the β form.
The Ni 2p region for the α samples shows NiIIpeaks similar to those observed in the β-Ni(OH)2 spectra. However, subtle differences in the peak shapes and relative intensities between the αand β phases result in greater deviations between fitted line-shapes and the measured data (Figure 3b). At present, there are no reported XPS peak-fitting parameters for α-Ni(OH)2.
These measurements demonstrate that XPS cannot easily differentiate the two phases. However, XPS can differentiate Ni(OH)2from metallic Ni and other nickel oxides, such as the air-formed nickel oxide on the Ni substrate (Figure 3c). It is also an effective way to identify and quantify elemental impurities on the surface.
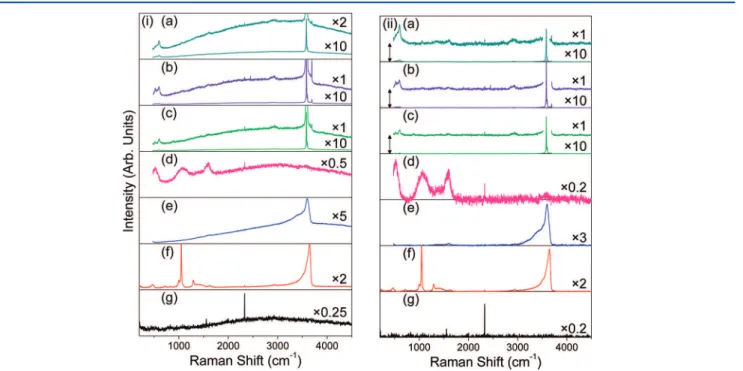
3.3. Raman Spectra. As measured, several of the Raman spectra show a strong background (Figure 4i) that can be removed computationally (Figure 4ii). All samples show a sharp feature at 2330 cm−1
, which is an artifact of the laser excitation source. All samples also show a weak feature at ∼1556 cm−1, which corresponds to a two-magnon transition that arises from the room temperature antiferromagnetism of NiO.56 The presence of this peak demonstrates that the air-formed oxide (NiOx, x ≈ 1) on the metal substrate, only 9−12 Å thick,
17,18
underlies all the deposited Ni(OH)2films. The Raman spectra of samples β1, β2, and β3are very similar, whereas the spectra of sample α3contain several peaks that are not observed for sample α2.
The Raman spectra for sample α1(not shown) have very low signal-to-noise and only contain a broad, weak band centered at ∼3575 cm−1 (α-Ni(OH)2, O−H stretch) and medium peaks from sulfate ions (see section 3.8). Because the weak lattice modes could not be observed, this sample is not discussed in more detail.
Figure 3.X-ray photoelectron spectra (■) for samples (a) β3, (b) α3, and (c) Ni metal substrate curve-fitted with β-Ni(OH)2 (---), NiO (•••), and Ni (−•−) components using the line shapes and method of Biesinger et al.55No literature references are presently available for the line shape of α-Ni(OH)2. The solid red line shows the calculated line shape, and the solid black line shows the Shirley background.
Figure 4.Raman spectra of samples (a) β1, (b) β2, (c) β3, (d) α2, (e) α3, and (f) the untreated Ni substrate. The data are shown on the same intensity scale (i) as collected and (ii) after background subtraction. The y-axis is linear, and select traces are rescaled by a factor, indicated on the plots. Traces iia, iib, and iic are offset as shown by double-headed arrows.
3.4. Infrared Spectra.All IR spectra contain sharp, weak features corresponding to the asymmetric bending, at 668 cm−1, and asymmetric stretching, at 2341 cm−1and 2361 cm−1, modes of CO2gas and some sharp, weak interference that arises from bending, at ∼1600 cm−1, and asymmetric stretching, at ∼3750 cm−1, modes of H
2O vapor in the sample chamber (Figure 5). All
spectra also contain a sharp, weak feature at 2170−2180 cm−1 due to an adsorbed species, likely CO2. The absolute absorbance of each sample cannot be determined because the exact film thicknesses are unknown, which affects the relative peak intensities. The reflectance of the substrates varies slightly. This causes the spectra to be offset by unknown, however, constant values, assuming that the reflectance is independent of the wavelength. A large, periodic background arising from the Fourier transform procedure was computationally removed from the IR spectra of sample β1. Therefore, peak shapes and absolute reflectance values are subject to some error. All other IR spectra are presented as measured. The results of the IR measurements complement the Raman spectra well, showing that samples β1, β2, and β3are very similar, whereas sample α3shows several peaks that are not observed in samples α1or α2, which correspond to nitrate bands. Sample α1has very high reflectance and a low signal-to-noise ratio, which indicates that it is very disordered and scatters the incident IR beam. Several peaks that are not present in samples α2and α3are observed in α1that originate from sulfate anions.
The IR spectra for β-Ni(OH)2are more complex than the Raman spectra because of transverse optical (TO)/longitudinal optical (LO) splitting of the vibrational modes. For asymmetric vibrational modes involving ionic species, TO modes do not create long-range Coulomb effects, whereas LO modes do. Additional restoring forces act upon the oscillating nuclei and cause LO transitions to occur at higher energies than their
corresponding TO transitions. Further, LO and TO transitions of different modes with the same symmetry may not cross over in energy.57The TO/LO splitting also causes peak intensities to depend on the crystal orientation relative to the polarization of the IR beam. However, this study examines polycrystalline samples using nonpolarized light, so this effect is not observed. The LO/TO effect is not observed for symmetric, e.g., Raman-active, modes.
3.5. Vibrational Modes of β-Ni(OH)2. 3.5.1. Raman-Active Vibrational Modes of β-Ni(OH)2. From the symmetry of β-Ni(OH)2, the factor group theory predicts four Raman-active transitions, two with Egsymmetry and two with A1 g.57It is well-established that three of these modes are at 310−315 cm−1
, 445− 453 cm−1, and 3581 cm−1. The symmetry of these transitions has been disputed because the position of the fourth mode has not been clearly determined.41However, it is worth noting that the Raman-active lattice modes of brucite [Mg(OH)2], which is isostructural, are at similar positions: 280 cm−1, 443 cm−1, 725 cm−1, and 3652 cm−1
.58 A detailed computational analysis of brucite shows the atomic displacements corresponding to each mode.57Thus, the peak measured at ∼880 cm−1(Figure 6a) is
here ascribed to the final lattice mode of β-Ni(OH)2 and the symmetries of the transitions can be assigned (Tables 2−5).
An additional band at 508−519 cm−1is sometimes reported and is visible in Figure 6a. The intensity of this feature varies between samples and is generally more intense for less crystalline samples.41Although it has sometimes been ascribed to a lattice mode, the frequency is much lower than expected for the Eg mode,57and its intensity can vary independently of the other lattice modes.30Inelastic neutron scattering measurements show
that there is an acoustic vibrational mode at ∼250−270 cm−1, the harmonic overtone of which should be observable by Raman spectroscopy.41Second order modes are typically very weak and increase in intensity for disordered samples; hence, the peak is assigned to this transition, consistent with the reported intensity-crystallinity correlation.
A Raman band is observed at 601 cm−1(Figure 6a) that has not been previously reported, presumably due to instrumental limitations. Since this peak is very weak and is not a predicted lattice mode, this peak is taken to be the harmonic overtone of the Egtransition at 306−318 cm−1.
A very weak feature at ∼1600 cm−1is superimposed with a weak peak at ∼1630 cm−1(Figure 7c). The latter is ascribed to the O−H bend of H2O that has adsorbed on the material surface or has been trapped within the material, whereas the former is similar in shape to free water, however, in the wrong position.
Figure 5.Infrared reflectance spectra of samples (a) β1, (b) β2, (c) β3, (d) α1, (e) α2, (f) α3, and (g) Ni substrate. The broad feature in spectra d at ∼2600 cm−1is an artifact of the Fourier transform from low sample reflectance. Inset shows high frequency combination bands. Inset spectra are all plotted on the same −log R scale with each box 0.06 units
in height and tick marks spaced 0.03 units apart. Figure 6.Raman spectra of samples (a) β3, (b) α2, and (c) α3showing lattice modes. (d) The Raman spectrum of water is shown for comparison. All spectra are plotted on the same intensity scale.
Thus, this is taken to be the O−H bend for a small degree of hydration in the structure (formally termed a libration mode for lattice species57).
A sharp band at 3601 cm−1is present in the Raman spectra for samples β1 and β2. This peak has previously been variously assigned to adsorbed H2O, crystal defects, impurities, surface OH groups, and the O−H stretch for a new crystal phase, βbc-Ni(OH)2.29,31,41The intensity of this peak has been reported to
increase with decreasing crystallite size, as measured by XRD peak width.29However, only the diffraction peaks involving the crystallographic c-axis were broadened. This indicates stacking faults rather than small crystallites, and thus, the Scherrer equation cannot be properly applied. Re-examination of the results reveals that the Raman peak intensity at 3601 cm−1 increases as disorder along the c-axis increases. The peak intensity decreases when samples are heated to 100−150 °C.29
We now propose that the βbc phase is more accurately described as β-Ni(OH)2that has stacking fault disorder. In the O−H stretching modes, the H atoms approach adjacent sheets more closely than in other vibrational modes, and hence, the Raman peak at 3581 cm−1is shifted to 3601 cm−1. There must be a finite number of relative sheet positions and orientations that occupy local free energy minima. If the sheets do not rotate, then two structures are predicted, namely (a) Ni atoms in register between adjacent sheets, which is the thermodynamic minimum, and (b) a staggered configuration in which Ni atoms are in register between alternating sheets (if the sheets do rotate, then the rotation would be by 60°, and hence, two more new structures are permitted). Though the true geometry is unknown, this kinetically stable structure has slightly different O−H stretching modes and restructures to the stable form when heated to 100−150 °C. This disordered structure has never been reported in excess of the ordered β-Ni(OH)2component, and thus, it can only coexist as part of a parent β phase material. Therefore, the evidence does not support the existence of an additional crystallographic phase but rather a disordered form of β-Ni(OH)2.
The number of exchanged electrons per Ni atom in β-Ni(OH)2 electrodes has been found to approach unity for materials with a strong Raman band at 3605 cm−1(corresponding to our peak at 3601 cm−1), whereas it is close to 0.8 for samples that do not show this peak. This was previously attributed to the increased surface area of smaller crystallites.29However, our reinterpretation of this peak leads to the conclusion that materials with c-axis disorder are better candidates than more ordered structures. The photo-catalysts prepared by Yu et al. also have c-axis disorder that can be observed from their XRD patterns,15 which may indicate that photocatalytic activity is also linked to stacking faults in the crystal structure.
A weak but sharp peak is observed at 3655 cm−1 that is assigned to the IR-active disordered O−H stretch. Because this is an out-of-phase peak, it is quite weak in the Raman spectrum. However, the disorder or the change in symmetry makes it only weakly visible. It is also possible that this is a localized mode around Ca point defects from the Ni(NO3)2 starting material (cf., A1gfor bulk Ca(OH)2is observed at 3620 cm−158). Ca was not detected in the more-ordered samples β1and β2, and the peak is not present in their Raman spectra, which makes either explanation equally plausible.
One additional Raman peak is observed at 3688 cm−1. The intensity is sometimes reported to be linked to that of the peak at 3601 cm−1. However, the peaks have also been observed to vary independently of each other.29,30Bernard et al. observed that dry
samples, which initially show this peak, that are rinsed with water and reanalyzed while still wet, lose the peak completely.30This indicates that it is a surface-related phenomenon, although the exact origin is unclear. Bernard et al. proposed that the O−H stretch for surface hydroxide groups is at higher energy than for those opposed by adjacent layers. Upon hydration, the transition becomes similar to either the bulk O−H stretching mode, A1g, or Table 2. Raman Peaks for β-Ni(OH)2Prepared from
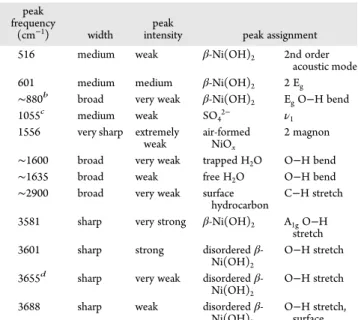
Ni(NO3)2Then Aged in KOH [β3] a
peak frequency
(cm−1) width intensitypeak peak assignment
516 medium weak β-Ni(OH)2 2nd order
acoustic mode 601 medium medium β-Ni(OH)2 2 Eg
∼880b broad very weak β-Ni(OH)
2 EgO−H bend
1055c medium weak SO
42− ν1
1556 very sharp extremely
weak air-formedNiOx
2 magnon ∼1600 broad very weak trapped H2O O−H bend
∼1635 broad weak free H2O O−H bend
∼2900 broad very weak surface
hydrocarbon C−H stretch 3581 sharp very strong β-Ni(OH)2 A1gO−H
stretch 3601 sharp strong disordered
β-Ni(OH)2
O−H stretch 3655d sharp very weak disordered
β-Ni(OH)2
O−H stretch 3688 sharp weak disordered
β-Ni(OH)2
O−H stretch, surface
aSamples aged in KOH after preparation from NiSO4[β1] and NiCl2
[β2] gave the same results except as noted.bNot observed in samples
prepared from NiSO4[β1].cOnly observed in samples prepared from
NiSO4[β1].dOnly observed in samples prepared from Ni(NO3)2[β3].
Figure 7.Raman spectra of samples (a) α3, (b) α2, and (c) β3showing O−H internal modes. The nitrate ion vibrational modes, labeled ν1−ν4 are shown for sample α2. These features are absent in samples α1and β2. (d) The Raman spectrum of water is shown for comparison. All spectra are plotted on the same intensity scale.
that of free H2O.30The peak observations and assignments are summarized in Table 2.
3.5.2. Infrared-Active Vibrational Modes of β-Ni(OH)2. Factor group theory predicts four IR-active vibrational modes for β-Ni(OH)2: Two A2uand two Eu.57There are twice as many IR peaks as there are Raman peaks for β-Ni(OH)2because of transverse optical (TO)/longitudinal optical (LO) splitting (see section 3.4). The magnitude of this splitting effect has been calculated for brucite and can be used to assist peak identification for β-Ni(OH)2.57
Only four IR lattice modes have been previously identified: 332−354 cm−1, 440−475 cm−1, 510−553 cm−1, and 3630− 3650 cm−1.41
The LO/TO splitting for the A2umode at ∼3635 cm−1 is expected to be quite small (cf., 14 cm−1
for Mg(OH)257). The observed peaks for samples β2and β3exhibit flat tops because of the low reflectance at this higher sample thickness. The peak for the thinner sample β1 is better defined and shows peaks at 3629 cm−1and 3643 cm−1, which are assigned to the A
2u(TO) and A2u(LO) modes, respectively. An IR study of β-Ni(OD)2showed that the two apparent peaks at 350 cm−1 and 450 cm−1 are actually each composed of two overlapping peaks: One each that red-shifts on deuteration and one each that does not observably shift. The peak at 550 cm−1 is also observed to red-shift on deuteration.7The two remaining A2umodes are not predicted to significantly shift on deuteration, whereas all four of the Eumodes are;57hence, these peaks can be assigned accordingly. This is consistent with a study that observed the shift in position of three lattice modes for Mg1−xNix(OH)2, where 0 ≤ x ≤ 1.20 The remaining Eumode is predicted at a frequency greater than 550 cm−1 and has a very large TO/LO split (cf., 370 cm−1for brucite); thus, this mode is assigned to the broad band at ∼1030 cm−1 (Figure 9). Because of its low intensity, this peak is previously unreported, although close examination reveals that it may be visible as a weak shoulder in published results.29Thus, the eight IR-active lattice modes have now been identified and assigned (Table 5).
A broad peak at ∼1630 cm−1(Figure 9) arises from the O−H bending mode of H2O that is either adsorbed on the material surface or trapped within the structure. The peaks at ∼3380 cm−1 and ∼3450 cm−1
are from the O−H stretch of the H2O (Figure 10).
A sharp but weak peak measured at 3581 cm−1corresponds exactly to the Raman-active A1gtransition (Figure 10). This is formally forbidden in IR spectroscopy; however, structural disorder allows a very weak peak to be seen in the IR spectra. Conversely, a weak A2u mode should also be allowed in the Raman spectrum. However, this mode overlaps with other features of the sample and hence cannot be observed in the Raman spectrum. A shoulder at 3601 cm−1corresponds to the in-phase O−H stretch of disordered β-Ni(OH)2discussed in the Raman section. The corresponding out-of-phase O−H stretch (LO) is a strong, sharp peak at 3652 cm−1. The corresponding TO mode is visible in the spectra for sample β1as a shoulder at 3634 cm−1
. Note that disorder shifts both the TO and LO modes to higher frequency by 5−9 cm−1, which reaffirms that these two peaks are connected.
The peak at 2658 cm−1is sharp, very weak, and close to the positions reported for the A2umode of β-Ni(OD)2(cf., 2705 cm−1,7 2680 cm−1
,25and 2690 cm−142
). The difference in position could arise because this study observes localized modes from the naturally present D (0.0115%), whereas the reference materials were highly enriched.
Several previously unreported weak features are observed in the IR spectra for β-Ni(OH)2 that can be ascribed to combination bands. Since this structure has an inversion center, the overall symmetry must be odd (ungerade) for a transition to be IR-active. Thus, all overtone transitions are even and therefore Raman-active, whereas an IR mode or an acoustic mode combined with a Raman mode is odd and therefore IR-active. The peak assignments (Tables 3 and 4) were created by
considering the IR and Raman lattice modes (Table 5) and the acoustic transitions observed by INS.41To conclusively assign
these peaks, single crystal measurements using plane-polarized light are necessary, especially the modes for which multiple combinations are possible. One particularly interesting combi-nation is the sharp peak at 3520 cm−1 assigned to the Table 3. Infrared Peaks for β-Ni(OH)2Prepared from NiSO4 Then Aged in KOH [β1]
peak frequency
(cm−1) width intensitypeak peak assignment
<600a medium strong β-Ni(OH)
2 A1g+ acoustic mode
combination ∼635 sh medium weak β-Ni(OH)2 Eg+ A2u(TO)/Eg+ Eu
(TO) combination ∼1045 medium medium β-Ni(OH)2 Eu(LO) O−H bend
1285 sharp weak surface
hydrocarbon C−H bend 1385 medium medium β-Ni(OH)2 Eg+ A2u(TO)
combination ∼1560 medium weak β-Ni(OH)2 Eu(LO) + 2nd order
acoustic mode ∼1640 medium weak free H2O O−H bend
2655 sharp very weak β-Ni(OH)
(OD) A2ustretch(TO/LO) O−D 2855 medium weak surface
hydrocarbon C−H stretch 2880 sh medium weak surface
hydrocarbon C−H stretch 2928 medium weak surface
hydrocarbon C−H stretch 2960 sh medium weak surface
hydrocarbon C−H stretch 3380 medium weak free H2O O−H stretch
3450 medium weak free H2O O−H stretch
3520 sharp weak β-Ni(OH)2 A1g−acoustic mode
subtraction 3566 sharp weak β-Ni(OH)2 A1g−acoustic mode
subtraction 3580 sharp medium β-Ni(OH)2 A1 gO−H stretch
3601 sh sharp medium disordered β-Ni(OH)2
O−H stretch (in-phase) 3629 sharp very
strong β-Ni(OH)2 A2ustretch(TO) O−H 3634 sh sharp strong disordered
β-Ni(OH)2
O−H stretch (TO, out-of-phase) 3643 sharp very
strong β-Ni(OH)2 A2ustretch(LO) O−H 3652 sharp strong disordered
β-Ni(OH)2
O−H stretch (LO, out-of-phase) 4040 medium medium β-Ni(OH)2 A1g+ A2u(LO)/A1g+
Eu(LO)
combination 4270 broad very weak β-Ni(OH)2 3rd order combination
7020 sharp very weak β-Ni(OH)2 A1g+ A2u(TO/LO)
combination
aPeak maximum is below the instrumental cutoff, so the exact position
combination of the A1gmode and a subtractive mode, i.e., a hot band, for the acoustic transition at ∼60 cm−1(Figure 10).41Hot
bands are not typically observed in IR spectra at room temperature. However, the acoustic transition is sufficiently low in energy that a Boltzmann distribution predicts a population ratio of 57 to 43 for the ground state and first excited state, respectively. Another combination of the A1gand a subtractive mode is observed at 3566 cm−1.
3.6. Vibrational Modes of α-Ni(OH)2. 3.6.1. Raman-Active Vibrational Modes of α-Ni(OH)2.The Raman spectra of α-Ni(OH)2 show lattice modes at 460 cm−1 and 495 cm−1 (Figure 6). Presumably due to instrumental limitations, only the former peak has been previously reported.32,34,36Weak features, assigned in this work to second order transitions, are observed at ∼790 cm−1 and ∼1075 cm−1. Some authors report additional Raman-active lattice modes.32,39 However, these are not
observed in the present work and can all be ascribed to β-Ni(OH)2impurities.
Structural disorder causes the internal O−H bending mode of lattice OH to split and broaden into a weak feature at ∼1400 cm−1 (Figure 7). Since the Raman intensity is quite weak, it is necessary to use IR, discussed below, to observe fine details for these peaks. Further, this broad feature underlies several nitrate bands in sample α3and is therefore unclear. A second internal O−H bending mode at 1590−1620 cm−1is similar in width and only slightly shifted from the position of free H2O. Thus, this can be assigned to the O−H bending mode of intercalated H2O. A third internal O−H bending mode is observed at 1630 cm−1, which arises from adsorbed H2O on the surface or H2O trapped within the structure.
There are several O−H stretching modes from 3240 to 3515 cm−1 that arise from free H2O (Figure 8). The internal O−H stretching modes from lattice OH and intersheet H2O are visible from 3590 to 3650 cm−1. This region is quite different between samples α2 and α3 and such differences have previously been suggested to arise from the presence of intermediate phases.36 However, since the lattice modes do not vary as significantly between samples, this supports that this phase tends to adopt disorder by the incorporation of foreign ions, variable hydration, and randomly oriented layers.11 This is confirmed by our measurement of two preparations of sample α2 where no variation in lattice mode frequencies was found, but the frequencies of the internal modes of the nitrate ions (see section 3.7) and the O−H stretching frequency are different. The shifts in frequency are caused by variations in the local environment and/or stress (see section 2.4). These peak observations and assignments are summarized in Tables 6 and 7.
3.6.2. Infrared-Active Vibrational Modes of α-Ni(OH)2. There are three IR-active α-Ni(OH)2modes at 380−400 cm−1, 460−480 cm−1
, and 625−670 cm−1
(Figure 9). Only the last of these is observed in this work due to instrumental limitations. Weakly visible combination bands are observed at 835 cm−1and 1055 cm−1. The latter is not visible in the spectra of sample α
2 because it is obscured by nitrate bands.
Two peaks from the O−H bending modes of lattice OH are observed at 1380−1390 cm−1and 1480−1490 cm−1(Figure 9). These peaks shift slightly between samples because of structural disorder and the mechanical stress induced when the materials dried. The O−H bending mode from intercalated H2O is measured at 1600 cm−1, which matches the Raman spectra. Note that the absorbance of the first three O−H bending modes is too great to be assigned to free H2O that is trapped within the material, whereas a weaker peak is observed at 1630 cm−1that is consistent with this assignment.
As in the Raman spectra, several O−H stretching modes are observed in the IR spectra of the α phase samples (Figure 10). Broad features from free H2O are measured at 3220−3515 cm−1, and peaks corresponding to lattice OH and intersheet H2O are observed at 3570−3640 cm−1. The variability from structural disorder is the same as in the Raman spectra.
A combination band of the O−H stretch and a lattice mode is measured at 4260−4280 cm−1. A combination of O−H stretching modes is measured at 7140 cm−1
(Figure 5 inset). Additional features are difficult to distinguish by FT-IR because of periodic interference fringes arising from the Fourier transformation. These peak observations and assignments are summarized in Tables 8−10. Our results are compared with literature values in Table 11.
3.7. Nitrate Bands.From the XPS elemental analysis, nitrate bands are only expected in the vibrational spectra of sample α2. Free nitrate has D3hsymmetry and four vibrational modes: ν1at Table 4. Infrared Peaks for β-Ni(OH)2Prepared from
Ni(NO3)2Then Aged in KOH [β3] a
peak frequency
cm−1 width intensitypeak peak assignment
<600b medium strong β-Ni(OH)
2 A1g+ acoustic mode
combination 665 sh medium weak β-Ni(OH)2 Eg+ A2u(TO)/Eg+
Eu(TO)
combination 1030 medium medium β-Ni(OH)2 Eu(LO) O−H bend
1285 sharp weak surface hydrocarbon C−H bend ∼1400 broad medium β-Ni(OH)2 Eg+ A2u(TO)
combination ∼1550 medium medium β-Ni(OH)2 Eu(LO) + 2nd order
acoustic mode ∼1630 broad medium free H2O O−H bend
2658 sharp very weak β-Ni(OH)(OD) A2u(TO/LO) O−D
stretch 2855 sh medium weak surface hydrocarbon C−H stretch 2880 medium weak surface hydrocarbon C−H stretch 2930 medium weak surface hydrocarbon C−H stretch 2960 sh medium weak surface hydrocarbon C−H stretch 3140 medium very weak β-Ni(OH)2 O−H bend
combination 3380 medium weak free H2O O−H stretch
3450 medium weak free H2O O−H stretch
3520 sharp weak β-Ni(OH)2 A1g−acoustic mode
subtraction 3566 sharp very weak β-Ni(OH)2 A1g−acoustic mode
subtraction 3581 sharp weak β-Ni(OH)2 A1gO−H stretch
3601 sh sharp very weak disordered β-Ni(OH)2
O−H stretch (in-phase) ∼3635 sharp extremely
strong β-Ni(OH)2 A2ustretch(TO/LO) O−H 3652 sharp strong disordered
β-Ni(OH)2
O−H stretch (LO, out-of-phase) 4035 medium weak β-Ni(OH)2 A1g+ A2u(LO)/A1g
+ Eu(LO)
combination ∼4275 broad very weak β-Ni(OH)2 3rd order
combination 7020 sharp very weak β-Ni(OH)2 A1g+ A2u(TO/LO)
combination
aThe sample prepared from NiCl2 then aged in KOH [β2] gave the
same results.bPeak maximum is below the instrumental cutoff, so the
1050 cm−1 (A′
1, IR-inactive), ν2 at 831 cm−1 (A″2, Raman-inactive), ν3at 1390 cm−1(E′), and ν4at 720 cm−1(E′).59In solution, the ν1band becomes weakly IR-active and the ν3band splits into a doublet at 1356 and 1410 cm−1, both of which are weakly Raman-active. This split results from rotation and is
therefore only expected if the chemical environment allows free rotation. Further, these bands can shift and split into additional modes when nitrate interacts with cations to form ion pairs.60
The Raman spectra of sample α2show all four nitrate modes (Figure 7) with the most intense peak at 1047 cm−1(ν
1), and the IR spectra also show all four free nitrate peaks (Figure 9) with the strongest peak at 1340 cm−1(ν
2). The hydrated intercalation Table 5. Comparison of Literature Values for the Vibrational Modes in β-Ni(OH)2and Equivalent Modes in Mg(OH)2(Brucite)
Mode Frequency (cm−1)
our peak assignment this study literature Mg(OH)2
Raman
Eglattice mode 315,5319,22310,29310,30312−313,32318,35306,36315,38309,3931341 28058
A1glattice mode 450,5450,19458,22450,29445,30448−453,32449,35445,36450,38446,3944741 44358
2nd order acoustic mode 516 510,19519,22515,29510,30519,32510,36517,38510,3950841
2Eg2nd order lattice mode 601
EgO−H bend ∼880 ∼850,3588038 72558
trapped H2O, O−H bend ∼1600
free H2O, O−H bend ∼1635
A1gO−H stretch 3581 3581,53599,223580,283585,293570,303565,313580−3583,323580,353579,363580,383579,39358141 365258
disordered, O−H stretch 3601 3601,53605,293580,303600,313600,323600,383599,39360141
surface, O−H stretch 3688 3680,303687,31368732 Infrared
A2u(TO)/Eu(TO) lattice modes 350,6350,7348,20345,21340,22350,24354,25350,3533241 36863
A2u(LO)/Eu(LO) lattice modes ∼450,1450,6450,7451,20460,21458,22460,24475,25460,29452,3544041 56263
Eu(TO) O−H bend 517,1530,6545,7549,20520,21525,22510,24530,25525,29553,3553041 46263
Eu(LO) O−H bend 1030 1030 sh29
free H2O, O−H bend ∼1630 1620,6163029
A2u(TO) O−H stretch 3629 3640,13650,63650,73650,143635,203650,213650,243650,253639,283630,353636,41364042 369863
disordered, (TO) O−H stretch 3634 A2u(LO) O−H stretch 3643
disordered, (LO) O−H stretch 3652
A1g+ A2u(LO)/A1g+ Eu(LO) 4035 402828
3rd order combination ∼4275 427428
A1g+ A2u(TO/LO) 7020 701628
Figure 8.Raman spectra of samples (a) β3, (b) α2, and (c) α3showing O−H internal modes. (d) The Raman spectrum of water is shown for comparison. All spectra, except where noted, are plotted on the same intensity scale. Inset shows low frequency region of the figure enlarged by a factor of 15.
Table 6. Raman Peaks for α-Ni(OH)2Prepared from NiCl2[α2]
peak frequency
(cm−1) width intensitypeak peak assignment
∼790 medium weak α-Ni(OH)2 2nd order lattice
mode ∼1075 medium very weak α-Ni(OH)2 2nd order lattice
mode ∼1400 broad weak α-Ni(OH)2 O−H bend, lattice
OH 1555 very sharp extremely
weak NiO 2 magnon ∼1590 broad weak α-Ni(OH)2 O−H bend, layer
H2O
1630 sh medium very weak free H2O O−H bend
∼2900 broad very weak α-Ni(OH)2/surface
hydrocarbon 2nd order O−Hbend/C−H stretch 2935 sharp very weak surface hydrocarbon C−H stretch ∼3240 very
broad weak free H2O O−H stretch ∼3380 very
broad medium free H2O O−H stretch ∼3515 broad medium free H2O O−H stretch
3590 medium strong α-Ni(OH)2 O−H stretch
3620 medium strong α-Ni(OH)2 O−H stretch
region is considered to be amorphous and can vary considerably in size, based on the variability of the c-dimension of the unit cell.10Since these four nitrate modes are very similar to solution
nitrate, it is most likely that the nitrate ions are located in the interlayer space.
There are additional nitrate peaks close to the first three nitrate modes in the IR spectra, which implies that nitrate exists in two distinct chemical environments. It is noteworthy that the second ν1IR peak intensity is greater than the corresponding, hydrated nitrate peak, whereas in the Raman spectra, the additional mode is much less intense than the hydrated nitrate peak. This indicates that there are two sets of selection rules and confirms the presence of two types of nitrate, rather than peak splitting from ion-pairing effects. The change in selection rules also demonstrates that the second position in the crystal reduces the symmetry below D3h. It is unclear whether the second type of nitrate has a different orientation within the interlayer space or whether it substitutes lattice hydroxide.
Table 7. Raman Peaks for α-Ni(OH)2Prepared from Ni(NO3)2[α3]
peak frequency
(cm−1) width intensitypeak peak assignment
460 medium weak α-Ni(OH)2 lattice mode
495 sh medium weak α-Ni(OH)2 lattice mode
712/719a medium weak NO
3− ν4
816/840a medium weak NO
3− ν2
∼935 medium very weak α-Ni(OH)2 2nd order lattice
mode 997/1002a sharp medium NO
3− ν1
1047/1048a sharp strong free NO
3− ν1
1075 sh medium weak α-Ni(OH)2 2nd order lattice
mode 1291/1293a medium medium NO
3− ν3
∼1350 medium very weak free NO3− ν3
∼1420 broad weak NO3− 2ν4
∼1495 broad weak NO3− ν2+ ν4
1554 very sharp extremely
weak air-formedNiOx
2 magnon ∼1620 medium weak α-Ni(OH)2 O−H bend, layer
H2O
∼1630 broad weak Free H2O O−H bend
∼1695 medium very weak NO3− 2ν2
∼2900 broad very weak α-Ni(OH)2/
surface hydrocarbon
2nd order O−H bend/C−H stretch ∼2935 medium very weak surface
hydrocarbon C−H stretch ∼3240 broad very weak free H2O O−H stretch
3515 sh broad medium free H2O O−H stretch
3647/3642a medium strong α-Ni(OH)
2 O−H stretch
aTwo samples were used in this study (see section 2.1), and for some
peaks, different values were obtained, as reported in the table.
Figure 9.Infrared reflectance spectra of samples (a) β1, (b) β2, (c) β3, (d) α2, (e) α3, and (f) a thin film of water on a Ni substrate.
Figure 10.Infrared reflectance spectra of samples (a) β1, (b) β2, (c) β3, (d) α2, (e) α3, and (f) a thin film of water on a Ni substrate.
Table 8. Infrared Peaks for α-Ni(OH)2Prepared from NiSO4[α1]
a
peak frequency
(cm−1) width intensitypeak peak assignment
685 shb sharp very weak SO
42− ν2
830 sh sharp weak α-Ni(OH)2 lattice mode
combination 885 medium medium SO42−
/α-Ni(OH)2
ν4+ lattice mode
combination 980 sh medium weak free SO42− ν1
1065 medium medium SO42− ν1
∼1130 medium medium free SO42− ν3
1180 sh medium medium SO42− ν3
1410 medium weak α-Ni(OH)2 O−H bend, lattice
OH ∼1620 medium weak free H2O O−H bend
3650 broad medium α-Ni(OH)2 O−H stretch
aTwo samples were used in this study (see section 2.1). bPeak
maximum is near the instrumental cutoff, so the exact position may be lower.
Previous authors have assigned the IR peaks differently.27 However, the relative intensities of the four modes in the Raman and IR spectra confirms that the nitrate peaks are correctly identified in the present work.
From this work, the incorporation of nitrate anions into at least two distinct chemical environments in α-Ni(OH)2 can been identified by examining the Raman and IR spectra. Thus, applied research on this material will now have a method to rapidly determine any links between changes in performance or stability and the inclusion of nitrate anions in these environments.
3.8. Sulfate Bands. From sample preparation and XPS elemental analysis, sulfate bands are expected only in the vibrational spectra of sample α1. The IR spectra show weak features at 980 cm−1 and 1120 cm−1 that are similar to the positions of the ν1and ν3modes of free sulfate (cf., 981 cm−1and 1104 cm−1, respectively59). By analogy to the nitrate bands
discussed above, this may indicate that sulfate is in the hydrated interlayer space. A second pair of bands is more strongly observed in the Raman and IR spectra at 1060 cm−1and 1170 cm−1, which suggests that sulfate ions are incorporated in some chemical environment that shifts the peaks to higher frequency.
Additional bands, corresponding to ν2and ν4, respectively, are measured by Raman at 520 cm−1and both IR and Raman at 685 cm−1. These are slightly higher than expected for free sulfate (cf., 451 cm−1and 613 cm−1, respectively59
); hence, they correspond to the peaks at 1060 cm−1and 1170 cm−1. The Raman spectra also show a combination of ν1and ν2at 1590 cm−1; however, this is not observed by IR. The high degree of structural disorder hinders further investigation, and it cannot presently be concluded whether some anions are incorporated into the α-Ni(OH)2structure.
Similar to the findings for nitrate anions, our work establishes a method to measure sulfate anions in α-Ni(OH)2using Raman or
IR spectroscopy. This will allow future studies to correlate the presence of sulfate anions to changes in behavior of an electrode or catalyst.
3.9. Fluorescence.The strong background signal observed in the Raman spectra of both β films and sample α1(Figure 4i) indicates that the samples are fluorescent. Fluorescence is also observed from the air-formed NiOx on the substrate, but it is relatively weak. The fluorescence arises from the electronic structure of the NiII cations, which have 3d8 valence configurations and octahedral coordination of OH−
anions. Ideally, in the ground state (3A
2g) the three highest occupied orbitals have t2gsymmetry, and there are unpaired, spin-aligned valence electrons in two, singly occupied egorbitals. However, these orbitals can be greatly affected by small distortions of the octahedral geometry.
The crystal field splitting parameter and the Ricah B parameter for β-Ni(OH)2, assuming ideal octahedral geometry, have been reported: Δo= 9000 cm−1and B = 925 cm−1.61Yu et al. present reflectance data for precipitated Ni(OH)2and observe peaks at ∼670 nm and ∼385 nm,15which correspond to the ν2(3A2g→3T1g) and ν3(3A2g→3T2g) transitions calculated for the β phase.61Two additional peaks can be seen at ∼740 nm and ∼320 nm that are likely from α-Ni(OH)2, although the study does not provide conclusive evidence regarding this assignment.15 Formally, the d−d transitions are forbidden by the Laporte rule, Table 9. Infrared Peaks for α-Ni(OH)2Prepared from
NiCl2[α2]
peak frequency
(cm−1) width intensitypeak peak assignment
670a broad strong α-Ni(OH)
2 lattice mode
835 sharp medium α-Ni(OH)2 lattice mode
combination 1055 medium medium α-Ni(OH)2 lattice mode
combination 1380 medium strong α-Ni(OH)2 O−H bend, lattice
OH
1480 medium strong α-Ni(OH)2 O−H bend, lattice
OH
1600 sh medium strong α-Ni(OH)2 O−H bend, layer
H2O
1630 sh medium medium free H2O O−H bend
2860 sharp very weak surface
hydrocarbon C−H stretch 2930 sharp very weak surface
hydrocarbon C−H stretch 3220 sh broad medium free H2O O−H stretch
3380 broad very
strong free H2O O−H stretch 3500 medium strong free H2O O−H stretch
3570 medium very
strong α-Ni(OH)2 O−H stretch 3640 sh medium strong α-Ni(OH)2 O−H stretch
4260 medium very weak α-Ni(OH)2 O−H stretch +
lattice mode
aPeak maximum is near the instrumental cutoff, so the exact position
may be lower.
Table 10. Infrared Peaks for α-Ni(OH)2Prepared from Ni(NO3)2[α3]
peak frequency
(cm−1) width intensitypeak peak assignment
650a broad very
strong α-Ni(OH)2 lattice mode 720 sh medium very weak NO3− ν4
805 sh medium weak NO3− ν2
835 medium medium α-Ni(OH)2 lattice mode
combination 992 medium medium NO3− ν1
1042 medium medium free NO3− ν1
1280 medium strong NO3− ν3
1310 sh medium strong NO3− ν3
∼1340 medium strong free NO3− ν3
∼1390 medium strong α-Ni(OH)2 O−H bend, lattice
OH
∼1490 medium strong α-Ni(OH)2 O−H bend, lattice
OH
∼1600 medium strong α-Ni(OH)2 O−H bend, layer
H2O
1630 sh medium medium free H2O O−H bend
∼1755 medium weak α-Ni(OH)2+
NO3−
lattice mode + ν3
∼1970 medium weak α-Ni(OH)2+
NO3−
lattice mode + ν3
∼2485 medium very weak NO3− 2ν3
∼2775 medium weak NO3− 2ν3
∼3240 broad medium free H2O O−H stretch
3390 sh broad very
strong free H2O O−H stretch 3515 sh broad strong free H2O O−H stretch
3600−3630 medium very
strong α-Ni(OH)2 O−H stretch 4280 medium weak α-Ni(OH)2 O−H stretch +
lattice mode 7140 medium very weak α-Ni(OH)2 O−H stretch
combination
aPeak maximum is near the instrumental cutoff, so the exact position
whereas such transitions are allowed if the crystal becomes asymmetric, i.e., if crystal disorder increases.62 An additional transition is observed above 33 000 cm−1(below 300 nm)15that,
based on its intensity, is from a charge transfer transition. In the case of α-Ni(OH)2, fluorescence is not observed for sample α3, which signifies that α-Ni(OH)2is not inherently fluorescent and suggests that the fluorescent background in sample α2may arise from disorder or changes in the electronic structure due to foreign Cl− anions. In the case of β-Ni(OH)2, both samples are fluorescent; however, they are also both partly disordered. Therefore, it is unknown whether the material is inherently fluorescent or whether more crystalline samples do not show a fluorescent background signal. 3.10. Disorder.The current body of literature can be simplified by considering two phases, α and β, with varying types and degrees of disorder. Turbostratic, or randomly oriented layer, structures can occur for α-Ni(OH)2samples, where adjacent layers are separated by amorphous H2O. Regarding β-Ni(OH)2, there is one kinetically stable layer orientation that forms by stacking faults during precipitation and during aging of α to β, as observed by XRD. The anions in the NiII salt can incorporate into the α-phase, as observed by XPS, Raman, and IR spectroscopy. Different degrees of hydration can occur, which is observed by large H2O bands in the Raman and IR spectra. Finally, other factors such as crystallite size, point defects, stacking faults, etc. are expected to affect the spectroscopic properties of the materials, such as whether second-order transitions appear in Raman measurements. In the case of stacking fault disorder, only the XRD peaks associated with the c-axis broaden, whereas other types of disorder cause all the diffraction peaks to broaden equally. However, the strong internal O−H stretching modes and the first order lattice transitions provide no evidence of any true additional crystal phases other than α and β.
These results show that changes in activity between samples that had previously been ascribed to the presence of intermediate phases actually arises from various types and degrees of structural disorder. By simultaneously, but separately, monitoring disorder
from the incorporation of foreign ions, hydration and crystal defects such as stacking faults, changes in the performance, and stability of catalysts and electrodes can be linked with their true origin. This will allow for more systematic and more directed development of improved materials for devices.
4. CONCLUSIONS
This work presents a unified and simplified re-examination of previous spectroscopic investigations and demonstrates that one need only consider two phases (α and β) of Ni(OH)2. Highly crystalline samples of α-Ni(OH)2may be impossible to produce because its layered structure minimizes its free energy by adopting some degree of disorder. However, highly crystalline samples of β-Ni(OH)2can be prepared, although the structure can also show disorder. For the first time, all of the Raman and IR-active lattice modes of β-Ni(OH)2have been identified and assigned using factor group analysis.
Samples can range in disorder from (1) incorporation of foreign ions, (2) hydration, and (3) crystal defects including stacking faults. The presence of foreign ions can be measured from characteristic vibrational modes, e.g., nitrate and sulfate anions, and/or by elemental analysis methods, such as XPS, e.g., chloride anions. Vibrational modes provide more detail on subtle changes in chemical environment, e.g., nitrate was shown to occupy two distinct chemical environments in α-Ni(OH)2. Hydration affects the intensity of water bands in Raman and IR spectra. Increased disorder from crystal defects can be observed by the increased intensities of higher order vibrational modes in Raman and IR spectra and from the strong fluorescent backgrounds in the Raman spectra. Mechanical stress within the crystal is measured by observing small shifts in frequency of the internal vibrational modes. For example, at various locations within the sample or between similar samples. Further, stacking faults in β-Ni(OH)2samples can be measured by the presence of additional O−H stretching modes at 3601 cm−1and 3652 cm−1 Table 11. Comparison of Literature Values for the Vibrational Modes in α-Ni(OH)2
mode frequency (cm−1)
our peak assignment this study literature frequency Raman
lattice mode 460 462−464,32451−460,35460,3646139
lattice mode 495 2nd order lattice mode ∼790 2nd order lattice mode ∼1075 O−H bend, lattice OH ∼1400 O−H bend, layer H2O 1590−1620
O−H bend, free H2O 1630
O−H stretch, free H2O ∼3240, ∼3380, 3515
O−H stretch, lattice OH/layer H2O 3590, 3620, 3642−3650 3625,313650−3653,323657,353656,36363739
Infrared
lattice mode 400,2138024
lattice mode 461,1474,4460,21480,2448026
lattice mode ≤650−670 662,1645,4625,21650,24650−65526
combination lattice mode 835
combination lattice mode 1055 10551
O−H bend, lattice OH 1380−1390 14001 O−H bend, lattice OH 1480−1490 15401
O−H bend, layer H2O 1600 1640,11650,141650,211600,241615−162026
O−H bend, free H2O 1630
O−H stretch, free H2O 3220/3240, 3380/3390, 3500/3515 ∼3400,43350,143350,21∼3500,24∼3500,26345042
in the Raman and IR spectra, respectively. This type of disorder broadens only the XRD peaks involving the c-axis, whereas other types of disorder and small crystallite effects broaden all of the diffraction peaks equally. By examining different types of disorder individually, future studies on applications of Ni(OH)2will be able to link desired behavior with its structural origin.
Whereas thin films of α- and β-Ni(OH)2are difficult to detect or differentiate by other techniques, such as XRD and XPS, the two phases are easily distinguished from their strong internal O−H stretching modes at 3581−3640 cm−1
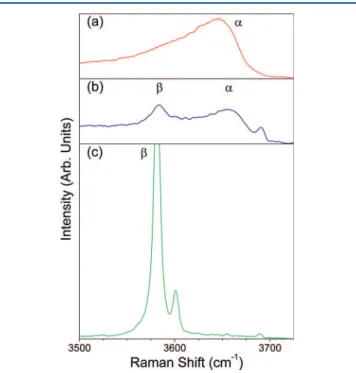
. The value of this is clear: for example, a re-examination of previous work reveals evidence of mixed samples from IR spectroscopy where XRD only detected the β-phase.1Thus, Raman or IR spectroscopy can be used to rapidly identify Ni(OH)2 films by measuring these vibrational modes, which act as a fingerprint for pure and mixed samples (Figure 11).
This study provides the groundwork to determine which Ni(OH)2phase, or in the case of a mixture, the relative amount of each phase, is present at an electrode or catalyst surface and therefore to correlate desired electrochemical or catalytic behavior to a particular phase or degree of disorder. It also establishes a method to monitor change at the surface, i.e., the stability of an electrode or catalyst, during prolonged use or storage.
■
AUTHOR INFORMATIONCorresponding Author
*Tel: 613-991-0914. Fax: 613-993-2384. E-mail: barry. macdougall@nrc-cnrc.gc.ca.
Notes
The authors declare no competing financial interest.
■
ACKNOWLEDGMENTSThis work was supported by National Research Council Canada (NRC) and the Natural Sciences and Engineering Research
Council of Canada (NSERC). Pamela Whifield (NRC-EME) and Bussaraporn Patarachao (NRC-EME) are thanked for assistance collecting and interpreting XRD patterns. David Kingston (NRC-EME) and Gregory Marshall (NRC-EME) are also thanked for their assistance in collecting and interpreting XPS spectra.
■
REFERENCES(1) Aghazadeh, M.; Golikand, A. N.; Ghaemi, M. Int. J. Hydrogen Energy 2011, 36, 8674−8679.
(2) Bode, H.; Dehmelt, K.; Witte, J. Electrochim. Acta 1966, 11, 1079− 1087.
(3) Dhar, S. K.; Ovshínsky, S. R.; Gifford, P. R.; Corrigan, D. A.; Fetcenko, M. A.; Venkatesan, S. J. Power Sources 1997, 65, 1−7.
(4) Gong, L.; Liu, X.; Su, L. J. Inorg. Organomet. Polym. Mater. 2011, 21, 866−870.
(5) Gourrier, L.; Deabate, S.; Michel, T.; Paillet, M.; Hermet, P.; Bantignies, J.-L.; Henn, F. J. Phys. Chem. C 2011, 115, 15067−15074.
(6) Kober, F. P. J. Electrochem. Soc. 1965, 112, 1064−1067. (7) Kober, F. P. J. Electrochem. Soc. 1967, 114, 215−218.
(8) Lee, J. W.; Ahn, T.; Soundararajan, D.; Ko, J. M.; Kim, J.-D. Chem. Commun. 2011, 47, 6305−6307.
(9) Li, B.; Cao, H.; Shao, J.; Zheng, H.; Lu, Y.; Yin, J.; Qu, M. Chem. Commun. 2011, 47, 3159−3161.
(10) McEwen, R. S. J. Phys. Chem. 1971, 75, 1782−1789.
(11) Oliva, P.; Leonarki, J.; Laurent, J. F.; Delmas, C.; Braconnier, J. J.; Figlarz, M.; Fievet, F.; de Guibert, A. J. Power Sources 1982, 8, 229−255.
(12) Palacín, M. R. Chem. Soc. Rev. 2009, 38, 2565−2575.
(13) Burke, L. D.; Whelan, D. P. J. Electroanal. Chem. 1980, 109, 385− 388.
(14) Torresi, R. M.; Vázquez, M. V.; Gorenstein, A.; Córdoba de Torresi, S. I. Thin Solid Films 1993, 229, 180−186.
(15) Yu, J.; Hai, Y.; Cheng, B. J. Phys. Chem. C 2011, 115, 4953−4958. (16) Larramona, G.; Gutiérrez, C. J. Electrochem. Soc. 1990, 137, 428− 435.
(17) MacDougall, B.; Cohen, M. J. Electrochem. Soc. 1974, 121, 1152− 1159.
(18) MacDougall, B.; Graham, M. J. J. Electrochem. Soc. 1981, 128, 2321−2325.
(19) Melendres, C. A.; Pankuch, M. J. Electroanal. Chem. 1992, 333, 103−113.
(20) de Oliveira, E. F.; Hase, Y. Vib. Spectrosc. 2003, 31, 19−24. (21) Faure, C.; Delmas, C.; Fouassier, M. J. Power Sources 1991, 35, 279−290.
(22) Jackovits, J. F. Proceedings of the Symposium on the Nickel Electrode, 1982.
(23) Kamath, P. V.; Therese, G. H. A.; Gopalakrishnan, J. J. Solid State Chem. 1997, 128, 38−41.
(24) Le Bihan, S.; Figlarz, M. J. Cryst. Growth 1972, 13/14, 458−461. (25) Minkova, N.; Krusteva, M.; Nikolov, G. J. Mol. Struct. 1984, 115, 23−26.
(26) Portemer, F.; Delahaye-Vidal, A.; Figlarz, M. J. Electrochem. Soc. 1992, 139, 671−678.
(27) Rajamathi, M.; Kamath, P. V. J. Power Sources 1998, 70, 118−121. (28) Weckler, B.; Lutz, H. D. Spectrochim. Acta, Part A 1996, 52, 1507− 1513.
(29) Audemer, A.; Delahaye, A.; Farhi, R.; Sac-Epée, N.; Tarascon, J.-M. J. Electrochem. Soc. 1997, 144, 2614−2620.
(30) Bernard, M. C.; Cortes, R.; Keddam, M.; Takenouti, H.; Bernard, P.; Senyarich, S. J. Power Sources 1996, 63, 247−254.
(31) Bernard, M. C.; Bernard, P.; Keddam, M.; Senyarich, S.; Takenouti, H. Electrochim. Acta 1996, 41, 91−93.
(32) Cornilsen, B. C.; Karjala, P. J.; Loyselle, P. L. J. Power Sources 1988, 22, 351−357.
(33) Cornilsen, B. C.; Shan, X.; Loyselle, P. L. J. Power Sources 1990, 29, 453−466.
(34) Desilvestro, J.; Corrigan, D. A.; Weaver, M. J. J. Electrochem. Soc. 1988, 135, 885−892.
Figure 11.Raman spectra showing the O−H internal modes of samples (a) α3, (b) α/β, and (c) β3. All spectra are plotted on the same intensity scale.


![Table 10. Infrared Peaks for α-Ni(OH) 2 Prepared from Ni(NO 3 ) 2 [α 3 ]](https://thumb-eu.123doks.com/thumbv2/123doknet/14121648.467750/12.938.489.849.147.685/table-infrared-peaks-α-ni-oh-prepared-ni.webp)