Publisher’s version / Version de l'éditeur: APT Bulletin, 36, 1, pp. 53-59, 2005-05-01
READ THESE TERMS AND CONDITIONS CAREFULLY BEFORE USING THIS WEBSITE. https://nrc-publications.canada.ca/eng/copyright
Vous avez des questions? Nous pouvons vous aider. Pour communiquer directement avec un auteur, consultez la
première page de la revue dans laquelle son article a été publié afin de trouver ses coordonnées. Si vous n’arrivez pas à les repérer, communiquez avec nous à PublicationsArchive-ArchivesPublications@nrc-cnrc.gc.ca.
Questions? Contact the NRC Publications Archive team at
PublicationsArchive-ArchivesPublications@nrc-cnrc.gc.ca. If you wish to email the authors directly, please see the first page of the publication for their contact information.
Archives des publications du CNRC
This publication could be one of several versions: author’s original, accepted manuscript or the publisher’s version. / La version de cette publication peut être l’une des suivantes : la version prépublication de l’auteur, la version acceptée du manuscrit ou la version de l’éditeur.
Access and use of this website and the material on it are subject to the Terms and Conditions set forth at
Monitoring the long-term performance of the Peace Tower in Ottawa
Said, M. N.; Duchesne, D.; Maurenbrecher, A. H. P.; Ibrahim, K.; Lunsdon,
C.; Stephenson, D. G.
https://publications-cnrc.canada.ca/fra/droits
L’accès à ce site Web et l’utilisation de son contenu sont assujettis aux conditions présentées dans le site LISEZ CES CONDITIONS ATTENTIVEMENT AVANT D’UTILISER CE SITE WEB.
NRC Publications Record / Notice d'Archives des publications de CNRC: https://nrc-publications.canada.ca/eng/view/object/?id=c37e62f4-741b-45ee-9cd3-9549d5c2e19a https://publications-cnrc.canada.ca/fra/voir/objet/?id=c37e62f4-741b-45ee-9cd3-9549d5c2e19a
Monitoring the long-term performance of the Peace
Tower in Ottawa
Said, N.A.; Duchesne, D.; Maurenbrecher, A.H.P.;
Ibrahim, K.; Lumsdon, C.; Stephenson, D.
NRCC-47706
A version of this document is published in / Une version de ce document se trouve dans :
APT Bulletin, v. 36, no. 1, 2005, pp. 53-59
M. Nady A. Saïd, Don Duchesne, A.H. Paul Maurenbrecher, Khaled Ibrahim, Carole Lumsdon, Doug Stephenson
Abstract
The Peace Tower, built between 1919-27, is a 92 metre (302 ft) high campanile at the main entrance to the Canadian Houses of Parliament in Ottawa. By 1990, the exterior masonry had deteriorated and cracked. This resulted in a major masonry conservation project, completed in 1996, which included re-pointing, stone repair, grouting and improved water-shedding details.
A comprehensive monitoring program was subsequently commissioned to monitor hygrothermal performance and structural movement. The main objective is to evaluate the long-term performance of the tower and, in particular, the impact of the conservation work on the behaviour of the composite masonry concrete exterior walls under varying environmental conditions.
Data from the monitoring provides a greater understanding of in-service behaviour and provides input for analytical modelling. The program also provides an early warning system to facilitate an effective maintenance program. This paper describes the monitoring program and presents some of the results.
Introduction
Monitoring is a valuable tool to assess the performance of building envelopes before and after major conservation projects1-4. Monitoring also provides a better understanding of how the environment
influences the performance of the building envelope and can provide timely indications of durability issues with the structure or the building envelope and helps diagnose causes of deterioration. When tied into a maintenance program, monitoring contributes to prompt maintenance, which leads to lower costs, and contributes to the maintenance guidelines for similar heritage buildings. Data from the monitoring can also be used to benchmark analytical modelling.
This article describes the monitoring program for the Peace Tower in Ottawa, the capital of Canada. The main objective of the program is to evaluate the short- and long-term performance of the
recent conservation work on the tower. Of particular concern is the effect of the exterior environment on the performance of the composite masonry/concrete exterior walls. Hygrothermal and structural effects are monitored using sensors located at different parts of the tower. The monitoring program also ensures regular visual inspections of the tower.
The Peace Tower
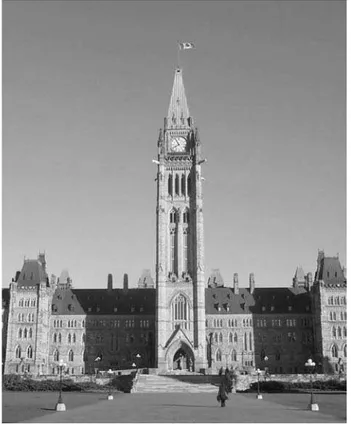
The Peace Tower, a national landmark instantly recognizable to Canadians, is a campanile located at the main entrance to the Centre Block, the Parliamentary building, which accommodates the House of Commons and the Senate. The tower is a designated federal heritage building and a National Historic Site (Fig. 1). It was constructed between 1919 and 1927 as part of a rebuilt Centre Block following destruction of the original Centre Block by fire in 1916.
Fig. 1. View of the south façade of the Peace Tower and the Centre Block. All photographs by Raymond Demers.
The tower was created as a memorial to peace following World War I. The Memorial Chamber in the tower has many symbols and references to this war. For example, the floor of the chamber has
stones taken from the battlefields where Canadians fought, and the stones on the walls and columns are from France and Belgium, two countries where Canadians soldiers were in combat. The memorial chamber houses the Books of Remembrance inscribed with the names of Canadians who have died serving their country.
The Peace Tower is 302 feet (92 meters) tall with exterior base dimensions at the corner buttresses of approximately 43 by 43 feet (13 by 13 meters).The exterior walls are a composite construction of concrete faced with building stone; the stone acted as outer formwork. Three types of sandstone were used in the walls: Nepean sandstone for the body of the wall and Wallace and Ohio sandstone for decorative features. The building stands on bedrock. The walls are 6 feet (1.8 meters) thick at the base and narrow to 2 to 3 feet (0.6 to 0.9 meters) at the observation level just below the clock face. The walls at the clock level are ashlar stone masonry with no concrete backup. The roof structure is 4-inch (100 mm)-thick reinforced concrete with copper roofing over wood battens. Stairs provide access to all levels of the tower, and an elevator provides access to the observation level. A 46-foot (14 meter)-high section of the north wall was removed and rebuilt in 1981 to accommodate an inclined elevator shaft, the world’s first slanted elevator. This provided barrier free access to the observation level without having to relocate the bells in the tower (the bells are one of the earliest and finest carillons in North America). The rebuilt section of the north wall now incorporates a steel frame clad with a 4-inch (100 mm)-thick Nepean sandstone veneer.
After 75 years the exterior masonry had cracked and deteriorated. A major masonry
conservation project was undertaken in the early 1990’s and was completed in 1996. Conservation work included grouting the voids between the stone and concrete, repointing all mortar joints, repairing stones, and improving water-shedding details. The Federal Heritage Building Review Office, an interdepartmental committee responsible for the protection of federally designated heritage buildings, recommended that the performance of the tower be monitored after the work was completed.5
Public Works and Government Services Canada (PWGSC), serving in a stewardship role, used the recommendation to establish a monitoring program and maintenance plan for the tower. The
mandate of the monitoring program addressed basic conservation principles designed to ensure research prior to further intervention. The mandate included the following:
• Evaluate the short-term (2 to 5 years) and the long-term (20 to 30 years) hygrothermal and
structural performance and in particular the impact of the recent conservation work on the exterior walls.
• Provide warning of deterioration in the tower envelope, as well as assistance in determining the causes of deterioration. This information assures timely and minimum interventions and more effective conservation measures.
• Assess the impact of the environment on the durability and performance of the building envelope in order to better understand the dynamics and physics of such composite masonry-concrete walls.
• Provide data for any analytical modelling of the tower.
The Monitoring Program
One objective of the monitoring program was to determine the “normal” behavior of the exterior walls under a variety of environmental loading conditions, including moisture, temperature, wind, and vibration. After the normal behavioral characteristics were determined, changes from the normal could be recognized. If changes occurred, the monitoring system would identify and provide timely warning of potential durability issues with the building envelope. The data from the system can also be used to target areas requiring priority in the tower’s maintenance program.
Following completion of the conservation work, approximately 190 sensors were installed in the tower. Parameters being monitored include the following:
Exterior and interior environments. A weather station was installed at the top of the tower to monitor
the exterior environment (air temperature and relative humidity, rainfall and its pH, wind speed and direction, solar radiation, and barometric pressure). Solar radiation is also monitored on the east and
west facades halfway up the tower. These parameters determine moisture load and the drying ability of the exterior environment.
For the interior environment, the temperature and relative humidity of the air are monitored at various locations over the height of the tower, including the air supply of the HVAC system for the conditioned spaces. The temperature and relative humidity allow the dew-point temperature (a measure of moisture content in the air) to be calculated. Air pressure differences between interior zones and between the exterior and interior are also monitored in order to determine the direction of air (and associated moisture) movements.
Hygrothermal condition of the building envelope. Temperatures of interior and exterior wall surfaces
and temperatures within the walls at various depths are monitored at selected locations in order to obtain an indication of the thermal behavior of the building envelope. Heat-flux sensors were installed at two locations. The number of freeze-thaw cycles that the walls experience is calculated from the temperature data. Surface and air dew-point temperatures are used to assess condensation potential on wall surfaces. Temperature and air-pressure differences across the wall give an indication of potential moisture movement in the wall and its drying potential. The temperature difference and heat flux across the wall determine the wall’s thermal resistance. Changes in thermal resistance could indicate changes in moisture content of the wall.
Moisture is a key factor affecting the durability of walls. Wetness can be the result of
condensation, rain, and snowmelt. A variety of moisture sensors were installed to monitor the time of wetting and drying at various locations on the exterior walls. They indicate the degree and duration of wetting. The pressure difference across the exterior walls was monitored to determine the direction of any potential air leakage through the walls, which in turn could lead to condensation of moisture.
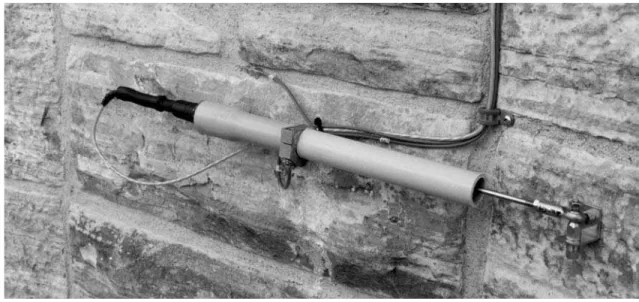
Figure 2. Linear variable differential transformer (LVDT) displacement sensor on the northwest face of the northwest buttress of the Peace Tower. A grey PVC tube covers the stainless steel LVDT to reduce its visibility to the public. A thermocouple temperature sensor glued to a mortar joint right above the LVDT measures surface temperature of the masonry.
Structural movement. The objective of the structural portion of the monitoring program was first to
determine the “normal” behavior of the tower and then to monitor for any changes with time.
Displacement sensors were installed across five repaired cracks to warn if the cracks re-open (Fig. 2). A displacement sensor was also installed to monitor movement at the vertical intersection of the north stone-veneer wall with the adjacent buttress. Tilt sensors were installed at three levels in both the north-south and east-west orientation to give an indication of the overall lateral displacement of the tower. The tower is built on rock so settlement is not occurring and measured movements are therefore very small. Vibration sensors (seismometers) were also installed at four levels to monitor dynamic movement and determine the natural frequency of the tower. Future changes in the natural frequency would indicate a change in the structural properties of the tower.
The sensor locations were based on a review of former damage and deterioration of the tower, as well as on areas where wetting is likely to occur. Locations that could be monitored were restricted by accessibility and the need to limit the visibility of exterior instrumentation and associated wiring.
Easy accessibility was important for sensors needing regular maintenance and re-calibration. The main consideration for the instrumentation system included
• Accuracy and reliability in order to obtain reliable and meaningful data. Sensor drift also had to be small to reduce the need for frequent calibration checks.
• Service life of sensors, dataloggers, and associated wiring. (Exterior wiring and thermocouple wiring have Teflon sheathing; fixings are stainless steel).
• Accessibility for sensors requiring regular calibration and sensors needing replacement during the life of the monitoring period (expected to be 20 to 30 years).
• Sensor duplication in some cases (to safeguard against sensor malfunction).
In order to limit cable runs, dataloggers were located at three levels. A fourth logger was used for the seismometers (it needed a cable run from the top to the bottom of the tower). All dataloggers have battery backup. Data is automatically downloaded by telephone lines.
Data Management
The dataloggers sample sensors once a minute, except for the air-pressure sensors, which are read every second. Data is averaged and saved every 10 minutes for the air pressure sensors, every 15 minutes for the moisture sensors, and every 60 minutes for the remaining sensors (other values saved include minima and maxima over the averaging period). Data from vibration sensors is recorded only when a trigger level is exceeded on one of the sensors (currently set at 0.5%g). When triggered, data 3 seconds before and 40 seconds afterwards is recorded. If the trigger level is still exceeded after 40 seconds, the recording continues.
Standard spreadsheet programs were not suitable for processing the data over the life of the program. Data processing using the raw data files from the dataloggers was error prone and time consuming. In response, PWGSC developed a flexible Web-based relational database system to manage the data. Triggers are incorporated to flag unusual events such as sensor malfunction or exceeded set values. Raw data files retrieved from the loggers are transferred to a server, where the data is
transformed to a database format (Fig. 3). A five-year, moving window of the data is kept on a secure Web server; which corresponds to the cyclical masonry maintenance program. All historical data is kept on CD-ROM media.
Fig. 3. Data management procedure. Drawing by the authors.
The Web site was designed as a working tool for use by the project team. The database can be queried over the Internet to generate plots or to download subsets of the data for offline analysis in a spreadsheet program. The Web site was designed to be intuitive; sensors can be accessed by name or graphically. Users can also specify date range and aggregate functions (minimum, maximum, average values for various periods, month, year, etc.).
Examples from the results of structural movement and hygrothermal performance of the tower are presented for the period 2000-03. The outdoor air temperature during this period ranged from –20°F to +95°F (–29°C to +35°C).
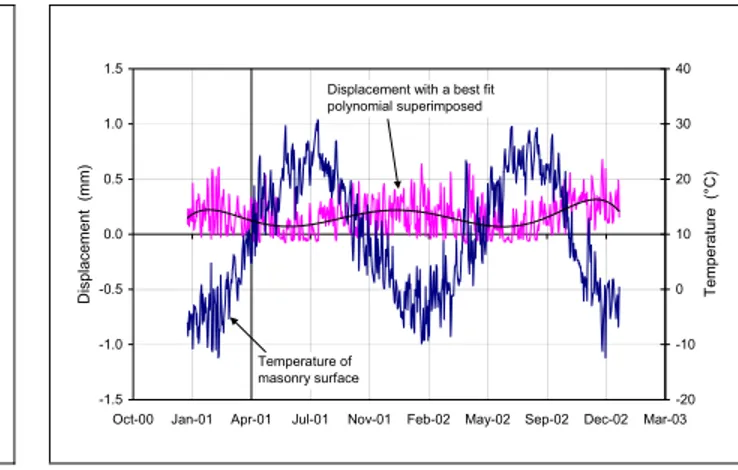
Movement across repaired cracks. Figure 4 shows the typical displacement across one of the repaired
cracks in the north face of the north buttress. The temperature at the masonry surface is also shown. Measured displacement between the attachment points of the displacement transducer follows changes in the masonry temperature. The displacement increases as temperature increases. This indicates that the displacement is due to the thermal movement of the masonry, which expands and contracts as its temperature changes. It also indicates that the crack that was previously located at this location has not reopened. -1.5 -1.0 -0.5 0.0 0.5 1.0 1.5
Oct-00 Jan-01 Apr-01 Jul-01 Nov-01 Feb-02 May-02 Sep-02 Dec-02 Mar-03
D isplacement ( mm) -20 -10 0 10 20 30 40 Temperature (° C ) Temperature of masonry surface
Displacement with a best fit polynomial superimposed -1.5 -1.0 -0.5 0.0 0.5 1.0 1.5
Oct-00 Jan-01 Apr-01 Jul-01 Nov-01 Feb-02 May-02 Sep-02 Dec-02 Mar-03
D isplacement ( mm) -20 -10 0 10 20 30 40 Temperature (° C ) Temperature of masonry surface
Displacement with a best fit polynomial superimposed
Fig. 4. Movement across an earlier crack in the masonry (crack has not reoccurred). All graphs by the authors unless otherwise specified.
Fig. 5. Movement across an earlier crack in a window sill (crack re-occurred).
Figure 5 shows displacement across a repaired crack below a window sill on the south façade. The temperature of the masonry surface is also shown. In contrast to the previous displacement sensor, the distance between the attachment points of the sensor decreases as the masonry temperature
increases, indicating a crack had formed. As the temperature increases, the crack tends to close, thereby shortening the distance between the attachment points. A finite-element analysis of the tower indicated that horizontal tension stresses are induced at this location under pure gravity load. In all likelihood this crack first occurred soon after the tower was constructed. The crack is small and stable, as indicated by the cyclic pattern of the measured displacement.
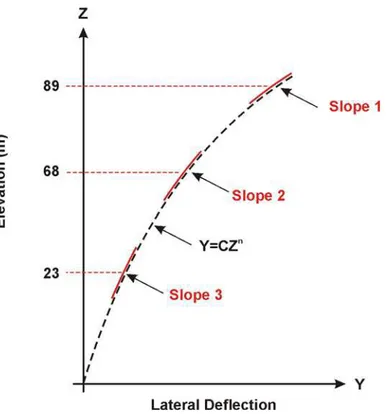
Tower tilt. The tower tilt is monitored at three elevations: 75, 223, and 292 feet (23, 68, and 89
degree). The angle changes are caused by changes in temperature. A rough estimate of the lateral deflection was obtained by assuming a simple deflected shape based on the following equation and shown in Figure 6:
Fig. 6. Assumed shape of tower tilt and tilt-meter locations. Graph by Peter Richards
Lateral deflection y = C Zn
where Z = elevation and C and n = constants
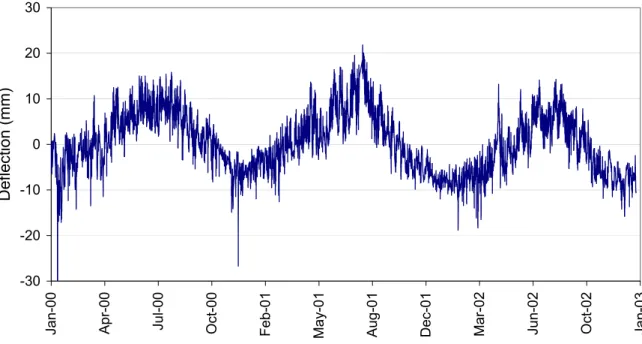
Figure 7 shows that the lateral movement at the top of the tower follows a seasonal pattern with a daily movement superimposed on it. There is a daily cyclical lateral movement of the tower of up to 0.4 in (10 mm) as the sun heats different faces. There is also a seasonal oscillation in the lateral movement of about 1.2 inches (30 mm) due to seasonal effects. Although temperature is supposed to have a negligible effect on the output of the tilt sensors, initial calibration tests show it may be
significant for small changes in angle with the temperature swings experienced by the sensors over the year. This phenomenon will be taken into account when more accurate methods of assessing deflection are developed.
-30 -20 -10 0 10 20 30
Jan-00 Apr-00 Jul-00 Oct-00 Feb-01 May
-01
Aug-01 Dec-01 Mar-02 Jun-02 Oct-02 Jan-03
Deflection (mm)
Fig. 7. Approximate lateral deflection at the top of the tower (east-west direction). Zero line is arbitrary (based on average over the period shown).
Seismic movement. The vibration sensors were triggered between January 2000 and December 2002
by a number of events: high wind, ceremonial cannon shots, and three small naturally occurring earthquakes. The frequency response derived from the acceleration records during the earthquakes showed that the fundamental frequency of the tower is in the range 1.1 to 1.2 Hz.
Hygrothermal performance.
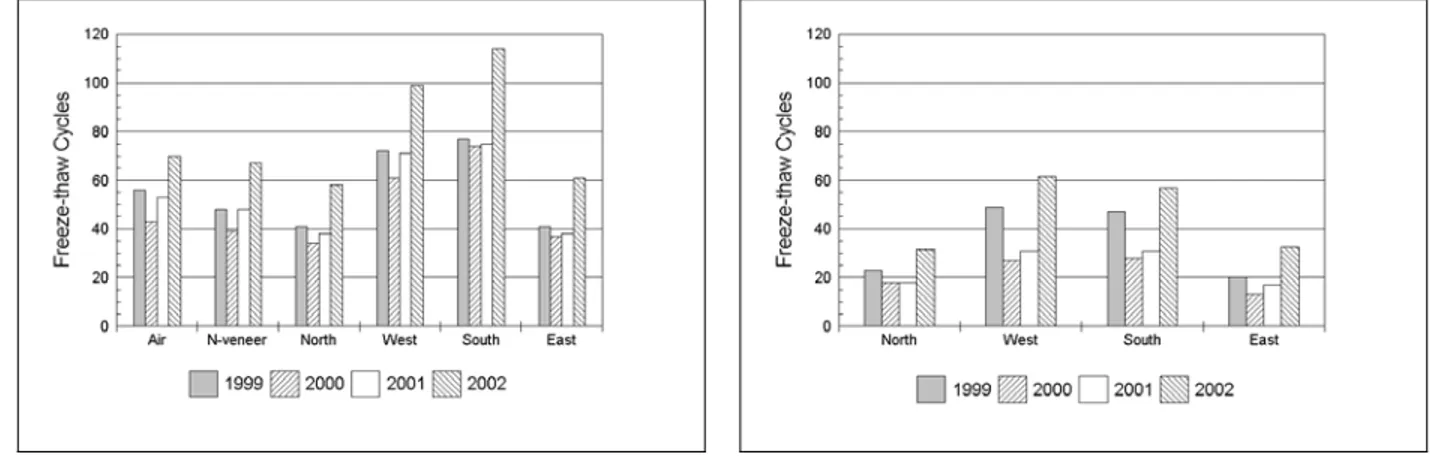
Freeze-thaw cycling combined with high moisture levels greatly increases the risk of frost damage to stone and mortar. The risk also depends on the rate of freezing and on material properties. A freeze-thaw cycle was defined as a temperature drop below 0ºC and a return to above zero. Within the masonry wall freezing may occur at a lower temperature because of dissolved salts (for example de-icing salts used on the ground in the winter are absorbed by the masonry at the base of the tower). Figure 8 shows the number of freeze-thaw cycles experienced by the north, west, south, and east faces of the north-west and south-east buttresses. Also shown is the north veneer wall (a lighter construction) and outdoor air for comparison. As expected, the south and west faces experienced the highest
freeze-thaw cycles because these orientations have more exposure to sun than the north and east faces (in cold weather the sun warms the masonry above freezing point). The data also shows that freeze-thaw cycling can be significantly different from year to year. Figure 9 shows that the freeze-thaw cycles were also experienced at a depth of 8 inches (200 mm) into the wall. The south and west orientations again experienced the largest number of cycles, but the total number was much less than that on the exterior surface.
Fig. 8. Freeze-thaw cycles on the exterior surface of the masonry walls.
Fig. 9. Freeze-thaw cycles experienced within the walls at 8-inch (200 mm) depth.
Freeze-thaw cycles do not cause damage unless the masonry has a high moisture content (>75 percent moisture by pore volume). So far frost damage has only been observed in a very few areas to mortar subject to high moisture levels, such as areas where snow melt drains straight onto the masonry or where a water shedding detail does not extend out far enough from the wall below it (Fig. 10). Analysis of the moisture sensors is underway to correlate wet periods to freeze-thaw cycles.
Moisture sensors give an indication of wetting time and changes in moisture level but not of the actual moisture content. The exterior face of the walls experienced normal wetting and drying patterns. Sensors installed at a depth of 2 inches (50 mm) in the wall showed that the exterior wetting
occasionally penetrated to this depth. Moisture sensors inserted in two weep holes in the north stone-veneer wall indicated occasional moisture penetration by wind-driven rain.
Fig. 10. Snow-melt dripping onto the masonry from an inadequate water-shedding detail at the south entrance of the tower.
Five moisture sensors were also installed at a depth of 8 inches (200 mm) into the corner buttresses about 75 feet (23 m) above ground level with north, south, east, and west orientations. The 8- inch depth approximately corresponds to the masonry-concrete interface. The west and south sensors have shown significant moisture from the start of the monitoring. This moisture does not seem to be directly influenced by exterior wetting. The moisture may have remained there from the completion of the renovations in 1996, when sections of the wall were grouted. The level of moisture appears to vary over the year, tending to be higher during warmer periods (Fig. 11). The variation in level caused by the effect of temperature on the moisture sensor has been partly taken into account, but more work is needed to define better the temperature correction and determination of moisture content. Moisture variation may also be partly caused by temperature and vapor pressure gradients, which can drive moisture into the wall up to the masonry-concrete interface, where the concrete may be holding back
moisture. Computer modelling of the hygrothermal performance of the wall would provide more insight into the reasons for the damp condition. As noted earlier, the west and south walls are experiencing the highest number of freeze-thaw cycles. Thus, these walls are at a higher risk of frost damage, should the moisture level begin to exceed 75 percent of the pore volume. Methods for determining the actual moisture content at these locations are under investigation.
0 10 20 30 40 50 60 Jan-01 Ma r-0 1 May-01 Jul-01 Sep-01 Nov-01 Jan-02 Ma r-0 2 May-02 Jul-02 Sep-02 Nov-02 Jan-03 Moisture (800/kohms)
Fig. 11. Results of the moisture sensor installed 8 inches (200 mm) into the west face of the northwest buttress. The vertical scale is an arbitrary wetness scale. It is determined by the formula, 800/R, where R (in k-ohm) is the measured resistance of the moisture sensor corrected for temperature: R corrected = exp(ln(R) + 0.02*(T – 20)). Based on an equation and data from K. Altmann, “Measurement of Moisture in Concrete, in Particular in Construction Components Made of EPS-Concrete,” Second International CIB/RILEM Symposium on Moisture Problems in Buildings, Rotterdam, Netherlands, 1974, Paper No. 5-1.1.
In an air space between the decorative interior stone cladding and the northwest corner of the exterior masonry at the observation level, one surface moisture sensor located 5 inches (125 mm) above floor level, occasionally showed low levels of surface wetness due to condensation from May to
November 2001 and from April to October 2002. This location is susceptible to surface condensation because of its northern exposure, thermal bridging by the concrete floor, and temperature stratification (cool air is usually at the bottom, and warmer air at the top of the space). The periods of wetness,
however, are of short duration. A moisture sensor at the same location but in the southeast corner did not detect any wetness.
Conclusion
The monitoring program is a useful tool in assessing the performance of the Peace Tower since the 1996 conservation work. The program also ensures that visual inspections will be made regularly, because these inspections are necessary to the analysis of the data. Should any deterioration occur, it will be detected early, and its cause more easily determined, leading to timely and effective
maintenance planning in the ongoing conservation work on the buildings at Parliament Hill (for more information see http://parliamenthill.gc.ca). Monitoring also gives a better understanding of the environmental loads on the buildings, which will, in turn, improve conservation and monitoring strategies for other buildings.
The monitoring data and associated visual observations indicate that the masonry at the Peace Tower has performed well to date with very minor deterioration. Local frost damage has occurred to mortar in a few isolated areas where snowmelt water led to high moisture levels. Some repaired cracks have opened again, but so far they are hairline and seem to be stable. A fairly constant level of moisture at the interface between the masonry and the concrete backup wall has also been recorded at two locations. The reason for this condition is still to be determined. Close-up visual surveys are planned in five-year cycles because the instrumentation monitors only selected areas.
From a structural point of view, the tower shows small lateral movements due to daily and annual temperature changes. Heating from the sun is the main cause of the daily lateral deflection. The tower experienced three small earthquakes; data from the vibration sensors was used to determine dynamic properties of the tower.
A basic conservation principle is that there be adequate research, recording and investigation prior to intervention to ensure effective conservation measures. Monitoring should therefore be considered as one of the tools in the conservation plans of historic buildings prior to and after any interventions. Monitoring equipment is becoming more reliable, easier to use, and more economical.
Documenting performance enables us to learn from projects and improve our understanding of material and structural behaviour in service.
M. NADY A. SAÏD is a senior research officer at the Institute for Research in Construction, National Research Council Canada. His work concentrates on field monitoring the performance of building envelopes and developing building envelopes for the northern Canadian climate. He is a registered professional engineer.
DON DUCHESNE joined the Heritage Conservation Directorate in 2001 from the private sector. He has worked in the fields of steel, concrete, masonry, and wood and is a specialist in finite element analysis of building structures. He is a registered professional engineer and a member of APT and the Canadian Society for Civil Engineers.
A. H. P. MAURENBRECHER is a senior research officer at the Institute for Research in Construction. His work concentrates on the performance of masonry in buildings. He is a member of several
Canadian standards committees on masonry.
KHALED IBRAHIM is the President of KIB Consultants Inc., Ottawa. His broad experience in structural engineering, building science, and conservation engineering extends over 20 years and includes a wide variety of consulting work for public and private clients.
CAROLE LUMSDON is a program manager with the Heritage Conservation Directorate, Public Works and Government Services Canada. She holds a Bachelor of Architecture from the University of
Waterloo, Ontario, and joined HCD in 1992. Her experience includes coordination of multi-disciplinary project teams for the delivery of complex heritage projects and building condition assessments. DOUG STEPHENSON has a Bachelor’s and Master’s degrees in Civil Engineering from Carleton University. He joined HCD/PWGSC in 2001 after many years of private-sector consulting work on a wide range of building problems. He has been a member of Professional Engineers Ontario since 1984 and is a member of APT.
Acknowledgements
The authors would like to acknowledge the many individuals who supported and contributed to the Peace Tower monitoring program: Don Nixon, Rosanne Howes, and Jean-Guy Leduc of the
Parliamentary Precinct Directorate, PWGSC; Raymond Demers, Rock Glazer, Lloyd McSheffrey, Cliff Shirtliffe, and Gerry Pernica of the National Research Council Canada; Rob Melanson and Jocelyn Paquette of the Heritage Conservation Directorate, PWGSC; and Clive Pickles and Mike Block of the Internet Applications Development Group, PWGSC.
Notes
1. J. F. A. Moore, ed., Monitoring Building Structures (New York and Glasgow: Blackie and Van Nostrand Reinhold, 1992), 155P;
2. R. M. Moss and S. L. Matthews, “In-service Structural Monitoring, A State-of-the-Art Review,”
Structural Engineer 73:2 (Jan. 1995): 23-31;
3. S. L. Matthews, “Deployment of Instrumentation for In-service Monitoring,” Structural Engineer 78:13 (July 2000), pp. 28-32;
4. A. H. P. Maurenbrecher, M. N. A. Saïd, and L. Fontaine, “Monitoring Non-structural Performance of Exterior Masonry Walls,” Proceedings of the International RILEM Workshop, Mantova, Italy,
November 13-14, 2001, PRO 26: On-site Control and Evaluation of Masonry Structures, L. Binda
and R. C. de Vekey, eds. (Bagneux, France: RILEM Publications, 2003): 119-128.
5. J. P. Landry and L. A. M. Fortin, eds., Federal Heritage Buildings Review Office (FHBRO) Code of