Architectural Framework to Support Integrated
Concurrent Engineering in an Academic Institution
By
Bruce J. Farnworth B.E. Mechanical Engineering The City College of New York, 1998
SUBMITTED TO THE DEPARTMENT OF AERONAUTICS AND ASTRONAUTICS IN PARTIAL FULFILLMENT OF THE REQUIREMENTS FOR THE DEGREE OF
MASTER OF ENGINEERING IN AERONAUTICS AND ASTRONAUTICS
AT THE
MASSACHUSETTS INSTITUTE OF TECHNOLOGY
June 2000
@ 2000, Bruce J. Farnworth, All rights reserved
The author hereby grants to MIT permission to reproduce and to distribute publicly paper and electronic copies of this thesis document in whole or in part.
Signature of Author:
Bruce J. Farnworth Department of_.eronautics and Astronautics May 18, 2000 Certified by:
i bCharles W. Boppe
Senior Lecturer, Department of Aeronautics and Astronautics Thesis Supervisor
Certified by: ,Cory
R.A. Hallam Lead Project Engineer, Department of Aeronautics and Astronautics
Thesis Supervisor
Accepted by:
Nesbitt W. Hagood Associate Professor of Aeronautics and Astronautics Chairman, Committee of Graduate Studies
Architectural Framework to Support Integrated
Concurrent Engineering in an Academic Institution
By
Bruce J. Farnworth
Submitted to the Department of Aeronautics and Astronautics on May 19, 2000 in Partial Fulfillment of the Requirements for the Degree of Master of Engineering in Aeronautics and Astronautics
Abstract
This thesis focuses on developing a recommended architecture for the next generation of design centers for integrated concurrent engineering in an academic environment and identifying and implementing an enabling sub-system for the architecture. During the development of this architecture a systems engineering process was used to structure the efforts of the team and maintain traceability to the customer needs throughout the design. Site visits were undertaken to benchmark existing design centers. Customer needs were compiled and analyzed to develop the system requirements that were input into a product matrix. This enabled the team to generate a wide array of implementations to synthesize multiple architectures. The recommended architecture should help to promote active learning in a distributed design team environment. Further, a concept for an On-Line Teaching Assistant (OLTA) was developed designed to help designers throughout the process of developing complex systems. The OLTA may be considered an "expert system" that will retain and filter an accumulating knowledge database of student work entities. A proof-of-concept prototype was developed to demonstrate this concept.
Results of the architecture show a significant relative improvement over the currently proposed architecture and preliminary responses for the OLTA are very positive with one advisor stating "OLTA could revolutionize engineering education as we know it." Two faculty members agreed to utilize a prototype in their upcoming classes and the Aeronautics and Astronautics Department is very interested in implementing the system in its capstone design classes.
Thesis Supervisor: Charles W. Boppe
Title: Senior Lecturer, Department of Aeronautics and Astronautics
Thesis Supervisor: Cory R.A. Hallam
Table of Contents:
1. Abstract 2
2. Introduction 7
3. Background: The New Paradigm of Design Centers 9
4. Methodology 12
5. DE-ICE Mission Statement 17
6. Needs, Expectations and Requirements 19
7. Architectural Synthesis 38
7.1 Concept Development 45
7.2 Concept Evaluation 52
7.3 Baseline System Architecture 55
7.4 Baseline Product Development Process 58
8. Prototype Development and Demonstration 59
9. Assessment and Recommendations for Future Work 86
10. Conclusions 90
11. Acronyms 92
12. References 94
List of Figures:
Figure 6-1 Hierarchy of User Need 20
Figure 6.1-3 Distribution of the Modeling Resources 27
Figure 6.1-4 Components of the DOME System Architecture 28
Figure 6.1-5 A Collaborative Framework 29
Figure 6.1-6 Conceptual Diagram of VSLCDE 30
Figure 6.2-1 DE-ICE QFD Requirements Matrix 32
Figure 6.3-1 System Use Case Diagram 36
Figure 6.3-2 Design Use Case Diagram 37
Figure 7-1 DE-ICE QFD Product Matrix Page 1 39
Figure 7-2 DE-ICE QFD Product Matrix Page 2 40
Figure 7-3 DE-ICE QFD Product Matrix Page 3 41
Figure 7-4 DE-ICE QFD Product Matrix Page 4 42
Figure 7-5 DE-ICE QFD Product Matrix Page 5 43
Figure 7-6 DE-ICE QFD Product Matrix Page 6 44
Figure 7. 1-1 Software and IT Architectural View for the Author's Architecture "A" 46 Figure 7.1-2 Equipment Architecture View for the Author's Architecture "A" 49 Figure 7.1-3 Physical Architectural View for the Author's Architecture "A" 51
Figure 7.3-1 Final DE-ICE SW/IT Architecture View 56
Figure 7.3-2 Final DE-ICE Equipment Architecture View 57
Figure 8-1 OLTA Vision 60
Figure 8-2 OLTA Use Case Diagram 65
Figure 8-3 OLTA Interface Relationship Diagram 66
Figure 8-4 Top-Level OLTA FFD 69
Figure 8-5 FFD for Blocks 3 71
Figure 8-6 FFD for Block 4 72
Figure 8-7 FFD for Blocks 9 73
Figure 8-8 FFD for Block I1 74
Figure 8-9 OLTA Preliminary Faculty User Interface 75
Figure 8-10 Preliminary Student Interface 76
Figure 8-11 OLTA Prototype Development Use Case 80
Figure 8-12 OLTA User Interface 82
Figure 8-13 Prototype Physical Implementation 83
Figure 8-13 OLTA Development Process 84
List of Tables
Table 2-1 Priority of Classes for DE-ICE Development 8
Table 5-1 DE-ICE Mission Statement 17
Table 7-1 Product Matrix Architectural Evaluation 38
Table 7.2-1 Pugh Matrix 53
Table 8-1 Prototype Evaluation Matrix 61
Table 8-1 Prototype Work Package Descriptions and Break Down 68
Table 8-2 Content Type and Attributes 77
Table 8-3 Content Providers 78
Table 8-4 Content Consumers 79
Dedication:
This thesis is dedicated to my wife for her unending support, understanding and love. Acknowledgements:
The author would like to thank the following people for their help and support on this project: Mr. Cory Hallam, Mr. Charles Boppe, Dr. Dava Newman, Dr. Billy Fredriksson, Mr. Gunnar Holmberg, Mr. Fred Donavan, Mr. David Mitchell, Dr. Robert Shishko, and Dr. Joel Sercel. Additionally I would like to thank my teammates Mr. Alex Manka and Mr. Simon Nolet for their support in pursuing this project and their professionalism during the execution of this project.
2. Introduction
The Massachusetts Institute of Technology's Department of Aeronautics and Astronautics has recognized a need for a revolutionary change in the way students are taught [15]. Traditionally, instructors have taught with a discipline-specific methodology which allow students few opportunities to understand the interactions of each discipline in design, manufacturing, and systems integration processes. In addition, industry has indicated the desired attributes of graduating engineers to include [20]:
i) A good base of engineering fundamentals
ii) Understanding of the design and manufacturing process iii) Multi-disciplinary "systems perspective"
iv) Good communication skills
v) The ability to think critically and creatively vi) Flexibility to adapt to rapid and major change vii) Understanding of the importance of team work
Today MIT is embracing the Conceive-Design-Implement-Operate (CDIO) theme as the context by which an engineering education is to produce graduates that address these issues by designing and manufacturing a product in a team environment.
Examples of the changing pedagogy in the Aeronautics and Astronautics Department are the implementation of the CDIO philosophy and the use of active learning methods in design classes [15]. Development of the Design Environment for Integrated Concurrent Engineering (DE-ICE) is part of the process to create active learning in a design environment. This initiative seeks to "create a more stimulating hands-on environment for students (thus improving student motivation, understanding and retention) [15]."
The Aeronautics and Astronautics Department is creating a "cultural shift" in education, whereby students and faculty consider learning to be integrally linked with active engagement and interaction instead of relying on passive learning through lectures [2].
This pedagogical shift aims to produce engineers that understand the complex and iterative nature of holistic product design and also gain a deeper understanding of the engineering fundamentals they have learned by using them.
To address this change the Aeronautics and Astronautics Dept. has planned to develop a world-class Design Center (DC) enabling students to perform integrated concurrent engineering. This center will be used by undergraduate (UG) and graduate (G) students for lectures/presentations, large systems design, research design support, collaborative design with external teams, design-based distance learning and teaching, and interactive electronic classes.
Priority Short Term Long Term
1 16.82 Flight Vehicle UG 16.684 Experimental Capstone
16.83 Space Systems Engineering UG Subject UG
2 16.89 Space Systems Engineering G 16.870 Master of Engineering 16.90 Aircraft Systems Engineering G Project G
3 16.00 Introduction to Aerospace and Design UG
Table 2-1 Priority of Classes for DE-ICE Development
Table 2-1 shows the immediate priority of the classes targeted for the DC. The project time frame is defined as short term (one week to one semester) or long term (1 to four semesters). Please see Appendix H for active learning course descriptions.
3. Background: The New Paradigm of Design Centers
As aerospace systems become more complex with the constant need to produce quality products faster and at lower life cycle cost, more and more industry organizations are turning toward integrated concurrent engineering with the assistance of information technologies. NASA, Saab AB, Boeing, and The Aerospace Corporation have developed DC's and distributed integrated tools to support integrated concurrent engineering. At these organizations a holistic design process stressing the complete process over time is beginning to replace the traditional product development processes (i.e. the over the wall process). This is accomplished through use of the appropriate tools key to their success such as development methods, integrated modeling, and engineering management [16].
Generating designs for a complex system involves decomposing the design problem into sub-problems that can be analyzed by a small team of engineers. This allows engineers who possess the needed core competencies to solve specific areas of each sub-problem
[9]. However, generating a holistic design that addresses the trade-offs of cost, performance, etc. and different goals of each sub-problem can be very time consuming, and often involves multiple iterations of the design. Inferior decisions can also be made if the sub-problem interactions are not fully understood. Additionally, experience has proven that 70-80% of a system's cost is committed during the initial conceptual development phase of the design, thus the conceptual development phase offers the greatest opportunity to influence the life cycle cost of the system [17]. The current trend towards integrated concurrent engineering is to enable aggregation of the sub-problem analyses into a whole "system" for analysis and trade studies early in the design process. This aggregated system model would consider the lifetime of the "system."
NASA has set out to meet these goals by initiating development of an Intelligent
Synthesis Environment (ISE) that integrates advanced computing with human interaction (in the computer environment) to create a seamless environment enabling new levels of productivity among distributed collaborative teams [1]. NASA's first step towards the
ISE vision is the Product Development Center (PDC). In developing the PDC, Integrated
Product Development (IPD) teams have been able to complete proposals and mission analyses with "savings of up to ten times the previous cost" in dedicated week-long
sessions instead of during the span of several months [18].
Saab AB's goals sought to reduce life cycle cost, time and the number of defects by 50,
50 and 20 % respectively for the development of the two-seat version of the Gripen and
the Saab 2000 [17]. Aspects of the development process used at Saab are [4]:
e Easy access to information and knowledge
e Extensive use of modeling and simulation to provide knowledge
e Support engineers in preliminary development stages to allow for mature
decisions as early as possible
e Support and simplify communications
e Provide a channel for engineers and experts to utilize their expertise in an
efficient manner
Saab AB has implemented a company-wide distributed database with integrated engineering processes to allow collaborative and concurrent work. Design centers were created which allow IPD teams to meet and actively work together to reach design decisions. Designs can be accessed and viewed in their context by the team along with additional information such as simulation and analysis results, scheduling information, and Bill of Materials (BOM). An application (DIP) was created to record meeting minutes and to provide for "screen grabbing" opportunities of any information or drawings. It allows engineers to add annotations into the system in real-time, enables team leaders to assign responsibilities, and to retain and enhance knowledge of the decision making process while fostering communication. During the introduction of Saab's change in engineering process, there was some hesitation from the engineers but now the general consensus is that it is working "very well" was relayed during personal interviews at the site visit in February 2000, and have met or exceeded their goals stated above[17].
However, DE-ICE is driven by different goals and constraints than industry. With the shift towards an active learning paradigm and the CDIO philosophy students will be encountering real world design problems involving cross discipline knowledge. One goal is to enhance core fundamental knowledge while introducing students to the iterative nature of developing products that span a very wide range of complexity. A second goal of DE-ICE is to promote active learning in a design environment by enabling students and faculty to work in distributed design teams concurrently, along with external design groups to develop and design complex products.
The primary distinction between industry and academia is that students cannot become dedicated IPD group members spending all of their time on a single project due to the requirements of other classes and the scheduling conflicts that this would impose. Additionally, most junior students using the system may not have the expertise of working engineers and may find it difficult to perform well in an unguided IPD environment. To overcome this problem the DE-ICE architecture must provide a robust communication and collaboration infrastructure that allows students to work along with the demands of their varying class schedules, and act as a resource to help students accomplish their tasks.
4. Methodology
During the course of the team's research and design period, a process was used to structure the effort and to provide a logical framework. The formal methodology used during the DE-ICE architectural concept development is described in the following sections. During the course of the project, communication was integral as a means to perform work and test technologies and ideas of the team which enhanced overall interaction and spirit. MS NetMeeting, group emails, Virtual Network Computing (VNC), and Distributed Object Modeling Environment (DOME) were tested and
provided insight into some of the limitations of these applications and techniques (please see Manka [30] for information on the testing of these tools).
Define Project Scope:
The first task undertaken was to define the scope of the project. This project was considered to be very complex, as pointed out by Mr. Gunnar Holmberg, manager of the advanced technologies department. The team realized that boundaries must be set at the beginning of the project to help guide and focus the design team. A mission statement was developed that defined the project and set achievable goals for the team to work towards [8]. The users of the system were defined, along with possible constraints and stakeholders on the project.
Literature/Technology Search:
Literature and technology searches helped the team to develop a better understanding of the problem undertaken. Searching existing literature and technology ensured that the system architecture developed would build on, but not repeat the efforts conducted by other researchers and organizations. This project utilized patent searches, Internet searches, library and journal publications, and organizational best practices (i.e. site visits to observe how others are meeting similar goals) to uncover and understand the state-of-the-art in integrated concurrent engineering. Data collected in this effort was also important during the benchmarking phase of requirements definition. This process also
helped identify potential sub-system components that may be utilized in the system architecture.
Survey Potential Users:
For this project the customers of the DE-ICE system were defined as the end users. This would include internal and external students, faculty, guest lecturers, teaching assistants, and the AA staff. Two surveys were used to gather the varied needs of the end users. Students, staff and faculty were surveyed with issues such as system usability, ease of accessing data, and team communication. In addition, faculty were surveyed on how they plan to use the system to enhance their delivery of course material to help students gain a better understanding of the course goals, and for the design team to understand the
teaching processes that may be used with the system.
The student and staff survey was more general so that the results would mark the preference of the end users. Personal interviews were conducted for the faculty survey while the general survey was Internet-based. At the recommendation of Professors Newman and Boppe the survey format was selected, due to i) possible low return rate from the faculty, ii) the importance of getting feedback from the faculty. Copies of the surveys may be seen in appendix C.
Needs and Requirements Analysis:
Key to the success of this project was the proper identification of the customer needs and focusing on the ones most important. Correctly translating the customer needs allowed for the generation of the systems technical requirements, a process matrix, and ultimately the system architecture. To correctly capture the voice of the customer, Quality Function Deployment (QFD) was used to help eliminate any personal biases that may be introduced by the team members [26]. QFD helped the team to identify the highest technical requirements of the system while minimizing personal biases of the design team. Requirement conflicts were also identified and monitored.
Benchmarking Existing Systems:
Site visits provided information on state-of-the-art integrated concurrent engineering design environments. System architectures and top-level design processes of the existing facilities were gathered and analyzed for use in competitive benchmarking. Collected data was used in the QFD matrix to allow the team to set goals to match or exceed the systems benchmarked.
Use Cases:
Object-oriented methods such as Use Case Diagrams helped the team to understand the context in which the system would be used and to identify possible operational interactions that the team may have inadvertently neglected. Use cases identify the actors using the system, the use instances and how functionality is extended. The Use Case Diagram also showed the relationships between the actors and the use cases or functionality of the system along with any interfaces [19].
Product Matrix:
The product matrix acted as a map of the highest technical requirements from the QFD into implementations that can satisfy the requirement of the system. Use of a product matrix allowed the team to characterize multiple implementations for each technical requirement. It can also allow for requirements traceability for future design enhancements to the DE-ICE system.
Architectural Synthesis:
Architectural variants were generated from the product matrix by selecting subsets of the implementations generated in the product matrix. Multiple "views" (i.e. physical, software/IT, schematic Block diagrams) of the architectural concepts were used along with the product matrix for a convergent/divergent total design concept [5] that will meet the user needs.
With the variants and baseline architecture identified, a Pugh matrix was used to identify the concept, which as a whole met the selected decision criteria. Ranking was achieved through engineering judgments of the increased, decreased or similar performance that a particular architectural criterion would yield relative to the baseline. A Pugh type
analysis was used because it could yield good results during the conceptual design phase when detailed analysis of cost and functionality may not yet be adequately analyzed. Baseline for the Pugh matrix was the existing and planned design center in the Aeronautics and Astronautics Department. A Pugh matrix also allowed the design team to identify aspects of each architectural variant that would show significant improvement over the baseline.
Results from the Pugh matrix were used to synthesize additional design concepts that capitalized on the increased performance aspects of each concept from the previous step. The goal was to identify an architecture that would show increased performance when judged against all of the decision criteria.
Prototyping:
Throughout the process of synthesizing the architectures the team maintained focus on creating or combining elements that would prove to be critical and novel prototype options. Prototype concepts were evaluated against the driving technical requirement to provide a well-founded justification for the selected concept.
Due to the team's size and constraints of the term boundary, prototyping demonstrated a sub-set of the enabling functionality. Therefore, the prototype acted as a proof-of-concept demonstration with follow-on work to be performed after the project.
Project Planning:
Initially, the team planned two days per week to meet and discuss individual work accomplished during independent work time. Major tasks for the project were defined, and the team tried to evenly distribute the workload. Using MS Project 98 helped to
facilitate project planning (see appendix G for the detailed project schedule). Three design reviews acted as choke points to keep the team focused. Industry representatives were invited to attend and give feedback on the work completed and the direction of the project.
5. DE-ICE Mission Statement
To launch the DE-ICE project a mission statement was drafted to identify the system context along with a basic description and goals of the project. The mission statement shown in Table 5-1 helped the team identify three of the six attributes of the DE-ICE system [23], namely: why the system is being built, what the system should do, and who will be doing it.
Description "To develop an operational framework for a design center to enhance learning in an academic environment."
Context DE-ICE will be used in an academic environment to enhance the learning of the
process of conception, design, implementation, and operation of complex aerospace systems.
Goals To develop recommendations for To discover a key enabler of the system and
the architecture of the design prototype a component.
environment.
Users Internal: Possible external users:
MIT Students Guest lecturers
Teaching Assistants Industry representatives
Faculty External students
Staff
Assumptions The system should utilize mature The system will use existing computer
technologies. hardware.
Stakeholders End Users (MIT students) MIT A/A Department Microsoft Corporation *
Industry
Table 5-1 DE-ICE Mission Statement
The asterisk next to the Microsoft Corporation indicates that they were initially considered a primary stakeholder, considering the substantial funds they provided to the department for research. Microsoft showed interest in the project during the prototype phase and was very helpful.
Using the mission statement helped the team remain focused and not get overwhelmed by the scope of the task. Initial documentation of the design team goals clearly defined project deliverables. Additionally, when presenting at the Architectural Design Review (ADR) the team was able to show that it had successfully completed its first goal and had identified a component of the system to prototype.
6. Needs, Expectations and Requirements
One of the most difficult processes undertaken during the project was discovering customer needs. The customers for the system are defined as faculty, staff, and students of the Aeronautics and Astronautics Department who will be the majority of the end users. Difficulty in defining the needs was due to the fact that the ultimate uses of the system were somewhat uncertain, teaching processes that would be used were undefined, and there was a limited base of experienced end users.
During the initial stages of this project the highest level needs defined by the Aeronautics and Astronautics department were:
1) The system should be scaleable for varying levels of user experience and training
2) Enable a distributed design team to concurrently design aerospace systems
3) Add value to the engineering project and enhance previously learned knowledge
Upon review and suggestions from the group advisors, the team tried to reassess the system needs. Further consideration, refinement and iteration led the group to create a hierarchy of system needs. A description of the system needs and weighting factors may be found in Appendix A. The customer needs are as follows:
Pedagogical Needs
* Capability to support MIT operational modes (system constraint)
e Active learning in a design environment
" Holistic view of design
* Improved knowledge of and experience with the design process
e Support of life cycle analysis
Operational Needs
e Increases productivity for a given amount of time
* Highly useable system * Support for team enablers * Flexible system (Sustainability)
The high-level needs are categorized as Pedagogical and Operational under which are reflected the primary system needs. A graphical hierarchy of needs was created to
indicate needs prioritization, and is shown in Figure 6-1.
DE-ICE Needs
Hierarchy
Capability to support MIT operational modes Holistic view of design Increase productivity for a given amountof time
Support of life cycle analysis
Highly useable system
Support for team enablers
improve the quality of student design
work
Sustainable system
Figure 6-1 Hierarchy of User Need
Active learning in a design environment
improve knowledge of and experience with the.
6.1 Survey of Existing Systems
Integrated concurrent engineering design environments evaluated for this study can be classified into two groups, those used for:
i) Conceptual design,
ii) Product engineering/manufacturing
The following is a brief description of the systems surveyed. Additionally the team has reviewed several core technologies that may be mature enough for system utilization.
Concept Design Centers (CDC) are mainly focused on developing conceptual designs and proposals for complex space systems. Goals of the CDC's are to reduce the time and cost needed to develop a design or proposal. To date, they have shown great success in meeting their goals as will be explained in the following sections [18].
NASA JPL PDC:
NASA's Product Design Center (PDC) is used for generating and analyzing conceptual designs for space missions. NASA has reduced the design cycle time to one-tenth the traditional engineering process while reducing cost from 250K to 50K [18]. A dedicated team of functional engineering leads for each sub-system is used during design sessions. Preliminary work is undertaken off-line by each sub-system lead so they are fully prepared when the design session begins. Design sessions are led by an overall team leader and are highly scripted and timed. Sub-system models are integrated into one Excel spreadsheet for global cost/performance optimization and decision-making. System architecture for the PDC and top-level process can be seen in appendix D. For more information on the PDC please see [30,31].
TRW/Aerospace Corp.:
TRW and the Aerospace Corp. concept design centers are very similar in usage and functionality to the NASA PDC and are in fact outgrowths of the PDC. These newest design centers use linked MS Access databases to increase flexibility. For a more
in-depth analysis of these facilities see Appendix D. For more information on the these DC's please see [30,3 1].
California Institute of Technology:
Dr. Joel Sercel, who was one of the driving forces in the development of the NASA PDC, is using the concept of integrated concurrent engineering to teach Space Systems Design at CalTech. The students are supplied with all the equations needed to design and
analyze a space system. Students use UML to develop the system's top-level
requirements.
ICEMaker is used to identify subsystem interfaces early in the design process so that students only create the models they need for their analysis [27]. ICEMaker is a LAN distributed Excel spreadsheet and database. Subsystem groups log into ICEMaker and build their models on a local sheet. When a model is complete the resulting outputs are published to the "System Sheet" which integrates the multiple distributed sheets (or models) [27]. ICEMaker incorporates a Product Attribute Database (PAD) that is used to integrate the subsystem models. It supports external interfaces with Excel, Matlab, DrawCraft, and CAD STEP files.
The students spend twelve weeks building the system models and three weeks performing design trade studies.
Saab AB:
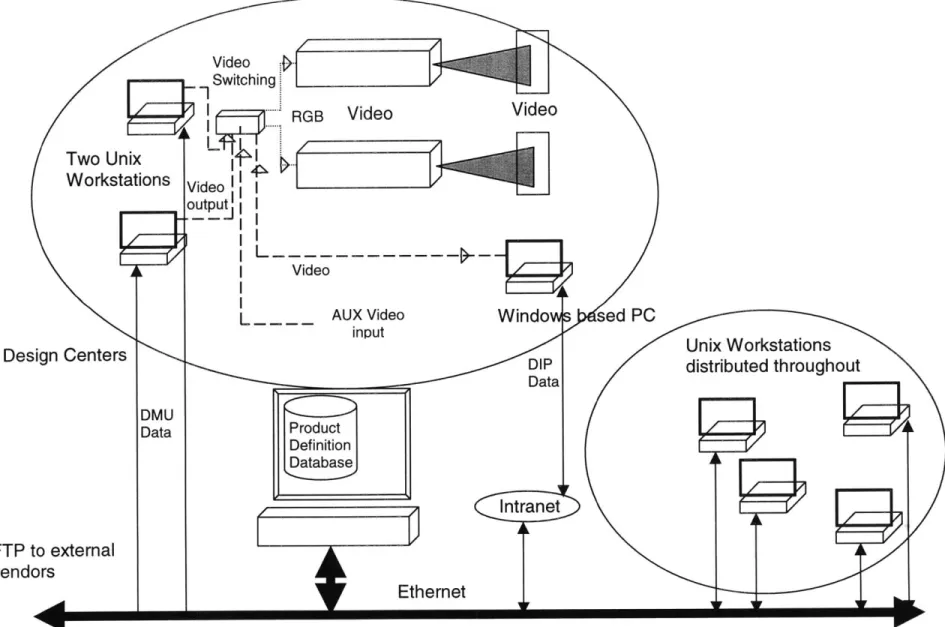
The site visit to Saab AB focused mainly on the area of detailed design of airframe structures and system integration. Saab AB has turned to simulation, modeling, and the use of Digital Mock-Ups (DMU) to greatly reduce the time needed to verify the sub-systems requirements to the allocated baseline requirements [24]. An organization-wide product definition database serves as a baseline from which all IPD team members can work using discipline specific tools. Simulation is used extensively during the design
process to verify manufacturing, assembly, maintenance, and later in the life cycle, for customer support.
Three design centers and an application to capture meeting minutes were implemented to:
" Decrease the time from design to decision
e Increase the rate of communication for the IPD team members e Move decision making down to the lowest level possible
* Postpone generating drawings as long as possible
e Capture the design knowledge and carry it forward with the design [32].
The meeting minutes application, known as "DIP" (a Swedish acronym), is a method for carrying knowledge along with the design. DIP can also be thought of as a decision database as it is accessible to all project engineers on-line before and after a meeting. It is used to set the meeting agenda and to assign explicit responsibilities to team members.
DIP has also been found to be very useful in documenting the designs. Please see
Appendix L for more information on the "DMU Rooms." The system architecture and structural analysis and modeling process followed at Saab AB can be seen in Figures
6.1-1 and 6.6.1-1-2 respectively [23].
During the analysis of the data from the site visit it began to appear that Saab has implemented many of the Lean Enterprise Model enabling practices [29]. Key practices that were believed to be identified are:
e Assure seamless information flow
e Make decisions at the lowest level possible
Design Centers FTP to external vendors Video Switching RGB Video eo put -
Ii
-I I Video L_ AUX Video input Video Unix Workstations distributed throughoutA structural modeling process followed at Saab is an iterative loop that is used to verify
the sub-assemblies to the allocated baseline. Modeling analysis flows from a CATIA model of the aircraft perimeter. Computational fluid dynamics is used to determine the load distribution and a load case is defined for input into the structural models developed in I-DEAS. NASTRAN is used for finite element analysis of the structure. Landing and flight dynamics are then incorporated into the load cases and the process is iterated to refine the detailed design and structural sizing. Additionally, as the program matures load cells are incorporated into the test and production craft to continuously validate, refine, and update the models and the load cases used in the simulations.
CATIA
CFD Loads 1-DEAS
Dynamics NASTRAN
Key to this
analysis is good Detail design sizin(
definition of load cases
Core Technologies:
Existing systems that could be utilized in the DE-ICE architecture were researched to gain insight into their functionality, level of maturity and usability. DOME which was developed in the MIT CAD-LAB, and IMAGE developed at Georgia Tech were researched and are summarized below.
DOME:
Distributed Object-based Modeling and Evaluation (DOME) enables the rapid construction of integrated design models to improve product quality and reduce development time. DOME allows different engineering applications and design models to interact in a common environment [9]. Modules are created that encapsulate engineering models, data, or software applications. These modules or objects can then interact with each other through services over the World Wide Web (WWW) thus allowing for the exchange of information. Interactions between modules are achieved by publishing and subscribing to services that can be remotely provided through the WWW
[11].
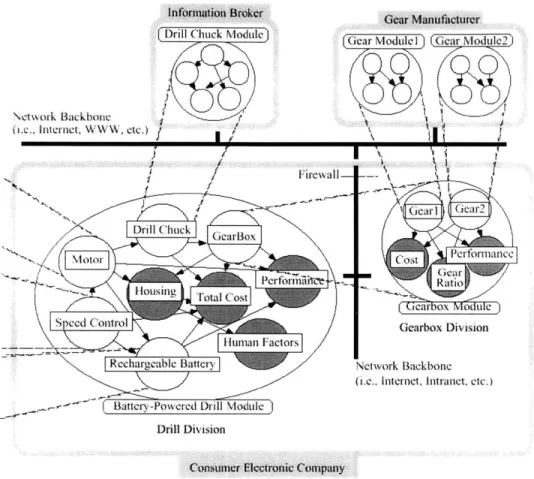
DOME enables aggregation of the individual sub-problem objects, simulation execution, and analysis of the whole system no matter where the objects reside or what discipline-specific tool was used to create it. Further, since each sub-problem is a stand-alone module there is a potential for model cataloging and reuse. Individual objects can be integrated using relationships that define their interactions. Figure 6-3 shows how individual distributed objects are aggregated into sub-system modules and then into a holistic system for a simple cordless drill.
A key feature of DOME is that it allows a design to evolve over time by allowing the
system designers to define modules (declaring the services it can provide) without implementing the embedded model. Initially a model can be defined by a simple
function that the sub-problem is expected to emulate [10] and can be further refined over time.
Informtion Broker
Gear Manufacturer
\etwork Backbone
(i.e. internet, WWW, etc.)
Network Backbone
(i.e., Internet, Intranet. etc.)
Drill Division
Consuner Ekectronic Company
Figure 6.1-3 Distribution of the Modeling Resources
(From: Modeling and Evaluation of Product Design Problems in a Distributed Design Environment)
DOME includes design optimization tools for system evaluation. Evaluation models can be embedded into the modules to provide evaluation services that facilitate observing quality and evaluating alternates from different viewpoints. Evaluation services include probability acceptance modeling, Design Structure Matrix (DSM), neural networks, Genetic Algorithms (GA) for system wide optimization, and multi-dimensional spider graphs to indicate the effects of trade-offs.
DOME uses a three-tier, distributed, object modeling architecture consisting of a client GUI, DOME server, and model repository that interact using a standard CORBA interface. Figure 6.1-4 shows the main system components of the DOME architecture.
DOME server interface
interrace/ pointer of an interface
pointer requests for a service
Figure 6.1-4 Components of the DOME System Architecture (From: A Web Based Collaborative Design Modeling Environment)
IMAGE:
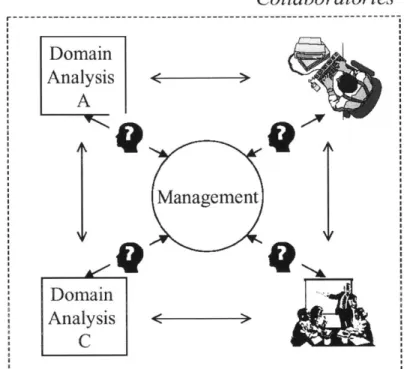
Georgia Tech is currently developing a collaboratory framework called Intelligent
Multidisciplinary Aircraft Generation Environment (IMAGE). Collaboratory
frameworks are defined as integrating disparate domain analysis tools, management of complex systems, communication of design information, and human distributed
decision-making [12]. IMAGE is a multi-media based, designer-oriented, collaborative
Collaboratories
r
---Domain Analysis < A Management Domain Analysis < C
Figure 6.1-5 A Collaborative Framework
(From: Enabling Advanced Design Methods in an Internet-Capable Framework)
Seven functional components which include database functionality, process management, and advanced design functionality are designed to facilitate modeling, simulation, and design along with a Lean-Server concept make up the backbone of IMAGE. IMAGE currently supports technology assessment, design method integration, and distributed simulation [13].
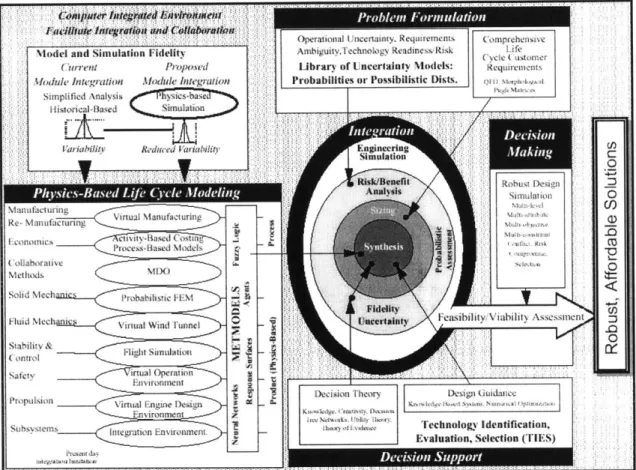
IMAGE is currently used as the prototype architecture for the Virtual Stochastic Life Cycle Design Environment (VSLCDE), which is designed to facilitate decision-making over time. Figure 6.1-6 shows the relationships of the five major elements undertaken when a design project commences [14].
" Problem formulation * Life-cycle modeling * Integration
e Decision making
Please see Elements of an Emerging Virtual Stochastic Life Cycle Design Environment for a more detailed description of VSLCDE.
Figure 6.1-6 Conceptual Diagram of VSLCDE
(From: Elements of an Emerging Virtual Stochastic Life Cycle Design Environment)
Research Findings:
Site visits and research revealed that the IPD teams use dedicated team members and in some instances functional team leaders in their integrated concurrent engineering
sessions. The NASA PDC sessions are highly scripted to maintain team focus. Meeting notes and annotation are collected in real time during the design session.
Problem Formulation
Decision MA ing
Saab uses the DIP application to structure meetings, assign responsibilities, and to retain organizational knowledge in the form of the decision database. The DIP meeting notes also considered official design document. The design rooms allow interactive design sessions of the IPD teams that increase the communication between team members. Saab is mainly focused on communication of the design teams instead of integration of design tools. This is due to the fact that as systems become more complex, a single engineer may no longer comprehend the complexity.
* Communication is a driving factor in all organizations studied
e Communication and documentation are integrally linked in these systems e Team member with little initial stake in the design can make very good
documenters and will get drawn into the process
e Need to consider the clock-speed of typical software packages used and support
from vendors (normally - 1.5 years)
e Plan for upgradability of the software systems
e All ICE sessions are heavily dependent on a team leader to maintain focus, tempo
of meetings, consideration should be given to short training session for the team leads
In academia possible problem that may arise are:
e Inexperienced engineers may have difficulty developing good first order models e Maintaining balanced teams to help optimize globally may not be possible e Remembering that decisions are still made by humans
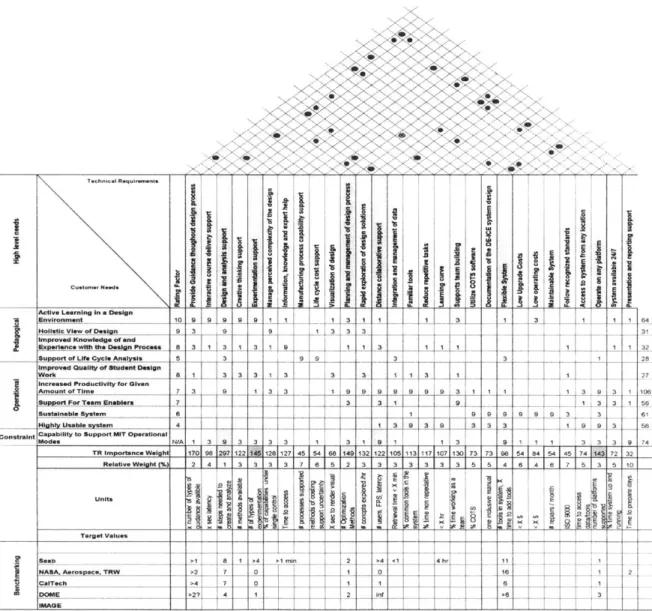
6.2 Technical Requirements
System Technical Requirements (TR) were filtered down from user needs through QFD.
A QFD requirements matrix was generated and iterated to properly capture the highest
technical requirements. Due to the limited time of this study only the highest priority
technical requirements were used to develop the system architecture. The QFD
requirements matrix is shown in Figure 6.2-1.
2 x x' X X , < x > X, X x \Technica Req u Iremnt, E Cu-1me Need. Active Learning In a Design
Environment 10 9 19 9 9 9 1 1 1 3 1 1 1 3 1 1 1 1 _4
Holistic View of Design1- 9 3 9 9 1 3 3 3 131 impove Kowldgeofand
Exeinewt h eIgn Process 8 3 1 3 1 3 1 9 1 1 3 1 1 1 1 1 32_
Support of Life Cycle Analysis 5 39 9 3 31 28
Improved Quality of Student Design 12
Work 8 1 3 3 3 1 3 3 3 1 1 3 1 12
Con
increased Productivity for Given
Arnount of Tirne 7 3 9
j Support For Team Enablers 7 Sustainable System
Highly Usable system 4
straint Capability to Support MIT Operational
Modes N/A 1 3 8 3 1 3 3 1 9 9 9 9 9 9 9 3 1 1 1 1 3 9 3 1 106 3 3 1 9 1 3 3 1 56 1 9 9 9 9 9 9 3 3 61 1 3 9 1 9 3 56 3 3 3 1 3 1 91 13 9 1 1 1 3 . 3 3 9 74 TR Importance W*_ _t 1701 98 287 122 1112811271 45 54 68 14 132 122 105 113 117 107 130 1 73 _98 54 84 54 45 74 i44 72 32 Relative Weight (%) 2 4 1 3 3 3 3 7 6 5 2 3 3 3 3 3 3 5 5 4 6 4 6 7 5 3 5 10 Units 0 X at Target Values -Saab >1 8 1 >4 1 min 2 >4 <1 4hr 11 1 NASA, Aerospace, TRW >2 7 0 7 1 0 161 2 CalTech >4 _7 0 1 1 6 1 DOME >2? 4 1 2 inf >6 3 IMAGE
Figure 6.2-1 DE-ICE QFD Requirements Matrix
User needs, categorized as pedagogical and operational are inserted on the left side of the
representatives of the Aeronautics and Astronautics Department are listed just to the right of the user needs. The main body of the QFD matrix is the relationship matrix area where each technical requirement is assigned to a column and evaluated against a need. Next, a decision is made as to the importance relationship of each TR. This determines the relationship of a TR to a specific need. Relationships to the needs are weighed on a 9,
3, or 1 scale depending on a strong, medium, or low relationship respectively. Each TR
weighting factor is multiplied with the ranking factor of the needs and summed in the bottom of the TR columns to give a total importance score for the TR. Directly beneath the total score is the relative importance score of the TR.
Measurable units used to specify each TR are located at the upper portion of the lower section. Under this is a benchmarking section where each existing system that contains a comparable TR is rated to allow for a goal to be set for the DE-ICE system.
The QFD matrix generated seven TRs: four from the highest ranked and three that ranked strongly against the single constraint. A sensitivity study conducted on the QFD matrix revealed a borderline TR which was carried along with the original seven. The TRs for the system are (in order of importance):
1. Design and analysis support
System should provide the hardware and software tools the students need during the design and analysis process.
2. Provide guidance throughout the design process
Give students access to information, examples, theory, etc. which should provide a roadmap through the life cycle of a product design.
3. Planning and management of the design process
Help students define, schedule and monitor tasks, deliverables between tasks and the progress of their project.
Support of the design, implementation, analysis and integration of results of experiments, including resources and tools that will help students interface with computers, machines, controllers, etc.
5. Operate on any platform
Give the students and faculty the ability to work in any environment (UNIX, Mac,
PC operating system).
6. Distance collaboration support
Provide remote capability to attend a class, easily interact with remote teammates and access external resources (specialists, professors, etc.).
7. Flexible system
Have the ability to adapt easily to different operational modes, subjects, projects or new technology.
8. Presentation and reporting support
Provide students the capability to effectively present and report their progress and results.
These TRs were used in the QFD Product Matrix to synthesize possible architectural variants for the DE-ICE system.
The top section or "roof" of the house of quality is the correlation matrix that was used to determine the conflicts between the TRs (Boppe [25]). The main conflicting TRs are:
e Design and Analysis Support vs. Operate on Any Platform
Due to the large variety of software tools and operating systems special care would be needed to ensure that the system could operate on any type of platform.
e Design and Analysis Support vs. Flexible System
Tight Integration of design and analysis tools that will support the life cycle of a design may tend to make the system highly inflexible and limit the evolution of the
system. The system should support the ability to "snap-in" new tools for design and analysis as the system evolves.
* Distance Collaborative Support vs. Flexible System
For teams to be able to effectively collaborate at a distance a mix of
communication, and distributed design and analysis tools are needed. If these tools are not integrated well they may be of little usefulness. Whereas integrating these components into a useable sub-system may tent to limit the flexibility of the system.
* Distance Collaborative Support vs. Operate on Any Platform
Distance collaborative tools will need to operate on an inhomogeneous mix of at least three major platforms. Selection and integration of tools to support
distributed teams that are truly platform independent may not be possible.
These conflicts need to be managed and considered as the design progresses and any systems that are built for the system should either support multi-platform use or utilize a client -server architecture. Design and analysis tools should utilize a standard application interface for tool integration.
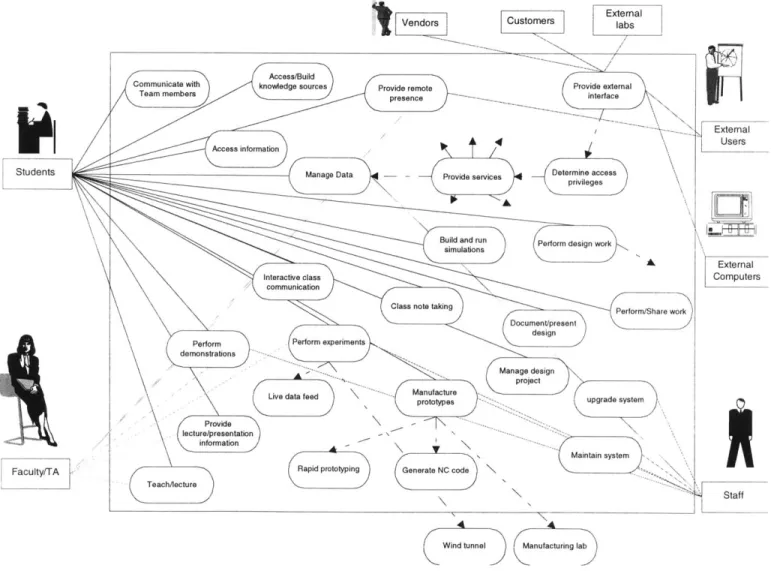
6.3 Use Case Diagrams
Use Case Diagrams helped identify the need for an external user interface that would determine levels of access privileges assigned to each external user, and to provide services based on those privileges. A Use Case Diagram for DE-ICE is shown in Figure
6.3-1 and a "design" Use Case is shown in Figure 6.3-2. Use Case analysis showed that
there would be four main actors interacting with the system faculty/TAs, students, staff and external users. Creating the Use Case diagram also showed that some of the DE-ICE functionality extended beyond the system boundary. Use Cases for the faculty show the main expected interaction with DE-ICE, but they should be able to use any functions of the system.
Wind tunnel Manufacturing lab
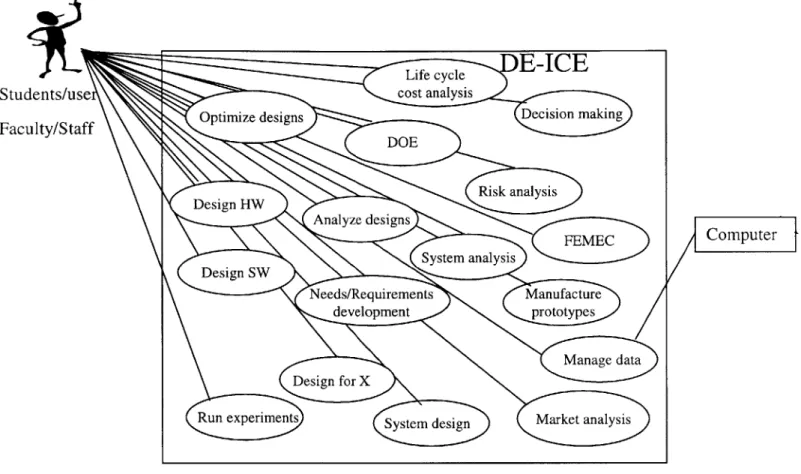
The design Use Case was evaluated separately because the functions can be used separately or through an integrated instance from the "perform design work" function.
Figure 6.3-2 Design Use Case Diagram
The "manage data" function is shown as being able to be accomplished by students and or a computer. This may put an unnecessary requirement on the users but it was felt to be advantageous to give users the freedom to manage their own data if they so choose.
7. Architectural Synthesis
The highest ranked TR's and their importance weightings were used in the QFD Product Matrix. Both were placed in the Product Matrix on the left side and multiple implementations were created along the top to satisfy each TR. Use of the product matrix enabled the team to quickly synthesize architectural concepts for the system while maintaining traceability to the user needs. Another relationship matrix was used in the body of the Product Matrix as defined in Section 4 and will not be repeated here. Total importance rankings were used to compare the baseline architecture to the variants generated by each team member. This gave a rough indication of the possible "overall relative" improvement. The Product Matrix may be seen in Figure 7-1 through 7-5.
Architectural implementations are grouped by functionality and a bold typeface indicates a hardware-based implementation. Individual and groups of implementations considered for prototyping are highlighted in the top of the Product Matrix.
Development of the Product Matrix occurred in an iterative fashion. Each time the team met to discuss their concepts, new items "bubbled-up" and were added to the Product Matrix.
Below the Product Matrix is a section where the architectural variants were analyzed. When an implementation was selected for a particular architecture, its score from the relationship matrix was carried down into this section allowing the team to evaluate the percent improvement of each concept relative to the baseline. This may be seen in Table
7-1.
Architectural Variant Total Score Percent Improvement
A 165405 61.4%
B 81703 21.9%
C 120136 46.9%
Baseline 63781 0.0%
ABC' 116886 45.4%
I I OnArs~tinn 5~v~ta~m~ I Print~r~ Simulation Tools
Technical Requirements 0 9
Design and analysis support 297 3 1 3 3 3 9 9 9 9 9 9
Provide guidance thoughout design process 170
Planning and management of design process 149
Experimentation support 145 3 1
Operate on any plaform 143 - 1 1 1 1 9 1 1 1
Distance collaborative support 122 3 1 3 3 1 9 1 1
Flexible system 98 3 3 1 3 3 3 3 9 3 3 9 1 1
Presentation and reporting support 32 3 3 1 9 3 3 3 9 3 1 1
Design priorities * * * * * * * * TR Importance Weigh 756 512 496 660 1616 830 1424 1100 2571 1546 5277 2816 2771 3068 2850 2816 eaive eig 8 11 11 9 4 7 4 5 3 4 2 2 2 2 2 2 Architecture A l Xi X
lxi
X_ Xilx
XxI
XI X Ix
X 1______________ 756 1I
1 1 11830 1 14241 11001 2571 1 1 52771 12771130681 1i Architecture________1
X XII
I
XI
X1027I
7I
1
I1 ArhtcueB7561 496 1 660 116161 1 14241 257 x10 1 5277 1 1Architecture C
[
XI1
I ___IT X I X __ X__ I__x
x
III __IXBaseline Architecture X~~.
1
____ X__x
I___ I* IArchitecture ABC'
XEX
L
X
I
![
I
X
1
1
I
1
I
I
____________756_____________ 8301J5711 1527 1 1 1
Figure 7-1 DE-ICE QFD Product Matrix Page 1
Modeling & Model Management Tools Math Tools Discipline-Specific Design Tools I\'9 -Z N C7 AC4jxO 3 3 1 1 3 9 3 3 3 9 9 9 9 9 9 9 9 9 9 9 9 9 9 1 1 9 1 9 3 3 1 1 1 1 9 1 3 9 1 3 1 1 1 3 3 3 1 1 1 3 1 3 1 1 1 1 1 891 1111 297 806 1859 5352 923 1034 2210 3369 3184 3663 3091 2961 2961 2961 2818 3992 2771 2818 2771 3440 2771 7 5 19 7 3 1 6 6 3 2 2 2 2 2 2 2 2 2 2 2 2 2 2
E
x X I X I I X [ _ x Ix Ix x X I x x x x x X I Xx IxF
1I
1
118591
53521 1 122101 33691 1 13091 2961 296 11 2818139921 12818 13440 2 77 1] __x_ 1 x lx ii xiixi lx ii x_ __I__I__I__X__I__X _ I -i I-- I ...-_ I L _ JIX
I
I
1 806 '1859' 12210 3663 2961 1 3992 1 1_1 I (x[ I I I I lxIx I I x 1 x I x x x x x x) 1 1 18591 1 1 1 3184 3663 129611 129611 28181 39921 27711 28181 2771 344012771 x x x IXI I x -x[ x-- x J 806 118591 1 9231 1 3369 12961 111 39921 128181 1 12771 xi X I Ii I Ix I-x I x[ I_ I_ I_ I I I I I x X 1...L...L... 806 118591 53521 923 1 [ 3663130911 2961 [ 1I139912771j 1 1 J 344012771Guidance Project management tools Experimentation Support
C
cC3
-~ c~ Sq~Z, I\N Z' 613 e~ - c4 c- 2 91 9__99 9_'V 1 1 1 1 1 1 1 3 9 1 9 9 9 9 9 9 9 1 19 1 1 6 9 9 9 9 3 1 1 9 911 3 1 1 13 2817 1714 2375 3530 2099 370212873129661 196 840 1516134 1511 3002 1732 1525 2051 1305 1337 2644 1305 1305 16021 2 4 3 2 3 2 12 12 1- 4 14 4 2 4435 5 3 5 5 4 X I x x 1 Ii x T I 287 74 27135301j 20991 3702 1 28731 29661 5161 1 - -02 172 15251 J05 126441 1602 171 x I lxx lxx __ xI 1~~ 1 50 1~ x72 x83 x 1 1j56 1 300211732 1525 120 1 1 1 110 110 x l I 350 x I X - I_ x_ I___ I I IX I I2I7I1275 531 37021 28731 29661_ 196 1_116_1_302 17311525 1 .1 J j xj J I X X__ I I X.... 37021 28731 = I - 30021 17321 15251 1 i-_ I - x x - - - - -E J71 1 3h E 531 2091372 8E E EE61 1 511 1 1 02 ~732 11525j 1 1 H ~ 1 9 Z162Cross Platform Communication Remote Presence 0 00 1C 1q1 11b, 01 1p 4 3 3 3 9 9 1 9 9 9 9 1 9 9 1 9 1 3 3 9 9 3 9 9 3 9 9 9 9 3 3 3 3 9 3 3 3 3 9 3 3 3 1 9 1 1 1 31 1 1 1 1 3 3 3 3 3 1 1 _1 1 1 1 1 9 1 1 19 1 1_1 3 3 3 3 755 755 755 1804 2535 1783 1371 1228 2039 645 1424 1130 366 1484 1377 2385 1228 1751 1751 803 1979 2775 1196 660 756 3227 755 755 7 1804 2535 1783 1371 1228 2039 645 1 11 366 1484 1377 2385 1228 1751 171 803 1979 2775 1196 660 4 756 3227 755 755 1755 2535 X 1 ~ 1371 [12281 1645 X_ I XJ 1424 1 I 1 3 1 1377 X 11228751 I X I X I X I X 1 803 19791 X 462 7 X 3227 xl~ ~ x _ x
jxj_[__
_ x _ x [x x x lxi x__ ~_ x _S2535
645 1424 2385 1228 1751 1751 803 19791 111961 1 1 756 X X X XI
[X
__ _I_ _I_ X 1804 1783 6451 1 12281 17511 1 11979 1 J 3227 1 1804 2551181 1121 231 645 11424 1j 1 1377 12385 112281 1751 11
197911
160 17132 _5 75[ 1 _6 x32I27llili
J
751Flexible System I rresetiiaiionineporiin~ 00 0 0OA0 1 1 1 1 1 1 1 340 91 - 83 111 9 9 199 9 1 1 249 3 3 9 9 9 9 9 9 3 9 1 3 9 3 9 280 3 9 3 3 3 3 1 1 9 3 1 3 9 9 9 1 1 3 1 1 1 171 1 1 9 9 3 3 3 3 3 9 9 9 9 147 1392 13921109811098 1751 2483 1036 803 1673 1680 978 1275 882 857 826 529 1990* 1-45- 1392 142 13 I- 1392 109 10815 U I * A 4i 4 4 4 14 5 5.4 3 6 7 4 4 6 7 1
x x ii I xxIx x Ix 1x Ix lxx Ix x x I x x Voalsco% improv
x1 4 I I x
I
x____ x I x I x 11ticEINipo1 124831 10361 803 116731 16801 978 127 1 85 17781 197 38 826 1529 11683117503511.93955
X~14 4 I I x x I_ x 1 I 1 ~tasoj/I
Ii
X~J
Ix Ix xj x X x IX I I scl -0 1=55 = 14 1 1 1 1 1 4831 1 16731 16801j 978 1j1751 1 117781 1 1 1826 1 529 1 1J 678~j1.1 50
X..4... I x I I X X I X I X xI x I I x I x Tota scor % improv
...
1
155 1j
1424
1 1J 43 0 63 60 7 25 857 1 17781 1974 1 1 826J 529f 1 1861543Figure 7-6 DE-ICE QFD Product Matrix Page 6
IPresentationepotig Flexible System 1778 194 36 1683 1250 1545 1392 1424 7 1 1I 4+ 3 14 -5