HAL Id: inserm-01157591
https://www.hal.inserm.fr/inserm-01157591
Submitted on 28 May 2015
HAL is a multi-disciplinary open access archive for the deposit and dissemination of sci-entific research documents, whether they are pub-lished or not. The documents may come from teaching and research institutions in France or abroad, or from public or private research centers.
L’archive ouverte pluridisciplinaire HAL, est destinée au dépôt et à la diffusion de documents scientifiques de niveau recherche, publiés ou non, émanant des établissements d’enseignement et de recherche français ou étrangers, des laboratoires publics ou privés.
Trajectories of sleep complaints from early midlife to old
age: longitudinal modeling study.
Paula Salo, Jussi Vahtera, Jane Ferrie, Tasnime Akbaraly, Marcel Goldberg,
Marie Zins, Jaana Pentti, Marianna Virtanen, Martin Shipley, Archana
Singh-Manoux, et al.
To cite this version:
Paula Salo, Jussi Vahtera, Jane Ferrie, Tasnime Akbaraly, Marcel Goldberg, et al.. Trajectories of sleep complaints from early midlife to old age: longitudinal modeling study.. SLEEP, American Academy of Sleep Medicine, 2012, 35 (11), pp.1559-68. �10.5665/sleep.2210�. �inserm-01157591�
SLEEP, Vol. 35, No. 11, 2012 Trajectories of Sleep Complaints—Salo et al INTRODUCTION
The widely acknowledged association between aging and in-creasing sleep problems has recently been challenged.1 There is evidence to suggest an age-related weakening of the ho-meostatic and circadian sleep mechanisms, affecting nighttime sleep consolidation and daytime sleep propensity.2 In addition, prevalence of insomnia tends to increase with age.3 This may be explained by chronic diseases, such as cardiovascular disease, which are known to increase with age and are also associated with sleep disorders.4 However, these findings do not necessar-ily mean that sleep complaints due to worry increase with age because subjective sleep complaints are only moderately cor-related with polysomnography sleep findings.5
Assessment of the effect of age on sleep complaints is not straightforward, as long-term follow-up data that span many decades are rare. There are numerous cross-sectional studies on age and different aspects of sleep complaints, but this evi-dence is inconsistent. Some studies have suggested that sleep dissatisfaction or poor sleep quality in general6-9 and insomnia
TRAJECTORIES OF SLEEP COMPLAINTS FROM EARLY MID-LIFE TO OLD AGE
http://dx.doi.org/10.5665/sleep.2210
Trajectories of Sleep Complaints From Early Midlife to Old Age: Longitudinal
Modeling Study
Paula Salo, PhD1,2; Jussi Vahtera, MD, PhD1,3; Jane E. Ferrie, PhD4,5; Tasnime Akbaraly, PhD4,6; Marcel Goldberg, MD, PhD7,8; Marie Zins, PhD7,8;
Jaana Pentti, BSc1; Marianna Virtanen, PhD1; Martin J. Shipley, MSc4; Archana Singh-Manoux, PhD4,7; Yves Dauvilliers, MD, PhD9; Mika Kivimaki, PhD1,4 1Finnish Institute of Occupational Health, Helsinki, Finland; 2Department of Psychology, University of Turku, Turku, Finland; 3Department of Public Health, University of Turku and Turku University Hospital, Turku, Finland; 4Department of Epidemiology and Public Health, University College London Medical School, London, United Kingdom; 5School of Community and Social Medicine, University of Bristol, Bristol, United Kingdom; 6INSERM U1061, Montpellier, France; University Montpellier I, Montpellier, France; 7INSERM, U1018, Centre for Research in Epidemiology and Population Health, France; 8Versailles-Saint Quentin University, Versailles, France; 9Department of Neurology, Hôpital Gui de Chauliac, INSERM U1061, Montpellier, France
Submitted for publication October, 2011 Submitted in final revised form May, 2012 Accepted for publication June, 2012
Address correspondence to: Paula Salo, PhD, Finnish Institute of Occu-pational Health, Lemminkäisenkatu 14-18 B, FI-20520 Turku, Finland; Tel: +358 30 474 7553; Fax: +358 30 474 7556; E-mail: paula.salo@ttl.fi
Study Objectives: To estimate trajectories of sleep lost over worry as a function of age, using longitudinal modeling, and compare these trajecto-ries with those for insomnia symptoms.
Design and Setting: Data from two prospective, occupational cohorts (the Whitehall II and Finnish Public Sector studies) comprising 84,384 observations from four to eight repeat measurements in 1985-2010.
Participants: There were 16,408 men and women age 34-79 yr.
Measurements and Results: Age-related trajectories of sleep lost over worry and insomnia symptoms (sleep initiation or maintenance problems, nonrefreshing sleep) were estimated using repeated-measures log-binomial regression analysis and generalized estimating equations. These analyses were adjusted for year of birth and time of measurement to minimize confounding by cohort or period effects. The prevalence ratio for in-somnia symptoms was higher in older age groups compared with participants age 34-45 yr. In contrast, the age-related trajectory of sleep lost over worry included two phases: a period of high prevalence of sleep complaints at age 34-60 yr followed by a declining trajectory at older ages. Com-pared with participants age 34-45 yr, prevalence ratios for sleep lost over worry were 0.63 (0.49-0.80) and 0.59 (0.41-0.84) in the Whitehall II study participants ages 61-65 and 71-79 years. Corresponding figures were 0.62 (0.52-0.75) and 0.46 (0.32-0.66) in the Finnish Public Sector study. Conclusion: This study shows a general age-related decrease in sleep lost over worry between late midlife and old age, a pattern strikingly differ-ent from the age-related increase in insomnia symptoms.
Keywords: Sleep initiation and maintenance disorders, sleep lost due to worry, insomnia; epidemiology
Citation: Salo P; Vahtera J; Ferrie JE; Akbaraly T; Goldberg M; Zins M; Pentti J; Virtanen M; Shipley MJ; Singh-Manoux A; Dauvilliers Y; Kivimaki M. Trajectories of sleep complaints from early midlife to old age: longitudinal modeling study. SLEEP 2012;35(11):1559-1568.
symptoms corresponding to the Diagnostic and Statistical Man-ual of Mental Disorders, Fourth Edition (DSM-IV) criteria10-17 are more prevalent in older adults, but other studies have failed to replicate these findings.11,18-20 A recent cross-sectional study of more than 150,000 adults found a nonlinear association be-tween age and self-reported problems with sleep initiation and maintenance or sleeping too much.1 The prevalence of sleep disturbances was the highest among those age 18-24 yr and de-creased in a nonlinear manner until the age of 80 yr or older. Methodologic limitations may have contributed to these incon-sistencies. Cross-sectional data cannot capture within-individ-ual change nor can they distinguish the effect of chronologic age from contextual change (cohort effects), or secular changes related to specific historical periods (the period effect). These three influences represent different underlying mechanisms; ef-fects of age reflect the natural history of sleep complaints but cross-sectional findings are also affected by cohort and period effects, which are associated with changes in factors affecting sleep behaviors at different points in time.
Recent studies suggest sleep lost over worry, an indicator of sleep disturbances, is a robust predictor of increased cardiovas-cular morbidity and mortality.21,22 Sleep lost over worry has also been found to be associated with an increased risk of alcohol-related problems.23 When compared with the Jenkins Sleep Problem scale,24 a widely used measure of insomnia symptoms in epidemiologic research, the measure of sleep lost over worry seems to have lower sensitivity, but relatively good
specific-SLEEP, Vol. 35, No. 11, 2012 Trajectories of Sleep Complaints—Salo et al
ity in identifying insomnia.25 Thus, it may measure a different aspect of disturbed sleep compared with insomnia symptoms. Sleep loss in general is associated with decline in cognitive per-formance26,27 and adverse health conditions, such as elevated blood pressure, increased cortisol secretion, and deteriorated immune response.28-30 However, we are not aware of studies that have examined the association of age with the evolution of sleep loss specifically related to worry.
In this study, we sought to describe the evolution of sleep lost over worrying as a function of age from early midlife to old age. To achieve robust estimation of age-related trajectories, we obtained data from two independent large-scale European cohorts with four to eight repeat measurements of sleep com-plaints over one to two decades for a total of more than 16,000 adults age 34 to 79 yr. A significant advantage of these data is the opportunity to stratify analyses by date of birth and calendar period, i.e., phase of measurement, in each of the studies and thus control for two major sources of bias, cohort and period effects. For comparison, we performed corresponding analyses for self-reported frequency of insomnia symptoms, shown pre-viously to increase with age.31,32
METHODS
Study Population and Design
Participants were from the prospective cohorts of the Whitehall II study, United Kingdom, and the Finnish Public Sector study, Finland, for a total of 16,408 men and women. Approval was obtained from the University College London Medical School committee on the ethics of human research for the Whitehall II study, and the ethics committee of the Finnish Institute of Occupational Health for the Finnish Pub-lic Sector study.
Whitehall II Cohort: This cohort was initially recruited in 1985-1988 (Phase 1) from 20 London-based civil service de-partments; 10,308 participants (67% men) age 35-55 yr re-sponded (response rate 73%).33 Eight further data collection phases (Phases 2 to 9) have taken place. In addition to Phase 1, the current study used data from Phases 2 (1987-1990),
3 (1992-1994), 5 (1997-1999), 6 (2000-2001), 7 (2003-2004), 8 (2006-2007), and 9 (2008-2010) (Table 1). Data from Phase 4 were not included because this phase did not include a compa-rable measure of sleep complaints. We included all participants with sleep data at least at Phases 1 and 9, yielding a sample size of 6,601 participants (71% men) age 34-56 yr at Phase 1 and 55-79 yr at Phase 9. The dropout rate was 36% during the follow-up of up to 24 years.
Finnish Public Sector Study: The target population was pub-lic sector employees in 10 towns and 21 pubpub-lic hospitals in Finland.34 At baseline a random sample of the employees was invited to participate and responders included 11,168 employ-ees age 18-65 yr (15% men) participating in a questionnaire sur-vey in 1997-1998 (Phase 1, response rate 70%). Four follow-up surveys targeting the entire personnel of the participating orga-nizations were carried out in the years 2000-2002 (Phase 2, n = 48,598, response rate 68%), 2004-2005 (Phase 3), 2006 (Phase 4, did not include a comparable measure of sleep complaints) and 2008-2009 (Phase 5). In this analysis, we included partici-pants who have responded at least to the Phase 1 and Phase 5 surveys and were age 34 yr or older at baseline to correspond with the Whitehall II study, a total of 9,807 participants (15% men, reflecting the sex mix in municipal employees) age 34-66 yr at Phase 1 and age 45-78 yr at Phase 5. The dropout rate was 12% during the follow-up of up to 12 years.
Measurement of Sleep Lost Over Worry
In both the Whitehall II and Finnish Public Sector studies, sleep lost over worry was assessed using a single item from the General Health Questionnaire,35,36 used previously to show an association between sleep lost over worry and cardiovascular morbidity and mortality.6,7 The participant was asked to think about the past few weeks when responding to the question “Have you recently lost much sleep over worry?”, using the following response categories: 1 = “not at all”, 2 = “no more than usual”, 3 = “rather more than usual”, 4 = “much more than usual”. Responses were dichotomized to indicate presence (re-sponse alternatives 3 and 4) or absence (re(re-sponse alternatives 1 and 2) of sleep complaints. Sleep lost over worry was measured Table 1—Prevalence rates for sleep lost over worry among United Kingdom civil servants in the yr 1985-2010 (Whitehall II) and Finnish public sector
employees in the yr 1997-2009 (Finnish Public Sector study) by sex and age group
Whitehall II (n = 6601) Finnish Public Sector study (n = 9807) Lost sleep, no. of
measurements (%) Total no. of person- measurements measurements (%)Lost sleep, no. of Total no. of person- measurements
All 6,302 (12.85) 49,032 8,016 (22.67) 35,352 Men 3,892 (11.19) 34,772 1,025 (19.52) 5,251 Women 2,410 (16.90) 14,260 6,991 (23.23) 30,101 Age group, yr 34-40 554 (15.57) 3,557 632 (21.09) 2,996 41-45 801 (14.76) 5,427 1,222 (23.15) 5,279 46-50 933 (15.40) 6,057 1,765 (23.71) 7,445 51-55 1,376 (15.52) 8,866 1,943 (24.44) 7,950 56-60 1,212 (12.75) 9,504 1,508 (24.72) 6,101 61-65 676 (9.46) 7,146 600 (17.84) 3,363 66-70 451 (8.82) 5,112 295 (15.89) 1,857 71-79 299 (8.89) 3,363 51 (14.13) 361
SLEEP, Vol. 35, No. 11, 2012 Trajectories of Sleep Complaints—Salo et al
eight times in Whitehall II (Phases 1-3 and 5-9) and four times in the Finnish Public Sector study (Phases 1-3 and 5).
Measurement of Insomnia Symptoms
Further, to elucidate our results for sleep lost over worry-ing, we carried out additional analyses of insomnia symptoms. Insomnia symptoms were assessed using the Jenkins Sleep Problem Scale24 and, based on previous studies,37 were hypoth-esized to increase with age. Participants were asked to evaluate how often in the past month they had experienced the following symptoms: difficulties initiating sleep, waking up several times per night, awakening too early in the morning, and non-refresh-ing sleep. These self-reported insomnia symptoms correspond to the DSM-IV diagnostic criteria for insomnia (except for day-time consequences). The response scale ranged from 1 (“not at all”) to 6 (Whitehall II study “22-31 days”; Finnish Public Sector study “every night”). If the participant reported more than one symptom, the frequency of insomnia symptoms was defined by the most frequent symptom. Symptoms occurring at least 5 nights per week (response alternative 6 in the Whitehall II and response alternatives 5-6 in the Finnish Public Sector study) defined participants with insomnia symptoms.
Time-Dependent Covariates
Current smoking (no/yes), excessive alcohol consumption, low physical activity, and obesity were used as time-dependent covariates in both studies.
In Whitehall II, height and weight were measured to obtain body mass index (BMI, weight in kg/height in meters squared) which was dichotomized (obese, BMI ≥ 30 kg/m2 versus non-obese, BMI < 30 kg/m2). Smoking status (current smoker versus nonsmoker) was requested. Alcohol consumption in the previ-ous week was measured as units per week, then categorized as heavy (> 21 units for men, > 14 units for women)38 versus other. Physical activity was assessed based on responses to questions on the frequency and duration of participation in moderately energetic (e.g., dancing, cycling), and vigorous physical activ-ity (e.g., running, playing squash). Participants were classified as inactive (< 1 hr/wk of moderate physical activity and < 1 hr/ wk of vigorous physical activity) versus other.
In the Finnish Public Sector study, obesity was defined based on self-reported height and weight. Participants reported their average weekly consumption of beer, wine, and spirits in por-tions, which were converted into units of alcohol and catego-rized as heavy (> 21 units for men, > 14 units for women)38 versus other. Participants assessed the quantity of their physical activity equivalent to walking, brisk walking, jogging, or run-ning. Physical inactivity was defined as ≤ 2 metabolic equiva-lent task hr per day (no/yes),39 a definition close to that used in Whitehall II.
Statistical Analysis
Age was calculated for each year of survey response in both cohorts and divided into 5-yr age groups. For assessment of the period effect, we used survey phases as indicators of pe-riod. To examine cohort effects, the participants were divided into similar birth cohorts for both studies based on the timing of World War II. The participants from the Whitehall II study were divided into three subcohorts (yr of birth 1930-1938,
1939-1945, 1946-1952), whereas those from the Finnish Pub-lic Sector study were divided into six subcohorts (year of birth 1931-1938, 1939-1945, 1946-1952, 1953-1959, 1960-1963).
All analyses were performed using the SAS statistical soft-ware, version 9.2 (SAS Institute, Inc., Cary, NC). In each cohort, age-related trajectories of sleep lost over worry were analyzed using repeated-measures log-binomial regression analysis with the generalized estimating equations (GEE) method.40,41 The log-binomial model, rather than logistic regression, was chosen because of the high prevalence of the outcome (> 10%). The repeated measurements were nested within participants, i.e., the same individuals contributed more than one observation to the data set, and the nonindependence of the within-participant observations was taken into account in estimating the standard errors. The main effects of sex, age, period, and birth cohort were included in the model 1. The model 2 was additionally adjusted for time-dependent covariates current smoking, excess alcohol use, physical inactivity, and BMI. We first examined the shape of the sleep trajectories graphically and then calculated prevalence ratios (PR) for sleep lost over worry and their 95% confidence intervals (CI) for the different age groups. Similarly, incidence ratios (IR) and their 95% CI were calculated by in-cluding only those participants who did not report sleep lost over worry at the preceding period (approximately 4- to 5-yr incidence; results reported in the Appendix). Age groups 34-40 yr and 41-45 yr were combined into one reference group to ob-tain sufficient statistical power and to harmonize the reference age group across the studies and the analyses of prevalence and incidence.
In the analysis of sex differences in the effect of age on sleep complaints, we pooled data from the Whitehall II and Finnish Public Sector studies to increase statistical power. We calcu-lated PRs for sleep lost over worry and their 95% CI for the dif-ferent age groups (reference category, the youngest age group) separately for men and women. These analyses were adjusted for study (Whitehall II versus Finnish Public Sector study).
In addition to the main analysis, in which response was re-quired both at the first and last periods, we ran an analysis in-cluding all the participants who responded at least to the first survey. Using the chi-square test, we compared those who had produced a response both at the first and last periods to those who dropped out at some point after the first period. These groups were compared with regard to the outcome and sex, age, health behavior (current smoking, alcohol consumption, physi-cal inactivity), and BMI.
We applied these same approaches for the subsidiary analysis of insomnia symptoms. The harmonized cut-point for insomnia symptoms across the two studies was reporting any of the four insomnia symptoms during at least five nights per week. How-ever, we repeated the analyses using a lower harmonized cut-point, which was experience of insomnia symptoms at least two nights per week in both studies.
We conducted a sensitivity analysis excluding those partici-pants who reported use of sleep medication. At Phases 1, 5, 7, and 9 of the Whitehall II study, the participants were asked if in the past 14 days they had taken sleeping pills prescribed by a doctor. We excluded 256 participants (4%) with an affirmative response. In the Finnish Public Sector study, data on purchase of sleep medication (the World Health Organization’s
Anatomi-SLEEP, Vol. 35, No. 11, 2012 Trajectories of Sleep Complaints—Salo et al
cal Therapeutic Chemical (ATC) classification code N05C)42 were obtained from the Drug Prescription Register of the So-cial Insurance Institution of Finland. In this sensitivity analysis, we excluded the 1,499 participants (15%) who had made any purchase of sleep medication in the years 1994-2005.
RESULTS
Characteristics of the Study Cohorts
Data from 16,408 individuals in the two cohort studies com-prised 84,384 data points. Table 1 shows prevalence rates of sleep complaints by sex and age group in both data sets. The prevalence of sleep lost over worry was 13% across 49,032 person-measurements in the male-dominated United Kingdom Whitehall II study during the observation period between 1985 and 2010, the average follow-up being 21.6 yr (standard
devia-tion [SD] 0.77, range 19-24). Prevalence at baseline was 14%, and 49% of the participants reported sleep lost over worry at least once at some point during the study. In the female-domi-nated Finnish Public Sector study, prevalence of sleep lost over worry was 23% across 40,647 person-measurements during the observation period between 1997 and 2009, with the aver-age follow-up being 10.9 yr (SD 0.71, range 10-12). Baseline prevalence was 22% and 51% of the participants reported sleep lost over worry at least once during the study. Further baseline information regarding sex, age, year of birth, and the covariates is reported in Table 2.
There was no difference in the prevalence of sleep lost over worry at baseline between those who dropped out before the end of the study and those who responded to both the first and last surveys. In both studies, those who dropped out were more like-ly to be current smokers (Whitehall II 26% dropouts versus 14% participants; Finnish Public Sector 21% versus 14%, P < 0.0001) and physically inactive (Whitehall II 22% versus 12%; Finnish Public Sector 24% versus 21%, P < 0.01). In Whitehall II, the dropouts were also older (45.4 yr versus 43.9 yr, P < 0.0001) and more likely to be women (40% versus 29%, P < 0.0001) or obese (10% versus 6%, P < 0.0001), but there was no differ-ence in heavy alcohol consumption. In the Finnish Public Sec-tor study, the dropouts were more likely to be men (19% versus 15%, P < 0.0001) and heavy drinkers (8% versus 7%, P = 0.03), but there was no difference in terms of age or obesity.
Age-Related Trajectories of Sleep Lost Over Worry
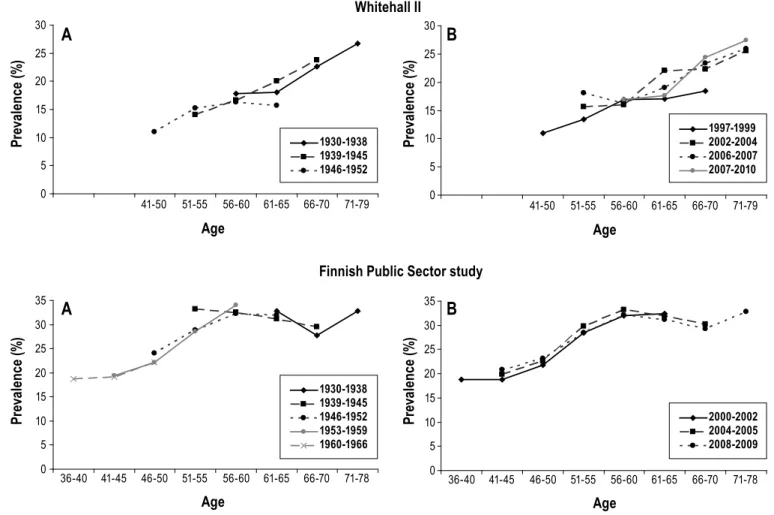
Figure 1 shows unadjusted age-related trajectories of sleep lost over worry by birth cohort (longitudinal analysis) and pe-riod (cross-sectional analysis) separately for each data set. In longitudinal analysis of all the birth cohorts (Figure 1, A), the prevalence of sleep lost over worry was stable (or increased slightly) from early midlife to middle age after which there was a gentle decrease, which leveled off in early old age. In this analysis, the decrease in sleep lost over worry with age was observed in both studies. Prevalence of sleep lost over worry was at its highest between the ages of 46-60 yr and reached its nadir between the ages of 66-70 yr in both studies. This nonlin-earity was supported by a statistically significant quadratic term (age*age P < 0.0001 in both studies) from a regression model in which age was considered as a continuous variable.
A similar declining trend in sleep lost over worry with in-creasing age was observed in the unadjusted cross-sectional de-sign displaying prevalence rates by period (Figure 1, B). In both studies, older age groups reported less sleep lost over worry than the younger groups. No consistent differences in sleep pat-terns were observed for different study periods.
Table 3 presents associations of sex, age, period, and cohort with sleep lost over worry by study cohort in a multivariable model. In both studies, main effects of sex, age, and period were observed (P < 0.0001), but no consistent effect was found for the association between birth cohort and sleep lost over worry. More specifically, compared with the age group 34-45 yr, de-crease in the PR for sleep complaints started in the age group 61-65 yr both in Whitehall II (PR 0.63, 95% CI 0.49-0.80) and the Finnish Public Sector study (PR 0.62, 95% CI 0.52-0.75) and continued into old age, being apparent in both age groups 66-70 yr and 71-79 yr.
Table 2—Baseline characteristics of participants who responded to
questions on sleep lost over worry both at the 1st and last study periods.
Whitehall II (n = 6,601) N (%) Finnish Public Sector study (n = 9,807) N (%) Sex Men 4,670 (71) 1,492 (15) Women 1,931 (29) 8,315 (85) Age, yr [Mean (SD)] 43.9 (5.9) 46.8 (6.9) 34-40 2,389 (36) 2,164 (22) 41-45 1,689 (26) 2,164 (22) 46-50 1,268 (19) 2,226 (23) 51-55 1,250 (19) 2,025 (21) 56-60 5 (0.08) 1,097 (11) 61-65 – 130 (1) 66-70 – 1 (0.01) Birth cohort 1931-1938 2,026 (31) 356 (4) 1939-1945 2,132 (32) 2,130 (22) 1946-1952 2,443 (37) 3,220 (33) 1953-1959 – 2,906 (29) 1960-1963 – 1,195 (12) Current smoking No 5,645 (86) 8,241 (86) Yes 918 (14) 1,389 (14)
High alcohol intake*
No 5,423 (83) 9,076 (93)
Yes 1,125 (17) 685 (7)
Low physical activity**
No 5,525 (88) 7,665 (79)
Yes 757 (12) 2,035 (21)
Obesity (BMI ≥ 30 kg/m2)
No 6,227 (94) 8,653 (90)
Yes 366 (6) 968 (10)
* > 21 units of alcoholic beverages for men, > 14 units for women. ** < 1 hr/wk of moderate physical activity and < 1 hr/wk of vigorous physical activity in the Whitehall II and ≤ 2 metabolic equivalent task (MET) hr per day in the Finnish Public Sector study. BMI, body mass index; SD, standard deviation.
SLEEP, Vol. 35, No. 11, 2012 Trajectories of Sleep Complaints—Salo et al
Analysis of period effects showed that some increase in prevalence of sleep lost over worry occurred over time in the Finnish Public Sector study. The PR was 1.07 (95% CI 1.02-1.13) in the second period and 1.26 (95% CI 1.14-1.38) in the last period compared with the first. In the Whitehall II study, the period effects were less consistent (Table 3). Results from this analysis were not materially changed after adjustment for time-dependent covariates (health behavior, obesity). In both the Whitehall II and Finnish Public Sector data, results of the main analysis remained the same when we included all base-line participants without restricting the sample to those with responses at the first and last surveys (Table S1 in Appendix). In addition, sensitivity analysis in which participants who used sleep medication were excluded generated results simi-lar to those observed in the main analysis (data not shown). Finally, associations with 4-yr incidence (rather than preva-lence) of sleep lost over worry largely replicated the main findings (Appendix).
Sex Differences in Trajectories of Sleep Lost Over Worry
In both studies, women were more likely to lose sleep over worry than men (unadjusted PR 1.52, 95% CI 1.42-1.63 in
Whitehall II and 1.17, 95% CI 1.08-1.25 in Finnish Public Sector) irrespective of adjustment for health behavior and BMI. In further analyses, the effect of age on sleep lost over worry was examined with pooled longitudinal data from both studies, separately for men and women. This stratification was supported by a statistically significant interaction between sex and age (P < 0.0001). After adjustment for study, the prev-alence of sleep lost over worry decreased with age in both sexes (Figure 3). However, throughout the age span, women had a higher prevalence of sleep lost over worry than men and the decline in prevalence rates started at a later age in women.
More specifically, in women the prevalence of sleep lost over worry of 20%-21% increased after age 34-40 yr and 41-45 yr and was at its highest at age 51 to 60 yr (PR 1.14, 95% CI 1.05-1.22 at age 51-55 yr and 1.12, 95% CI 1.04-1.21 at age 56-60 yr compared with age 34-40 yr). After the age of 60 yr, sleep complaints decreased and were stable between ages 61 to 79 yr (PRs between 0.83 and 0.85). In men age 34-40 yr, the prevalence was 14% and it remained stable until the age of 51-55 yr. Thereafter, sleep complaints decreased and remained stable between age 66-79 yr (PR at age 66-70 yr and 71-79 yr).
Figure 1—Unadjusted prevalence rates for sleep lost due to worry. Longitudinal and cross-sectional analysis of age effect in two cohorts from the United
Kingdom (Whitehall II) and Finland (Finnish Public Sector study). (A) Prevalence rates by birth cohort (Longitudinal analysis). (B) Prevalence rates by period (Cross-sectional analysis). 0 5 10 15 20 25 30 35 40 34-40 41-45 46-50 51-55 56-60 61-65 66-70 71-79 Age Pr ev al en ce ( % ) 0 5 10 15 20 25 30 35 40 34-40 41-45 46-50 51-55 56-60 61-65 66-70 71-79 Age Pr ev al en ce ( % ) 1985-1988 1987-1990 1992-1994 1997-1999 2000-2001 2002-2004 2006-2007 2007-2010 0 5 10 15 20 25 30 35 40 36-40 41-45 46-50 51-55 56-60 61-65 66-70 71-78 Age Pr ev al en ce ( % ) 0 5 10 15 20 25 30 35 40 36-40 41-45 46-50 51-55 56-60 61-65 66-70 71-78 Age Pr ev al en ce ( % ) 1997-1998 2000-2002 2004-2005 2008-2009 Whitehall II
Finnish Public Sector study
A
B
A
B
1930-1938 1939-1945 1946-1952 1931-1938 1939-1945 1946-1952 1953-1959 1960-1966SLEEP, Vol. 35, No. 11, 2012 Trajectories of Sleep Complaints—Salo et al Age-Related Trajectories of Insomnia Symptoms
In comparative analysis, we examined age-related changes in the prevalence of insomnia symptoms at least five nights per week. Insomnia symptoms were measured four times in the Whitehall II (Phases 5 and 7-9) and three times in the Finnish Public Sector study (Phases 2-4). In the Whitehall II study, in-clusion of participants with data on insomnia symptoms at least at Phases 5 and 9 yielded a sample size of 5,889 participants (71% men) age 44-68 yr at baseline. In the Finnish Public Sec-tor study, data on insomnia symptoms at least at Phases 2 and 4 were available for 27,517 participants (18% men) age 37-65 yr at baseline. In Whitehall II, prevalence of insomnia symptoms at baseline (Phase 5) was 14%, and 37% of participants report-ed insomnia symptoms at least once during the study period. Corresponding figures were 24% (baseline at Phase 2) and 45% in the Finnish Public Sector study.
Figure 2 shows an increasing unadjusted prevalence in in-somnia symptoms (at least 5 nights per week) with age in both studies. In Whitehall II, the increase was monotonic (quadratic term age*age P = 0.36) whereas in Finnish Public Sector study it was curvilinear (age*age P < 0.0001). In Whitehall II,
preva-lence increased from the age of 51 yr onward until age 71-79 yr (PR 4.08, 95% CI 1.16, 14.26) compared with participants age 34-45 yr. In the Finnish Public Sector study, prevalence was similarly higher between the ages 46-65 yr than at 34-45 yr (Table 3). In both studies, prevalence was higher in women than men and in all subsequent periods compared to baseline (Whitehall II: Phase 5 in 1997-1999; Finnish Public Sector: Phase 2 in 2000-2002). Insomnia symptoms were less common in the younger birth cohorts (1946-1952 in Whitehall II; 1953-1959 and 1960-1963 in the Finnish Public Sector) compared with those born before World War II in 1930-1938. Repeating the analyses with a lower cut-point for the outcome definition (insomnia symptoms at least 2 nights per week) replicated the results regarding effects of sex, period, and birth cohort, but not the effect of age (data not shown). The findings on age and 4-yr incidence (rather than prevalence) of insomnia symptoms did not materially differ from the main analyses (Appendix).
DISCUSSION
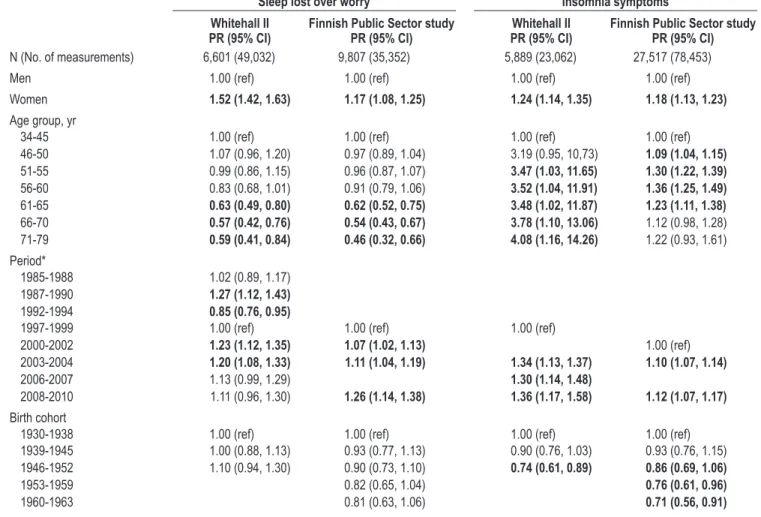
We described trajectories of sleep lost over worry across the adult life course in cohorts from the United Kingdom and Fin-Table 3—The age, period, and cohort effect in relation to sleep lost over worry and insomnia symptoms in the United Kingdom (Whitehall II) and Finland
(Finnish Public Sector study).
Sleep lost over worry Insomnia symptoms Whitehall II
PR (95% CI) Finnish Public Sector studyPR (95% CI) PR (95% CI)Whitehall II Finnish Public Sector studyPR (95% CI)
N (No. of measurements) 6,601 (49,032) 9,807 (35,352) 5,889 (23,062) 27,517 (78,453)
Men 1.00 (ref) 1.00 (ref) 1.00 (ref) 1.00 (ref)
Women 1.52 (1.42, 1.63) 1.17 (1.08, 1.25) 1.24 (1.14, 1.35) 1.18 (1.13, 1.23)
Age group, yr
34-45 1.00 (ref) 1.00 (ref) 1.00 (ref) 1.00 (ref)
46-50 1.07 (0.96, 1.20) 0.97 (0.89, 1.04) 3.19 (0.95, 10,73) 1.09 (1.04, 1.15) 51-55 0.99 (0.86, 1.15) 0.96 (0.87, 1.07) 3.47 (1.03, 11.65) 1.30 (1.22, 1.39) 56-60 0.83 (0.68, 1.01) 0.91 (0.79, 1.06) 3.52 (1.04, 11.91) 1.36 (1.25, 1.49) 61-65 0.63 (0.49, 0.80) 0.62 (0.52, 0.75) 3.48 (1.02, 11.87) 1.23 (1.11, 1.38) 66-70 0.57 (0.42, 0.76) 0.54 (0.43, 0.67) 3.78 (1.10, 13.06) 1.12 (0.98, 1.28) 71-79 0.59 (0.41, 0.84) 0.46 (0.32, 0.66) 4.08 (1.16, 14.26) 1.22 (0.93, 1.61) Period* 1985-1988 1.02 (0.89, 1.17) 1987-1990 1.27 (1.12, 1.43) 1992-1994 0.85 (0.76, 0.95)
1997-1999 1.00 (ref) 1.00 (ref) 1.00 (ref)
2000-2002 1.23 (1.12, 1.35) 1.07 (1.02, 1.13) 1.00 (ref)
2003-2004 1.20 (1.08, 1.33) 1.11 (1.04, 1.19) 1.34 (1.13, 1.37) 1.10 (1.07, 1.14)
2006-2007 1.13 (0.99, 1.29) 1.30 (1.14, 1.48)
2008-2010 1.11 (0.96, 1.30) 1.26 (1.14, 1.38) 1.36 (1.17, 1.58) 1.12 (1.07, 1.17)
Birth cohort
1930-1938 1.00 (ref) 1.00 (ref) 1.00 (ref) 1.00 (ref)
1939-1945 1.00 (0.88, 1.13) 0.93 (0.77, 1.13) 0.90 (0.76, 1.03) 0.93 (0.76, 1.15)
1946-1952 1.10 (0.94, 1.30) 0.90 (0.73, 1.10) 0.74 (0.61, 0.89) 0.86 (0.69, 1.06)
1953-1959 0.82 (0.65, 1.04) 0.76 (0.61, 0.96)
1960-1963 0.81 (0.63, 1.06) 0.71 (0.56, 0.91)
Unadjusted prevalence ratios (PR) and their 95% confidence intervals (CI) were derived from repeated-measures log-binomial regression analysis with the generalized estimating equations (GEE) method. The main effects of sex, age, period, and birth cohort were included in the model. *Exact periods were as follows: Whitehall II: 1985-1988, 1987-1990, 1992-1994, 1999, 2000-2001, 2003-2004, 2006-2007, and 2008-2010. Finnish Public Sector study: 1997-1998, 2000-2002, 2004-2005, and 2008-2009.
SLEEP, Vol. 35, No. 11, 2012 Trajectories of Sleep Complaints—Salo et al
land and found three age-related phases: (1) a period character-ized by a high prevalence of sleep complaints between the ages 34 and 55 yr followed by (2) a declining trajectory between age 56 and 65 yr that (3) leveled off in early old age. This general pattern was observable across both cohorts and in both sexes, although in men the prevalence of sleep lost over worry was lower and the decline therein began earlier than in women. For insomnia symptoms, the prevalence increased with age in both cohorts. The age-related trajectory observed was unlikely to be attributable to confounding by cohort or period effects as our analyses took into account birth yr and calendar period of mea-surement.
The key strengths of this study are: the use of individual-level longitudinal data, frequent repeat measurements, and formal longitudinal modeling to describe the trajectories. As far as we are aware, this study is the first to describe the evo-lution of sleep complaints due to worry as a function of age from early midlife to old age. In the literature, there is sub-stantial heterogeneity in operationalization of sleep problems. Although many studies have assessed insomnia symptoms corresponding to the DSM-criteria,10-17,19,37 other studies have measured sleep dissatisfaction or sleep quality in general.1,6-9 Our results regarding frequent insomnia symptoms (at least 5 nights per wk) support the cross-sectional10-17 and longitudinal
evidence37 on age-related increases in prevalence. However, an additional analysis using a lower cut-point for the insomnia symptoms (at least 2 nights per week) showed that prevalence of less severe insomnia symptoms do not change with age. Our Figure 2—Unadjusted prevalence rates for insomnia symptoms (difficulties initiating or maintaining sleep, too early morning awakening, or nonrefreshing
sleep) measured with the Jenkins Sleep Problem Scale (problems at least 5 nights per week). Longitudinal and cross-sectional analysis of age effect in cohorts from the United Kingdom (Whitehall II) and Finland (Finnish Public Sector study). (A) Prevalence rates by birth cohort (Longitudinal analysis).
(B) Prevalence rates by period (Cross-sectional analysis). 0 5 10 15 20 25 30 41-50 51-55 56-60 61-65 66-70 71-79 Age Pr ev al en ce ( % ) 0 5 10 15 20 25 30 41-50 51-55 56-60 61-65 66-70 71-79 Age Pr ev al en ce ( % ) 0 5 10 15 20 25 30 35 36-40 41-45 46-50 51-55 56-60 61-65 66-70 71-78 Age Pr ev al en ce ( % ) 1930-1938 1939-1945 1946-1952 1953-1959 1960-1966 0 5 10 15 20 25 30 35 36-40 41-45 46-50 51-55 56-60 61-65 66-70 71-78 Age Pr ev al en ce ( % ) 2000-2002 2004-2005 2008-2009 Whitehall II
Finnish Public Sector study
A
B
A
B
1930-1938 1939-1945 1946-1952 1997-1999 2002-2004 2006-2007 2007-2010Figure 3—Unadjusted prevalence rates for sleep lost due to worry
stratified by sex, pooled data from two cohorts from the United Kingdom (Whitehall II) and Finland (Finnish Public Sector study).
0 5 10 15 20 25 30 35 34-40 41-45 46-50 51-55 56-60 61-65 66-70 71-79 Age Pr ev al en ce ( % ) Men Women
SLEEP, Vol. 35, No. 11, 2012 Trajectories of Sleep Complaints—Salo et al
study also provides unique information regarding decrease in sleep complaints due to worry. These results, further supported by the statistically significant quadratic age term, address the questions of nonlinear associations between sleep problems and aging raised by Grandner et al.1
Reasons for the declining trajectories in sleep lost over worry are still unknown, but may be partly explained by life transitions (such as retirement) that might affect sleep lost over work-related worries in particular. Previous studies suggest that retirement is associated with favorable changes in self-reported sleep complaints,43 mental well-being,44 use of antidepressant medication,45 mental and physical fatigue,46 and perceived health, despite no concurrent improvement in physical health problems or incidence of chronic conditions.44,46,47 In younger age groups, in particular, sleep complaints have also been found to be related to psychosocial stressors, such as being separated, divorced, or widowed,48 whereas somatic comorbidities and pain may be more common correlates of sleep disturbances at older age.48-50 Although nighttime sleep duration may decrease with age,51 this is not necessarily associated with poorer subjec-tive sleep quality52 because lost nighttime sleep in the elderly may be compensated with daytime napping more readily than in younger age groups.53
Our findings are in agreement with previous studies on secular trends in sleep complaints. We observed some in-crease in prevalence of sleep complaints across time periods in both study cohorts, but only in the Finnish Public Sector study was the increase continuous. Although previous stud-ies exploring historical changes in the prevalence of various types of sleep complaint have not always used multiple re-peated measurements over time, their results have also sug-gested increasing trends in recent times54-56 and attributed this to increasing work stress as a consequence of changes that have taken place in working life,54,57 or increased information regarding sleep and its disorders that may have raised aware-ness in laymen.55
We observed higher overall prevalence of both sleep lost over worry and frequent insomnia symptoms (at least 5 nights per week) in women than men, confirming findings from a number of previous studies.6-17,19,20,37,48,58,59 The later start of the declining trajectory in sleep complaints in women may be ex-plained by climacteric symptoms60,61 or distressing life events, such as children leaving home, which often coincide with the menopausal transition.62 The different distribution by sex in the two cohorts may also explain differences in the shape of the insomnia trajectories between the two cohorts. In the Whitehall II study, 67% of participants were men, whereas the Finnish Public Sector study is female dominated (15% males).
Our results have some limitations. These analyses are de-scriptive and not designed to assess the degree to which the ob-served changes are natural features of aging or a consequence of the dynamic aggregate of lifetime exposures. Adjusting the main analyses for time-dependent covariates, health behav-ior, and BMI did not materially change the results, but further research that includes a wider range of confounders poten-tially affecting these sleep complaints trajectories is needed. The use of the GEE method presupposes missing data to be missing at random. Because we included in the main analy-sis only participants who responded to both the first and last
study phases, it is likely that missing data between the two measurement points met this assumption. However, the cohort did not fully represent the baseline population because drop-out during the follow-up period was more common among participants with a worse health risk profile. It might be as-sumed that the observed trajectories underestimate change in the trajectory for sleep lost over worry because those more likely to survive will be the most healthy and least affected by risk factors common to both premature mortality and sleep disturbances.63-67 However, a subsidiary analysis including all baseline participants irrespective of their response to the last phase suggest that any bias is small, although this should be interpreted cautiously as the missing-at-random assumption was probably not fully met in these analyses. Furthermore, given the known differences in working and nonworking pop-ulations in terms of socioeconomic circumstances and health, both of which have the potential to modify sleep trajectories, our results from occupational cohorts may not be directly gen-eralizable to the general population.
In conclusion, evidence from two large cohorts from differ-ent countries shows that sleep lost over worry is less prevaldiffer-ent among older than younger adults. These results are in striking contrast to the age-related increase in insomnia symptoms ob-served in this study and reported previously in other studies. Sleep lost over worry has been recognized as a risk factor for morbidity, for example, cardiovascular diseases,21,22 and mortal-ity,22 and is thus of clinical importance. Our results suggest it is important that general practitioners pay more attention to sleep complaints in people of working age. Further research should identify key determinants of these trajectories in sleep com-plaints and thereby opportunities for intervention.
ACKNOWLEDGMENTS
The authors thank all participating civil service departments and their welfare personnel and establishment officers; the Occu-pational Health and Safety Agency; the Council of Civil Service Unions; all participating civil servants in the Whitehall II study; and all members of the Whitehall II Study Team. The Whitehall II Study Team comprises research scientists, statisticians, study coordinators, nurses, data managers, administrative assistants, and data entry staff who make the study possible. The authors also thank all participants of the Finnish Public Sector study. The Finnish Public Sector study was supported by the Academy of Finland (projects 124271, 124322, 129262, and 132944), the New OSH ERA research program. The Whitehall II study is supported by the UK Medical Research Council, the British Heart Foun-dation, the NIH/National Institute on Aging (R01AG013196, R01AG034454) and the National Heart, Lung, and Blood Insti-tute (R01HL036310), USA, and the BUPA Foundation, UK. Dr. Shipley is supported by a grant from the British Heart Founda-tion. The sponsors had no role in designing the study, analyzing or interpreting the data, or preparing the manuscript.
DISCLOSURE STATEMENT
This was not an industry supported study. Dr. Salo has finan-cial interest in a small private sleep clinic in Turku, Finland. Dr. Dauvilliers has consulted for UCB Pharma, Cephalon, and Bioprojet. The other authors have indicated no financial con-flicts of interest.
SLEEP, Vol. 35, No. 11, 2012 Trajectories of Sleep Complaints—Salo et al REFERENCES
1. Grandner MA, Martin JL, Patel NP, et al. Age and sleep disturbances among American men and women: It’s more complicated than we thought. Sleep 2012;35:395-406.
2. Cajochen C, Munch M, Knoblauch V, Blatter K, Wirz-Justice A. Age-re-lated changes in the circadian and homeostatic regulation of human sleep. Chronobiol Int 2006;23:461-74.
3. Roepke SK, Ancoli-Israel S. Sleep disorders in the elderly. Indian J Med Res 2010;131:302-10.
4. Crimmins EM. Trends in the health of the elderly. Annu Rev Public Health 2004;25:79-98.
5. Åkerstedt T, Hume K, Minors D, Waterhouse J. The meaning of good sleep: a longitudinal study of polysomnography and subjective sleep qual-ity. J Sleep Res 1994;3:152-8.
6. Quera-Salva MA, Orluc A, Goldenberg F, Guilleminault C. Insomnia and use of hypnotics: study of a French population. Sleep 1991;14:386-91. 7. Ohayon MM, Zulley J. Correlates of global sleep dissatisfaction in the
German population. Sleep 2001;24:780-7.
8. Pallesen S, Nordhus IH, Nielsen GH, Havik OE, Kvale G, Johnsen BH, et al. Prevalence of insomnia in the adult Norwegian population. Sleep 2001;24:771-9.
9. Bittencourt LR, Santos-Silva R, Taddei JA, Andersen ML, de Mello MT, Tufik S. Sleep complaints in the adult Brazilian population: a national survey based on screening questions. J Clin Sleep Med 2009;5:459-63. 10. Klink M, Quan SF. Prevalence of reported sleep disturbances in a general
adult population and their relationship to obstructive airways diseases. Chest 1987;91:540-6.
11. Leger D, Guilleminault C, Dreyfus JP, Delahaye C, Paillard M. Preva-lence of insomnia in a survey of 12,778 adults in France. J Sleep Res 2000;9:35-42.
12. Sivertsen B, Krokstad S, Overland S, Mykletun A. The epidemiology of insomnia: associations with physical and mental health: the HUNT-2 study. J Psychosom Res 2009;67:109-16.
13. Ohayon MM, Bader G. Prevalence and correlates of insomnia in the Swedish population aged 19-75 years. Sleep Med 2010;11:980-6. 14. Ohayon MM, Paiva T. Global sleep dissatisfaction for the assessment
of insomnia severity in the general population of Portugal. Sleep Med 2005;6:435-41.
15. Hartz AJ, Daly JM, Kohatsu ND, Stromquist AM, Jogerst GJ, Kukoyi OA. Risk factors for insomnia in a rural population. Ann Epidemiol 2007;17:940-7.
16. Li RH, Wing YK, Ho SC, Fong SY. Gender differences in insom-nia: a study in the Hong Kong Chinese population. J Psychosom Res 2002;53:601-9.
17. Roberts RE, Shema SJ, Kaplan GA. Prospective data on sleep com-plaints and associated risk factors in an older cohort. Psychosom Med 1999;61:188-96.
18. Morin CM, LeBlanc M, Daley M, Gregoire JP, Merette C. Epidemiology of insomnia: prevalence, self-help treatments, consultations, and determi-nants of help-seeking behaviors. Sleep Med 2006;7:123-30.
19. Ohayon MM, Sagales T. Prevalence of insomnia and sleep characteristics in the general population of Spain. Sleep Med 2010;11:1010-8.
20. Jaussent I, Dauvilliers Y, Ancelin ML, et al. Insomnia symptoms in older adults: associated factors and gender differences. Am J Geriatr Psychiatry 2011;19:88-97.
21. Chandola T, Ferrie JE, Perski A, Akbaraly T, Marmot MG. The effect of short sleep duration on coronary heart disease risk is greatest among those with sleep disturbance: a prospective study from the Whitehall II cohort. Sleep 2010;33:739-44.
22. Hamer M, Batty GD, Kivimäki M. Sleep loss due to worry and future risk of cardiovascular disease and all-cause mortality: the Scottish Health Survey. Eur J Cardiovasc Prev Rehabil 2011 Oct 3, Epub ahead of print. 23. Crum RM, Storr CL, Chan YF, Ford DE. Sleep disturbance and risk for
alcohol-related problems. Am J Psychiatry 2004;161:1197-203. 24. Jenkins CD, Stanton BA, Niemcryk SJ, Rose RM. A scale for the estimation
of sleep problems in clinical research. J Clin Epidemiol 1988;41:313-21. 25. Lallukka T, Dregan A, Armstrong D. Comparison of a sleep item from the
General Health Questionnaire-12 with the Jenkins Sleep Questionnaire as measures of sleep disturbance. J Epidemiol 2011;21:474-80.
26. Dinges DF, Pack F, Williams K, Gillen KA, Powell JW, Ott GE, et al. Cumulative sleepiness, mood disturbance, and psychomotor vigilance performance decrements during a week of sleep restricted to 4-5 hours per night. Sleep 1997;20:267-77.
27. Van Dongen HP, Maislin G, Mullington JM, Dinges DF. The cumulative cost of additional wakefulness: dose-response effects on neurobehavioral functions and sleep physiology from chronic sleep restriction and total sleep deprivation. Sleep 2003;26:117-26.
28. Ogawa Y, Kanbayashi T, Saito Y, Takahashi Y, Kitajima T, Takahashi K, et al. Total sleep deprivation elevates blood pressure through arterial baroreflex resetting: a study with microneurographic technique. Sleep 2003;26:986-9.
29. Lac G, Chamoux A. Elevated salivary cortisol levels as a result of sleep de-privation in a shift worker. Occup Med (Oxford, England) 2003;53:143-5. 30. Spiegel K, Knutson K, Leproult R, Tasali E, Van Cauter E. Sleep loss: a
novel risk factor for insulin resistance and type 2 diabetes. J Appl Physiol 2005;99:2008-19.
31. Brown WD. Insomnia: prevalence and daytime consequences. In: Lee-Chiong T, ed. Sleep: a comprehensive handbook (pp 91-08). Hoboken, NJ: John Wiley & Sons, 2005.
32. Edinger JD, Means MK. Overview of insomnia: Definitions, epidemiol-ogy, differential diagnosis, and assessment. In: Kryger MH, Roth T, De-ment WC, eds. Principles and practice of sleep medicine. 4th ed. Philadel-phia: Elsevier Saunders, 2005:702-13.
33. Marmot M, Brunner E. Cohort profile: the Whitehall II study. Int J Epi-demiol 2005;34:251-6.
34. Kivimäki M, Lawlor DA, Davey Smith G, Kouvonen A, Virtanen M, Elovainio M, et al. Socioeconomic position, co-occurrence of behavior-related risk factors, and coronary heart disease: the Finnish Public Sector study. Am J Public Health 2007;97:874-9.
35. Goldberg DP, Gater R, Sartorius N, Ustun TB, Piccinelli M, Gureje O, et al. The validity of two versions of the GHQ in the WHO study of mental illness in general health care. Psychol Med 1997;27:191-7.
36. Holi MM, Marttunen M, Aalberg V. Comparison of the GHQ-36, the GHQ-12 and the SCL-90 as psychiatric screening instruments in the Finn-ish population. Nord J Psychiatry 2003;57:233-8.
37. Ribet C, Derriennic F. Age, working conditions, and sleep disorders: a lon-gitudinal analysis in the French cohort E.S.T.E.V. Sleep 1999;22:491-504. 38. NHS Choices: The risks of drinking too much. National Health Service
(NHS), United Kingdom. 2009. http://www.nhs.uk/Livewell/alcohol/ Pages/Effectsofalcohol.aspx. Accessed May 8, 2012.
39. Kujala UM, Kaprio J, Sarna S, Koskenvuo M. Relationship of leisure-time physical activity and mortality: the Finnish twin cohort. JAMA 1998;279:440-4.
40. Spiegelman D, Hertzmark E. Easy SAS calculations for risk or prevalence ratios and differences. Am J Epidemiol 2005;162:199-200.
41. Lipsitz SR, Kim K, Zhao L. Analysis of repeated categorical data using generalized estimating equations. Stat Med 1994;13:1149-63.
42. WHO Collaborating Centre for Drug Statistics Methodology. Guidelines for ATC classification and DDD assignment. Oslo, Norway: World Health Organization Collaborating Centre for Drug Statistics, 2004.
43. Vahtera J, Westerlund H, Hall M, et al. Effect of retirement on sleep dis-turbances: the GAZEL prospective cohort study. Sleep 2009;32:1459-66. 44. Jokela M, Ferrie JE, Gimeno D, et al. From midlife to early old age: health
trajectories associated with retirement. Epidemiology 2010;21:284-90. 45. Oksanen T, Vahtera J, Westerlund H, et al. Is retirement beneficial for
mental health? Longitudinal analysis of antidepressant use before and af-ter retirement. Epidemiology 2011;22:553-9.
46. Westerlund H, Vahtera J, Ferrie JE, et al. Effect of retirement on ma-jor chronic conditions and fatigue: French GAZEL occupational cohort study. BMJ 2010;341:c6149.
47. Westerlund H, Kivimäki M, Singh-Manoux A, et al. Self-rated health before and after retirement in France (GAZEL): a cohort study. Lancet 2009;374:1889-96.
48. Stewart R, Besset A, Bebbington P, et al. Insomnia comorbidity and im-pact and hypnotic use by age group in a national survey population aged 16 to 74 years. Sleep 2006;29:1391-7.
49. Foley D, Ancoli-Israel S, Britz P, Walsh J. Sleep disturbances and chronic disease in older adults: results of the 2003 National Sleep Foundation Sleep in America Survey. J Psychosom Res 2004;56:497-502.
50. Vitiello MV, Moe KE, Prinz PN. Sleep complaints cosegregate with ill-ness in older adults: clinical research informed by and informing epide-miological studies of sleep. J Psychosom Res 2002;53:555-9.
51. Ohayon MM, Carskadon MA, Guilleminault C, Vitiello MV. Meta-analy-sis of quantitative sleep parameters from childhood to old age in healthy individuals: developing normative sleep values across the human lifes-pan. Sleep 2004;27:1255-73.
SLEEP, Vol. 35, No. 11, 2012 Trajectories of Sleep Complaints—Salo et al
52. Buysse DJ, Hall ML, Strollo PJ, et al. Relationships between the Pitts-burgh Sleep Quality Index (PSQI), Epworth Sleepiness Scale (ESS), and clinical/polysomnographic measures in a community sample. J Clin Sleep Med 2008;4:563-71.
53. Ohayon MM, Zulley J, Guilleminault C, Smirne S, Priest RG. How age and daytime activities are related to insomnia in the general population: consequences for older people. J Am Geriatr Soc 2001;49:360-6. 54. Kronholm E, Partonen T, Laatikainen T, et al. Trends in self-reported
sleep duration and insomnia-related symptoms in Finland from 1972 to 2005: a comparative review and re-analysis of Finnish population sam-ples. J Sleep Res 2008;17:54-62.
55. Santos-Silva R, Bittencourt LR, Pires ML, et al. Increasing trends of sleep complaints in the city of Sao Paulo, Brazil. Sleep Med 2010;11:520-4. 56. Westerlund H, Alexanderson K, Akerstedt T, Magnusson Hanson L,
Theo-rell T, Kivimaki M. Work-related sleep disturbances and sickness absence in the Swedish working population, 1993-1999. Sleep 2008;31:1169-77. 57. Åkerstedt T, Knutsson A, Westerholm P, Theorell T, Alfredsson L,
Keck-lund G. Sleep disturbances, work stress and work hours: a cross-sectional study. J Psychosom Res 2002;53:741-8.
58. Zhang B, Wing YK. Sex differences in insomnia: a meta-analysis. Sleep 2006;29:85-93.
59. Bixler EO, Vgontzas AN, Lin HM, Vela-Bueno A, Kales A. Insomnia in central Pennsylvania. J Psychosom Res 2002;53:589-92.
60. Kravitz HM, Ganz PA, Bromberger J, Powell LH, Sutton-Tyrrell K, Mey-er PM. Sleep difficulty in women at midlife: a community survey of sleep and the menopausal transition. Menopause 2003;10:19-28.
61. Rödström K, Bengtsson C, Lissner L, Milsom I, Sundh V, Björkelund C. A longitudinal study of the treatment of hot flushes: the population study of women in Gothenburg during a quarter of a century. Menopause 2002;9:156-61.
62. Lindh-Astrand L, Hoffmann M, Hammar M, Kjellgren KI. Women’s conception of the menopausal transition: a qualitative study. J Clin Nurs 2007;16:509-17.
63. Mallon L, Broman JE, Hetta J. Sleep complaints predict coronary artery disease mortality in males: a 12-year follow-up study of a middle-aged Swedish population. J Intern Med 2002;251:207-16.
64. Phillips B, Mannino DM. Do insomnia complaints cause hypertension or cardiovascular disease? J Clin Sleep Med 2007;3:489-94.
65. Ford DE, Kamerow DB. Epidemiologic study of sleep disturbanc-es and psychiatric disorders: an opportunity for prevention? JAMA 1989;262:1479-84.
66. Szklo-Coxe M, Young T, Peppard PE, Finn LA, Benca RM. Prospective associations of insomnia markers and symptoms with depression. Am J Epidemiol 2010;171:709-20.
67. Baglioni C, Spiegelhalder K, Lombardo C, Riemann D. Sleep and emo-tions: a focus on insomnia. Sleep Med Rev 2010;14:227-38.
SLEEP, Vol. 35, No. 11, 2012 Trajectories of Sleep Complaints—Salo et al
APPENDIX
Table S1—The age, period, and cohort effects in relation to sleep lost over worry in the analytic sample and among all baseline participants Whitehall II Finnish Public Sector study Response required both
at the 1st and last period PR (95% CI)
Response required only
at the 1st period
PR (95% CI)
Response required both
at the 1st and last period
PR (95% CI)
Response required only
at the 1st period
PR (95% CI)
All
Men 1.00 (ref) 1.00 (ref) 1.00 (ref) 1.00 (ref)
Women 1.52 (1.42, 1.63) 1.46 (1.38, 1.55) 1.17 (1.08, 1.25) 1.11 (1.04, 1.18)
Age group, yr
34-45 1.00 (ref) 1.00 (ref) 1.00 (ref) 1.00 (ref)
46-50 1.07 (0.96, 1.20) 1.05 (0.96, 1.15) 0.97 (0.89, 1.04) 0.95 (0.89, 1.02) 51-55 0.99 (0.86, 1.15) 0.95 (0.84, 1.08) 0.96 (0.87, 1.07) 0.95 (0.86, 1.05) 56-60 0.83 (0.68, 1.01) 0.81 (0.69, 0.96) 0.91 (0.79, 1.06) 0.91 (0.80, 1.04) 61-65 0.63 (0.49, 0.80) 0.61 (0.50, 0.76) 0.62 (0.52, 0.75) 0.63 (0.54, 0.75) 66-70 0.57 (0.42, 0.76) 0.57 (0.44, 0.74) 0.54 (0.43, 0.67) 0.52 (0.42, 0.64) 71-79 0.59 (0.41, 0.84) 0.58 (0.42, 0.78) 0.46 (0.32, 0.66) 0.44 (0.31, 0.62) Period* 1985-1988 1.02 (0.89, 1.17) 0.98 (0.87, 1.11) 1987-1990 1.27 (1.12, 1.43) 1.22 (1.10, 1.35) 1992-1994 0.85 (0.76, 0.95) 0.84 (0.76, 0.93)
1997-1999 1.00 (ref) 1.00 (ref) 1.00 (ref) 1.00 (ref)
2000-2002 1.23 (1.12, 1.35) 1.27 (1.16, 1.38) 1.07 (1.02, 1.13) 1.06 (1.01, 1.11)
2003-2004 1.20 (1.08, 1.33) 1.20 (1.09, 1.32) 1.11 (1.04, 1.19) 1.13 (1.06, 1.20)
2006-2007 1.13 (0.99, 1.29) 1.13 (0.99, 1.25)
2008-2010 1.11 (0.96, 1.30) 1.09 (0.95, 1.25) 1.26 (1.14, 1.38) 1.25 (1.15, 1.36)
Birth cohort
1930-1938 1.00 (ref) 1.00 (ref) 1.00 (ref) 1.00 (ref)
1939-1945 1.00 (0.88, 1.13) 0.99 (0.89, 1.10) 0.93 (0.77, 1.13) 0.93 (0.79, 1.09)
1946-1952 1.10 (0.94, 1.30) 1.10 (0.95, 1.26) 0.90 (0.73, 1.10) 0.87 (0.73, 1.04)
1953-1959 0.82 (0.65, 1.04) 0.82 (0.66, 1.01)
1960-1963 0.81 (0.63, 1.06) 0.79 (0.63, 1.00)
CI, confidence interval; PR, prevalence ratio.
Analysis of the Incidence of Sleep Lost Over Worry
We analyzed 4-yr incidence of sleep lost over worry and found that incidence at the 2nd study period (1987-1990 in the Whitehall II and 2000-2002 in the Finnish Public Sector study) was 15% in the Whitehall II and 23% in the Finnish Public Sector study. In both studies, incidence was higher among women than men (Whitehall II: unadjusted incidence rate, IR 1.44, 95% CI 1.34-1.56; Finnish Public Sector: IR 1.30, 95% CI 1.17-1.45). In Whitehall II (n = 6,501, number of measure-ments 34,531) incidence was higher among participants age 46-50 yr compared with those age 34-45 yr (IR 1.22, 95% CI 1.04-1.42). No consistent pattern was observed for study pe-riod. Compared with Phase 5 (yr 1997-1999), incidence was higher at Phase 2 (1987-1990: IR 1.33, 95% CI 1.14-1.56) and Phase 6 (2000-2002: IR 1.17, 95% CI 1.03-1.33), but lower at Phase 3 (1992-1994: IR 0.80, 95% CI 0.69-0.94). In the Finn-ish Public Sector study (n = 8,410, number of measurements 17,327), the incidence of sleep lost over worry was lower among those age 56-60 yr (IR 0.78, 95% CI 0.62-0.98), 61-65 yr (IR 0.55, 95% CI 0.41-0.73), and 66-70 yr (IR 0.49, 95% CI 0.35-0.70) compared with participants age 34-45 yr. The
incidence was higher in Phase 4 (2008-2009) compared with Phase 2 (2000-2002). There was no difference between birth cohorts in either study.
Analysis of Incident Insomnia Symptoms
At the 2nd study period (2003-2004 in the Whitehall II and 2004-2005 in the Finnish Public Sector study), incidence of insomnia symptoms was 13% in the Whitehall II and 17% in the Finnish Public Sector study. Four-yr incidence of insom-nia symptoms was higher in women than men in both stud-ies (Whitehall II: IR 1.15, 95% CI 1.03-1.28; Finnish Public Sector: IR 1.27, 95% CI 1.19-1.36). In Whitehall II (n = 5437, number of measurements 13,730) compared with Phase 7 (yr 2003-2004, earliest period available for analysis of incidence), incidence of insomnia symptoms was lower at Phase 8 (2006-2007: IR 0.85, 95% CI 0.75-0.97) and Phase 9 (2008-2010: IR 0.83, 95% CI 0.72-0.97), but there were no differences between older age groups compared with participants age 46-55 yr (the youngest age groups available in 2003-2004) or between birth cohorts (data not shown). In the Finnish Public Sector study (n = 20,105, number of measurements 34,912), incidence of
SLEEP, Vol. 35, No. 11, 2012 Trajectories of Sleep Complaints—Salo et al
insomnia symptoms was higher at age 46-50 yr (IR 1.15, 95% CI 1.02-1.29) compared with age 34-45 yr and was at its high-est at age 56-60 yr (IR 1.50, 95% CI 1.25-1.81). Increase in incidence at age 66-70 yr (IR 1.29, 95% CI 1.00-1.68) and age
71-79 yr (IR 1.68, 95% CI 0.90-3.13) compared with age 34-45 yr did not reach statistical significance. There were no effects of period or birth cohort on incidence of insomnia symptoms in the Finnish Public Sector study.