Publisher’s version / Version de l'éditeur:
Supplemental Proceedings: Materials Fabrication, Properties, Characterization, and Modeling, 2, 2011-04-19
READ THESE TERMS AND CONDITIONS CAREFULLY BEFORE USING THIS WEBSITE. https://nrc-publications.canada.ca/eng/copyright
Vous avez des questions? Nous pouvons vous aider. Pour communiquer directement avec un auteur, consultez la
première page de la revue dans laquelle son article a été publié afin de trouver ses coordonnées. Si vous n’arrivez pas à les repérer, communiquez avec nous à PublicationsArchive-ArchivesPublications@nrc-cnrc.gc.ca.
Questions? Contact the NRC Publications Archive team at
PublicationsArchive-ArchivesPublications@nrc-cnrc.gc.ca. If you wish to email the authors directly, please see the first page of the publication for their contact information.
NRC Publications Archive
Archives des publications du CNRC
This publication could be one of several versions: author’s original, accepted manuscript or the publisher’s version. / La version de cette publication peut être l’une des suivantes : la version prépublication de l’auteur, la version acceptée du manuscrit ou la version de l’éditeur.
For the publisher’s version, please access the DOI link below./ Pour consulter la version de l’éditeur, utilisez le lien DOI ci-dessous.
https://doi.org/10.1002/9781118062142.ch35
Access and use of this website and the material on it are subject to the Terms and Conditions set forth at
Solidification analysis of Al-Si alloys modified with addition of Cu using in-situ neutron diffraction
Sediako, D.; Kasprzak, W.; Swainson, I.; Garlea, O.
https://publications-cnrc.canada.ca/fra/droits
L’accès à ce site Web et l’utilisation de son contenu sont assujettis aux conditions présentées dans le site LISEZ CES CONDITIONS ATTENTIVEMENT AVANT D’UTILISER CE SITE WEB.
NRC Publications Record / Notice d'Archives des publications de CNRC: https://nrc-publications.canada.ca/eng/view/object/?id=0ad98256-25e8-4737-9211-b07e2d20b5e9 https://publications-cnrc.canada.ca/fra/voir/objet/?id=0ad98256-25e8-4737-9211-b07e2d20b5e9
SOLIDIFICATION ANALYSIS OF Al-Si ALLOYS MODIFIED WITH
ADDITION OF Cu USING IN-SITU NEUTRON DIFFRACTION
D. Sediako1,W. Kasprzak2, I. Swainson1, and O. Garlea3
1
National Research Council, Canadian Neutron Beam Centre Chalk River, ON, Canada
2
Canmet-MTL, Natural Resources Canada Ottawa, ON, Canada
3
Oak Ridge National Laboratories, Oak Ridge, TN, USA
Keywords: hypereutectic aluminum alloy, solidification, neutron diffraction, phase evolution, thermal analysis
Abstract
The potential of application of in-situ neutron diffraction for studies of solidification of Al alloys have been previously reported by the authors for the binary hypereutectic A-Si system. This illustrated the potential of neutron diffraction for high resolution melt analysis at near-liquidus temperatures required for advanced studies of grain refining, eutectic modification, etc. The solid and liquid volume fractions were determined based on the change of intensity of neutron diffraction peaks over the solidification interval. The path of non-equilibrium solidification for the alloy modified with addition of copper and magnesium is very complex. Phase diagrams and FactSage-based computations give only approximate kinetics of solid phase(s) evolution during cooling and solidification. On the other hand, in-situ neutron diffraction, coupled with the results of thermal analysis, provides non-biased experimental data on phase evolution; for example, on formation of FCC Al-Cu-Si and diamond silicon during solidification of hypereutectic Al-Si-Cu alloy.
Introduction
Nowadays, hypereutectic Al-Si alloys are used extensively for automotive applications. For example, cast components that experience service conditions of high temperature and load, such as engine blocks, are now routinely produced using the Al-Si alloys [1-6]. It is understood that as-cast microstructure of the material is much dependent on melt processing in casting operations. Molten metal pouring temperature and cooling rate (hence, solidification rate), for example, determines size and distribution of primary Si particles, as well as crystallographic characteristics of the Al-Si eutectic [7-9]. All these in many ways determine in-service properties of the cast components.
Multiple studies were performed on solidification behaviour of these alloys and resulted microstructure of the cast material. In published reports [3-5, 10] thermal analysis was applied for evaluation of solidification kinetics during the non-equilibrium and near-equilibrium conditions. Various attempts have also been undertaken to characterize the
solidification process using methods other than thermal analysis. Several attempts have been reported on application of neutron diffraction for solidification studies [8-12]. Most recently, W. Kasprzak, D. Sediako et al., [8, 9] demonstrated the applicability of neutron diffraction to solidification analysis of a binary hypereutectic Al-19%Si alloy using step-wise cooling. Beside qualitative analysis, the authors showed the potential to quantify the volume fraction of primary Si and Al as well as Si in the eutectic phase using diffraction signals from liquid and solid phases as they evolved during solidification. The main focus of this research is to continue the neutron diffraction studies on a hypereutectic Al-19%Si alloy modified with addition of 3% Cu. The particular interest of this analysis is the effect of Cu addition on the non-equilibrium solidification path of the Al-Si-Cu alloy, as compared to results reported earlier on the binary Al-Si system [8, 9].
Phase Evolution During Solidification of Al-Si-3wt.%Cu Alloy
FactSageTM Calculations
The first approach in this study was phase evolution analysis with application of the FactSage software. Some results of these calculations are presented in Figures 1 to 3.
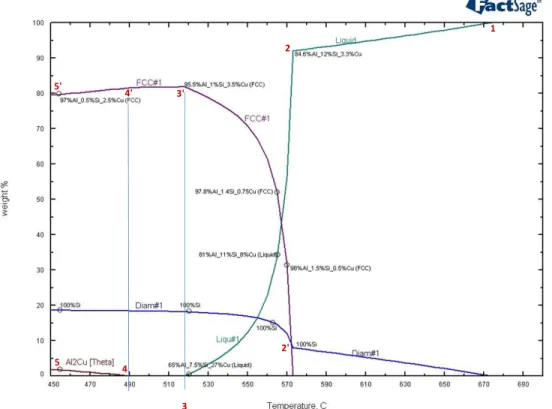
Figure 1. FactSage calculation on phase diagram for binary Al-Si (a) and ternary Al-Si-3wt.%Cu (b.) alloy
Figures 1 (a. and b.) show a comparison between phase diagrams for the binary Al-Si and ternary Al-Si-3%wt.Cu alloys. It follows that addition of 3% of Cu has a great effect on composition and kinetics of phase evolution, particularly in the hypereutectic region. Figure 1b. indicates that formation of Al-Si eutectic is followed by evolution of Al-Cu
(theta) phase. This is better depicted in Figures 2 and 3 that show results of FactSageTM
calculations of equilibrium solidification (Fig. 2) and non-equilibrium Scheil solidification (Fig. 3). Upon completion of solidification, the chart on Figure 2 also indicates transformation within the Al-Cu-Si phase (FCC), with gradual reduction of the
1 2 3 3' 4 5 5' 4' a. b.
solubility of Si (and its corresponding transformation into diamond phase) and the
formation of Al2Cu theta phase, which starts at 487oC.
Figure 2. FactSage calculation of equilibrium solidification for ternary Al-Si-3wt.%Cu alloy
Several numbered points shown in Figures 2 and 3 represent the progress of phase evolution during the equilibrium solidification. From liquidus (point 1) to the Al-Si
eutectic temperature of 573.2oC (point 2), melt solidifies by forming 100%-Si diamond
phase and by the corresponding reduction of Si concentration to 12%. The Al-rich FCC phase that is forming during eutectic evolution initially contains 1.5%Si and just 0.5%Cu
at 570oC. At the end of solidification (points 3 and 3’), Si solubility in the FCC phase is
reduced to 1% whilst Cu reaches its maximum of 3.5% (see point 3’ in Figure 2). When
the Al2Cu theta phase starts forming at 490oC (point 4) and with further reduction of
temperature to 455oC (points 5 and 5’), the solubility of silicon in the FCC phase is
further reduced to 0.5% (point 5’); correspondingly, the share of diamond-phase silicon in the alloy is increased to 17.5%. As indicated in Figure 2, the concentration of FCC
copper at 455oC is reduced to 2.5% (point 5’), while the concentration of theta phase
reaches 2% (point 5).
On the other hand, Figure 3 shows that evolution of the Al2Cu theta phase to ~4%
happens “all at once” at the solidus temperature. This outcome is explained by the fact that the Scheil module terminates computations when fraction solid is 100%.
1 2 2' 3 3' 4 5 5' 4'
Figure 3. FactSage calculation of non-equilibrium (Scheil) solidification for ternary Al-Si-3wt.%Cu alloy
It is understood that the FactSage calculation is an approximation of the complex process and does not necessarily closely reflect the real solidification process of the Al-Si-Cu alloy. In this research, to gain a better understanding of the dynamics of the real process, the computational analysis was followed with thermal analysis and in-situ neutron diffraction study of solidification of the binary and ternary alloys.
Thermal Analysis
The following figure (Figure 4) shows the results of the thermal analysis performed for hypereutectic Al-19%Si binary and ternary Al-Si-Cu alloy. The figure depicts the first derivative of the temperature, the cooling rate, over the temperature range of solidification for the both alloys. As expected, the two solidification patterns are quite different. The curves on the chart indicate earlier initiation of solidification (liquidus) for the ternary Al-Si-Cu alloy (point 1), but delayed formation of Al-Si eutectic (points 2). The ternary alloy chart also indicates the change in cooling rate that is associated with formation and evolution of Al-Cu-Si and Al-Cu phases (point 3) and solidus temperature (point 4) that is significantly lower than solidus of the binary Al-Si alloy. One may
question, however, whether solidification is complete at 508oC as the rapid change in the
cooling rate that takes place at this temperature may have coincided with continued evolution of the solid phase and, therefore, “smears” the end-of-solidification point over
the range of 508~490oC. We note that based on the prior FactSage calculations, theta
The main results of thermal analysis are summarized in Table I. The table also compares these results with the data obtained in the prior computations.
Figure 4. Cooling rate over the solidification temperatures received in thermal analysis for the binary Al-19wt.%Si and ternary Al-19wt.%Si-3wt.%Cu alloys.
The point 3 on the Figure 4 illustrates beginning of the temperature range of partial
transformation of Al-Cu-Si FCC phase and initiation of formation of Al2Cu phase that
takes place at the very end of solidification of the Al-Si-Cu alloy. This evolution takes
place in the temperature region of 508 to 490oC, following which the cooling rate of the
alloy is identical to the cooling rate of the binary material. According to the calculations (Figures 2 and 3) this is a solid-state transformation, which will be further discussed during the neutron diffraction analysis. Further study is required to explain the two peaks that appear on the graph following the point 3, which may be an indication of either two separate transformations or of a 2-stage transformation.
Further analysis is therefore planned to evaluate in detail the solidus and theta phase temperature region. -2.5 -2 -1.5 -1 -0.5 0 0.5 470 490 510 530 550 570 590 610 630 650 670 690 D er iv a tiv e, co o li n g ra te , C /s Temperature, C Al-Si (B5) Al-Si-Cu (C4) #1 #2 #3 #4
Table I. Results of thermal analysis for the binary Al-19wt.%Si and ternary Al-16wt.%Si-3wt.%Cu alloys
Al - 19wt.%Si Al - 19wt.%Si - 3wt.%Cu
No Thermal characteristics Thermal Analysis Temperature, oC Phase Diagram (FactSage) Thermal Analysis Temperature Phase Diagram (FactSage) Non-Equilibrium (Scheil) Solidification
Temperature Temperature Temperature
#1 Nucleation of the primary Si Liquidus, oC 672 677 678 673 673 #2 Nucleation of the Al-Si eutectic, oC 570 578 562 574 574 #3 Nucleation of the Al-Cu phase, oC - - 508 490 508 #4 End of solidification 542 578 508 // 490 518 508 Solidification range, oC 130 99 191 155 165
In-Situ Neutron Diffraction
The HB-2A neutron powder diffractometer at the Oak Ridge National Labs was used in this study. This instrument has the High Flux Isotope Reactor (HFIR) as its neutron source. A solidification cell was designed and built to carry out controlled melting and solidification experiments under the simultaneous exposure to neutron radiation (Figure 5). The graphite crucible (2) containing the analysed alloy (1) was placed inside a vanadium can (3) that was attached to a sample holding rod (4). The holding rod with the attached solidification cell was placed inside a vacuum furnace to prevent oxidation at higher temperatures. The control thermocouple (5) was inserted into the sample material to the depth of 6.5 mm to minimize its contribution to the diffraction pattern and to ensure the accurate reading of the sample temperature.
Figure 5. Solidification cell for the neutron diffraction experiment.
The crucible inner diameter was 6 mm, the total height was 50 mm (sample material
height 40 mm), the sample volume was 1.3 cm3, and its weight was about 3.5 grams. The
neutron beam height in this setup was limited to 42 mm to ensure that entire sample volume will contribute to the diffraction pattern. The test sample temperature was computer controlled based on the K-type sensor and PID circuit. The solidifying test sample, within a temperature range of 710 to 450 ºC, was irradiated with monochromatic thermal neutrons of wavelength 0.154 nm. Diffraction patterns were collected isothermally, by holding for 30 minutes at the test temperatures. The measurements were
taken in terms of scattered intensity vs. diffraction angle 2Θ (where Θ is the Bragg
angle). The analysed scattering angle ranged from 20 to 120 degrees.
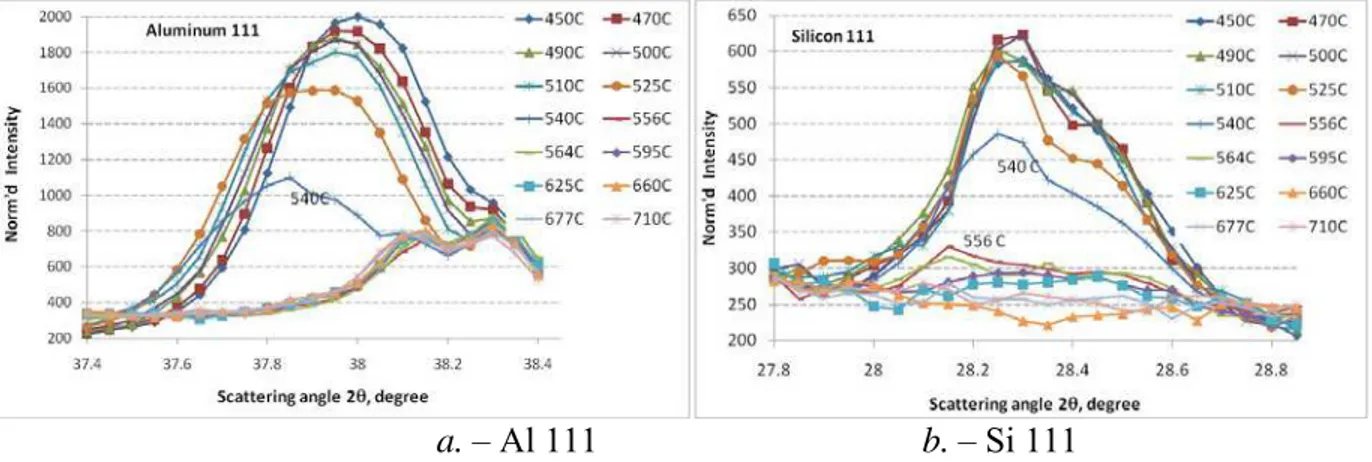
The following graphs (Figure 6) indicate solid phase evolution for aluminum (a.) and silicon (b.). The graphs indicate that during cooling of the melt, neutron diffraction from
aluminum crystals start appearing at 540oC (Figure 6a.). Prior to that, at higher
temperatures, only diffuse neutron scattering is present in the diffraction pattern. The
intensity of neutron diffraction increases rapidly as temperature is reduced to 525, 510oC,
and below.
While there is considerable point-to-point variation between the diffraction patterns, Figure 6b indicates that solid silicon is present at higher temperatures, specifically at 564
and 556oC. This point-to-point variation becomes more important as the intensity in the
peak decreases. Nevertheless, there may be some evidence of presence of
short-atomic-order Si particles at higher temperatures, up to 625oC, as indicated by increased
“background” intensity within the Si {111} peak position. Though the data under the Si peak appear somewhat “noisy”, in general the trends are meaningful.
Solidification profiles were retrieved separately for aluminum (Figure 7a.) and silicon (Figure 7b.). This was done by integration of the normalized intensity function over about 2-degree of 2Θ range that covers the corresponding peak. The approach applied in this analysis was earlier explained in detail in [8].
a. – Al 111 b. – Si 111
Figure 6. Neutron diffraction data: phase evolution during solidification
a. – solid aluminum b. – solid silicon
Figure 7. Neutron diffraction data: Alloy constituents’ solidification
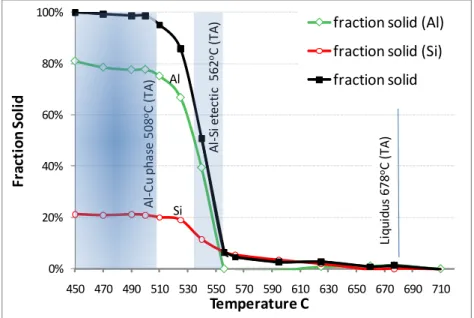
Results of the neutron analysis were summarized in the following figure (Figure 8) that shows fraction solid evolution over the temperature range of alloys solidification. The graph presents separate profiles of solid aluminum and solid silicon evolution, as well as the areas Al-Si eutectic and expected formation of the Al-Cu phase. The first detection of
solid phase (~2%) is at 625oC, which is lower than found in thermal analysis that
determined liquidus temperature being 678oC.
Figure 8 also indicates that the solid phase is present in the diffraction pattern as solid
silicon until the temperature reached 540oC, when concentration of fraction solid of
aluminum was detected at 39%. The previous datapoint, received at 556oC, indicated that
no solid aluminum is present in the melt. Formation of the Al-Si eutectic could therefore be only detected at temperatures lower than the ones received in FactSage calculations
and thermal analysis (574 and 562oC correspondingly, Table 1). The area of initiation of
the Al-Si eutectic solidification is shaded in the figure.
‐20% 0% 20% 40% 60% 80% 100% 450 470 490 510 530 550 570 590 610 630 650 670 690 710 % so li d a lum inum Temperature C Al 111 Al 200 Al 220 % solid Al ‐20% 0% 20% 40% 60% 80% 100% 450 500 550 600 650 700 % so lid sili co n Temperature C Si 111 Si 311 % solid Si
The other shaded area in Figure 8 covers the expected temperatures of evolution of the
Al2Cu theta phase. However, there is no definite indication of presence of this phase in
the diffraction pattern.
It is difficult to determine the exact solidus temperature, as the neutron data had been collected incrementally, for a number of discrete temperature points. However, the
integrated diffraction intensity obtained at 500oC remains the same as the temperature
was reduced further, indicating that at this temperature the alloy was already fully solid.
Figure 8. Fraction solid evolution for the main constituents of the alloy
Conclusions
A non-equilibrium solidification of a hypereutectic Al-Si-Cu alloy was studied in a course of computational analysis using FactSage 6.2 software, thermal analysis, as well as in-situ neutron diffraction analysis. The following are the main findings of this study:
1. The FactSage computations were performed both for equilibrium and
non-equilibrium (Scheil) solidification modes. The results received were used for qualitative and quantative analysis of the data obtained in the thermal analysis and neutron diffraction analysis, particularly with regards to the temperature ranges and rates of evolution of solid phases.
2. The FactSage computations revealed that Al2Cu theta phase should form following
complete solidification of the alloy. This was confirmed in thermal analysis, as a
noticeable energy release was detected in the temperature range of 508~492oC. This
energy release was explained by enthalpy change associated with formation of the Al-Cu phase. 0% 20% 40% 60% 80% 100% 450 470 490 510 530 550 570 590 610 630 650 670 690 710 Fra ct io n So li d Temperature C fraction solid (Al) fraction solid (Si) fraction solid Al ‐Si et e c ti c 562 oC (TA ) L iqui dus 67 8 oC (T A ) Al ‐Cu pha se 508 oC (TA ) Al Si
3. In the neutron diffraction analysis the solid and liquid volume fractions were determined based on the change of intensity of diffraction peaks over the solidification interval. The Al-Cu theta phase was not detected in this analysis suggesting that that the signal-to-noise ratio was either too low or/and the diffraction peaks of the phase overlapped with the other peaks that are present in the pattern (eg. peaks coming from graphite crucible).
4. The in-situ neutron diffraction revealed the individual profiles of solid Al and solid Si
evolution. It was shown that the solid phase is present in the diffraction pattern as
solid silicon until the temperature reached 540oC, when solid aluminum was first
detected. At 556oC the fraction solid of silicon was detected at ~7wt.%, which is the
amount of alpha-Si expected to form in the studied alloy prior to formation of Al-Si eutectic according the phase diagram (FactSage calculations).
5. The fraction solid of aluminum detected at 540oC was 39%. The previous datapoint,
received at 556oC, indicated that no solid aluminum is present in the melt. Formation
of the Al-Si eutectic could therefore be only detected at temperatures lower than the
ones received in FactSage calculations and thermal analysis (574 and 562oC
correspondingly). This suggests that the “slow” step-wise reduction in temperature of the solidifying alloy delays the initiation of the eutectic solidification.
6. It is difficult to determine the exact solidus temperature, as the neutron data had been
collected incrementally, for a number of discrete temperature points. However, the
integrated diffraction intensity obtained at 500oC remains the same as the temperature
was reduced further. This indicates that solidification completes at or just prior to this
temperature, whereas at 510oC the fraction solid was detected at 95%. We note that
the FactSage (Scheil) calculations resulted in solidus temperature of 510oC and the
results of thermal analysis are not suitable for determining solidus as the end-of-solidification is “smeared” by the energy release due to formation of the Al-Cu phase.
Acknowledgements
The authors would like to acknowledge the support of the Advanced Structural Materials for Next Generation Vehicles (ASM-NGV) Program of Natural Resources Canada. Studies completed at the Canadian Neutron Beam Center were partially sponsored by grant from Natural Sciences and Engineering Research Council of Canada. A portion of this research at Oak Ridge National Laboratory's High Flux Isotope Reactor was sponsored by the Scientific User Facilities Division, Office of Basic Energy Sciences, U. S. Department of Energy. The authors would like to thank Ms. Marta Aniolek M. Sc. Eng., CANMET-MTL, for assistance with for cooling curve analysis and Mr. Denis Shishin of University of Montreal for assistance in conducting the FactSage analysis.
References
1. J. L. Jorstad, “The Progress of 390 Alloy: From Inception until Now”, AFS
2. Y. P. Telang, “Process Variables in Al-21Si Alloys Refinement”, AFS Transactions, vol. 71, 232-240 (1963).
3. W. Kasprzak, J. H. Sokolowski, H. Yamagata, M. Sahoo, H. Kurita, “The Effect
of the Melt Temperature and the Cooling Rate on the Microstructure of the Al-20%Si Alloy used for Monolithic Engine Blocks”, International Journal of Metalcasting, vol. 3, Issue 3, Summer 2009, 55-73.
4. H. Yamagata, H. Kurita, M. Aniolek, W. Kasprzak, J. H. Sokolowski, “Thermal
and Metallographic Characteristics of the Al-20%Si High-Pressure Die-Casting Alloy for Monolithic Cylinder Blocks,” Journal of Materials Processing Technology, vol. 199, no. 1-3, 84-90 (2008).
5. H. Yamagata, W. Kasprzak, M. Aniolek, H. Kurita, J. H. Sokolowski, “The
Effect of Average Cooling Rates on the Microstructure of the Al-20%Si High Pressure Die Casting Alloy used for Monolithic Cylinder Blocks”, Journal of Materials Processing Technology, vol. 203, 333-341 (2008).
6. J. L. Jorstad, D. Apelian, “Hypereutectic Al-Si Alloys: Practical Casting
Considerations”, International Journal of Metalcasting, vol. 3, Issue 3, Summer 2009, 13-43.
7. G. I. Eskin, D. G. Eskin, “Some Control Mechanism of Spatial Solidification in
Light Alloys”, Zeitschrift fur Metallkunde, vol. 95, no. 8 (2004).
8. W. Kasprzak, D. Sediako, M. Sahoo, M. Walker, I. Swainson, “Characterization
of Hypereutectic Al-19%Si Alloy Solidification Process using In-Situ Neutron Diffraction and Thermal Analysis Techniques”, Proceedings of TMS 2010, Supplemental Proceedings: Volume 1, Materials Processing and Properties, pp. 93-104.
9. W. Kasprzak, D. Sediako, M. Sahoo, M. Walker, I. Swainson, “Solidification
Analysis of Al-Si Alloys Using In-Situ Neutron Diffraction”, MetSoc, Conference of Metallurgists, Vancouver, BC, October 3-6, 2010
10. D. Sediako, W. MacDonald, S. Hibbins, “Mould Thermal Analysis in
Direct-Chill Casting of Magnesium Alloys”, The Minerals, Metals & Materials Society, TMS, New Orleans, LA, March 2008, Magnesium Technology 2008, 215-219.
11. N. Iqbal, N.H. van Dijk, V.W.J. Verhoeven, W. Montfrooij, T. Hansen, L.
Katgerman, G.J. Kearley, “Experimental Study of Ordering Kinetics in Aluminum Alloys during Solidification”, Acta Materialia 51 (2003) 4497-4504.
12. N. Iqbal, N.H. van Dijk, V. W .J. Verhoeven, T. Hansen, L. Katgerman, G. J.
Kearley, “Periodic Structural fluctuations during the Solidification of Aluminum Alloys Studied by Neutron Diffraction”, Materials Science and Engineering A 367 (2004) 82-88.