Publisher’s version / Version de l'éditeur:
Technical Report, 2009-01-01
READ THESE TERMS AND CONDITIONS CAREFULLY BEFORE USING THIS WEBSITE.
https://nrc-publications.canada.ca/eng/copyright
Vous avez des questions? Nous pouvons vous aider. Pour communiquer directement avec un auteur, consultez la première page de la revue dans laquelle son article a été publié afin de trouver ses coordonnées. Si vous n’arrivez pas à les repérer, communiquez avec nous à [email protected].
Questions? Contact the NRC Publications Archive team at
[email protected]. If you wish to email the authors directly, please see the first page of the publication for their contact information.
NRC Publications Archive
Archives des publications du CNRC
For the publisher’s version, please access the DOI link below./ Pour consulter la version de l’éditeur, utilisez le lien DOI ci-dessous.
https://doi.org/10.4224/18227280
Access and use of this website and the material on it are subject to the Terms and Conditions set forth at
A numerical freeing port study on small fishing vessels Chin, S.; Bass, D.
https://publications-cnrc.canada.ca/fra/droits
L’accès à ce site Web et l’utilisation de son contenu sont assujettis aux conditions présentées dans le site LISEZ CES CONDITIONS ATTENTIVEMENT AVANT D’UTILISER CE SITE WEB.
NRC Publications Record / Notice d'Archives des publications de CNRC:
https://nrc-publications.canada.ca/eng/view/object/?id=2fbf59d5-7838-446e-af69-90815d875c67 https://publications-cnrc.canada.ca/fra/voir/objet/?id=2fbf59d5-7838-446e-af69-90815d875c67
National Research Council Canada Institute for Ocean Technology Conseil national de recherches Canada Institut des technologies oc ´eaniques
TR-2009-07
Technical Report
A Numerical Freeing Port Study on Small Fishing Vessels.
DOCUMENTATION PAGE
REPORT NUMBER
TR-2009-07
NRC REPORT NUMBER DATE
March 2009
REPORT SECURITY CLASSIFICATION
Unclassified
DISTRIBUTION
Unlimited
TITLE
A NUMERICAL FREEING PORT STUDY ON SMALL FISHING VESSELS FINAL REPORT
AUTHOR(S)
S. Chin1 and Don Bass2
CORPORATE AUTHOR(S)/PERFORMING AGENCY(S) 1
Institute for Ocean Technology, National Research Council, St. John’s, NL
2
Don Bass Marine Consulting
PUBLICATION
SPONSORING AGENCY(S)
Transport Canada
IOT PROJECT NUMBER
42_2333_16
NRC FILE NUMBER KEY WORDS
freeing port, vessel, water, deck, ingress, egress, flaps
PAGES vi, 36 FIGS. 39 TABLES 5 SUMMARY
Freeing ports on fishing vessels are a significant safety feature. They are designed to reduce the build up of green water on deck that may lead to loss of stability. At a more mundane level they reduce wetness on decks that are the working platforms for the fishers. Wet decks that are moving working platforms are clearly a hazard. The present study deals more with the build up of water on deck rather than just general deck wetness. It attempts to quantify the amount of water on deck for different freeing port configurations, using parameters such as number of freeing ports, freeing port areas, deck area etc. The study uses numerical simulations to evaluate these parameters. One particular vessel has been used throughout the study, namely a typical fibreglass 65 foot fishing vessel of recent design.
The main conclusions of the study are that generally there is not a great deal of difference between the amounts of water on deck for the different freeing port configurations. Although larger freeing ports allow more water on deck if the ingress and egress of water flowing through the freeing ports is unhindered in both directions, for freeing ports fitted with some device (such as ‘flaps’) that hinders the in-flow but not the out-flow then having larger freeing ports is shown to be beneficial. The benefits here are more to do with stability than general deck wetness. It is in fact clear from some of the results that larger freeing ports lead to wetter decks.
The motions of the vessel in the study with water on deck have been evaluated and it is shown that different freeing port configurations can lead to different motions of the vessel, particularly in the early stages of flooding.
ADDRESS National Research Council
Institute for Ocean Technology Arctic Avenue, P. O. Box 12093
National Research Council Conseil national de recherches Canada Canada Institute for Ocean Institut des technologies
Technology océaniques
A NUMERICAL FREEING PORT STUDY ON SMALL FISHING VESSELS
FINAL REPORT
TR-2009-07
Shin Chin Don Bass March 2009
TABLE OF CONTENTS
List of Tables... iii
List of Figures ... iii
Executive Summary ... vi
1.0 INTRODUCTION ... 1
2.0 NUMERICAL MODELING ... 3
3.0 SOME BASIC FREEING PORT CONFIGURATIONS ... 5
4.0 FIXED VESSEL STUDIES... 5
4.1. The Effects of a ‘Sloping’ Deck ... 9
4.2 Drainage Rates ... 12
5.0 VESSEL FREE TO MOVE STUDIES... 13
5.1 The Effects of a Sloping Deck ... 15
5.2 Vessel Motions... 17
5.3 Discharge coefficient ... 20
5.4 Water Ingress over Bulwarks... 21
5.5 Flow Rates ... 24
5.6 Longer Deck and Freeing Ports moved Forward... 27
5.7 Longer Deck and More Freeing Ports... 29
5.8 Freeing Ports with Flaps ... 31
6.0 SUMMARY AND CONCLUSIONS ... 32
LIST OF TABLES Table 1. Characteristics of Study Vessel. ... 2
Table 2. Waves Used in Fixed Vessel Studies... 6
Table 3. Wave conditions used in free motion studies ... 13
Table 4. Showing Maximum and Mean Volumes of water on deck for the configurations considered in the simulations in 2.5 m regular beam waves at a frequency of 1.25 rad/s 34 Table 5. Showing Maximum and Mean Volumes of water on deck for the configurations considered in the simulations in 3.0 m regular beam waves at a frequency of 1.0 rad/s.. 35
LIST OF FIGURES Figure 1. Showing basic study vessel with freeing ports... 1
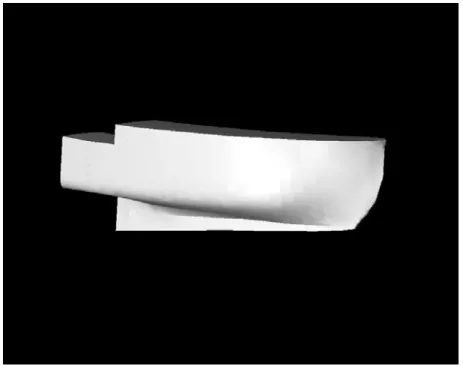
Figure 2a. Showing the Geometric Form used for the Study Vessel in the Simulations... 2
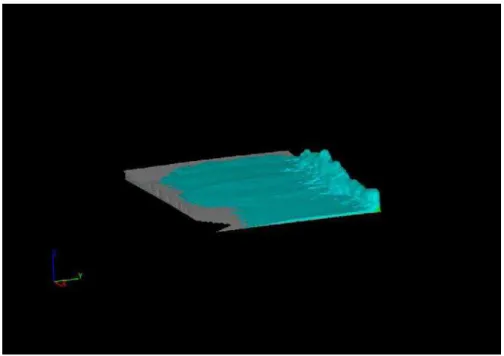
Figure 2b. Showing water flowing onto the deck in the CFD simulation. ... 3
Figure 3. Showing volume of water on deck for the standard case (1) in regular beam waves of amplitude 1.0 and 1.5 m waves... 6
Figure 4. Showing volume of water on deck for increased port length (case 3) in regular beam waves of amplitude 1.0 and 1.5 m waves ... 7
Figure 5. Showing volume of water on deck for increased port area (case 2) for regular beam waves of amplitude 1.0,1.25 and 1.5 m. ... 7
Figure 6. Showing volume of water on deck for the 3 cases, for 2 wave amplitudes (amp = 1.0, 1.5 m). An additional run is made for wave amplitude 1.25 for the increased area case. .. 8
Figure 7. Showing volume of water on deck vs. wave amplitude, for frequencies 0.7, 1.0, and 1.25 rad/s, for the increased area case... 9 Figure 8. Showing the exposed main deck of the study vessel... 9 Figure 9. Showing time histories of flows onto the main deck with a realistic form, for the
standard configuration (case (1)) for 1.0 and 1.5 m amplitude waves... 10 Figure 10. Showing time histories of flows onto the main deck with a realistic form, for the
increased area configuration (case (2)) for 1.0 and 1.5 m amplitude waves. ... 11 Figure 11. Showing steady state volumes on the main deck with and without a realistic form, for
the standard (case (1)) and the increased area configuration (case (2))... 11 Figure 12. Showing drainage rates for a fixed vessel with 13 cu. m. of water on deck for various
freeing port and deck configurations. ... 13 Figure 13. Showing time histories of water on deck for the standard model with the vessel free to
move in waves of amplitude 2 and 2.5 m. Also shown is the case with a ‘deck’ for 2.5 m waves with fr=1.25 rad/s... 14 Figure 14. Showing time histories of water on deck for the model with increased freeing port
area with the vessel free to move in waves of amplitude 2 m and 2.5 m. Also shown is the case with a ‘deck’ for 2.5 m waves with fr=1.25 rad/s. ... 14 Figure 15. Showing steady state volumes of water on deck for the standard case (1) and for the
increased area case (2) with the vessel free to move in regular waves of amplitude 2 m and 2.5 m... 15 Figure 16. Showing time histories of water on deck for the standard model with a deck for the
vessel free to move in waves of amplitude 2 and 2.5 m. ... 16 Figure 17. Showing time histories of water on deck for the model with increased freeing port
area and a ‘deck’ with the vessel free to move in waves of amplitude 2 m and 2.5 m. ... 16 Figure 18. Showing steady state volumes of water on deck for the standard case (1) and
increased area case (2) with a ‘deck’ for the vessel free to move in waves of amplitude 2 m and 2.5 m... 17 Figure 19. Showing heave motions of the vessel with and without freeing ports in 2.5 m
amplitude regular beam waves of frequency 1.25 rad/s. Also shown are the motions when there is a ‘deck’ for the standard and the increased area cases... 18 Figure 20. Showing roll motions of the vessel with and without freeing ports in 2.5 m amplitude
regular beam waves of frequency 1.25 rad/s. Also shown are the motions when there is a ‘deck’ for the standard and the increased area cases. ... 18 Figure 21. Showing pitch motions of the vessel with and without freeing ports in 2.5 m
amplitude regular beam waves of frequency 1.25 rad/s. Also shown are the motions when there is a ‘deck’ for the standard and increased area cases... 19 Figure 22. Showing yaw motions of the vessel with and without freeing ports in 2.5 m amplitude
regular beam waves of frequency 1.25 rad/s. Also shown are the motions when there is a ‘deck’ for the standard and increased area cases. ... 19 Figure 23. Showing time histories of volumes on deck for the increased freeing port area
configuration, using discharge coefficient of 0.85 compared to the default value(1.0). The wave amplitude is 2.5 m and the frequencies used are 1.25 rad/s and 1.0 rad/s... 21 Figure 24. Showing time histories of volume on deck for the standard configuration with and
without bulwarks in regular 2.5 m beam waves (freq=1.25 rad/s). Also shown is the case for 3 m waves (freq=1.0 rad/s) with bulwarks for the standard configuration. ... 22
Figure 25. Showing time histories of volume on deck for the standard and increased area configuration with and without bulwarks in regular 2.5 m beam waves (freq=1.25 rad/s). Also shown are results for 3.0 m waves of frequency 1.0 rad/s ... 23 Figure 26. Showing roll motions with and without bulwark over-spill for the standard and
increased area configurations in 2.5 m beam waves, frequency 1.25 rad/s ... 23 Figure 27. Showing pitch motions with and without bulwark over-spill for the standard and
increased area configurations in 2.5 m beam waves, frequency 1.25 rad/s ... 24 Figure 28. Showing flow rates through a freeing port near amidships on the Weather side for the
standard and increased area configurations in 2.5 m beam waves. ... 25 Figure 29. Showing flow rates through a freeing port near amidships on the Lee side for the
standard and increased area configurations in 2.5 m beam waves ... 25 Figure 30. Showing flow rates through a freeing port near amidships on the Lee side and
Weather side for the increased area configuration in 2.5 m beam waves... 26
Figure 31. Showing flow rates over bulwarks near stern on the Lee side and Weather side for the standard configuration in 2.5 m beam waves... 26 Figure 32. Showing time histories of water on deck for the long deck configuration with both
standard and increased area freeing ports moved forward in 2.5 m regular beam waves. The results for the ‘short’ deck with increased area freeing ports are also shown. ... 27 Figure 33. Showing time histories of roll motion for the long deck configuration with both
standard and increased area freeing ports moved forward in 2.5 m regular beam waves. The results for the standard and increased area cases are also shown. ... 28 Figure 34. Showing time histories of pitch motion for the long deck configuration with both
standard and increased area freeing ports moved forward in 2.5 m regular beam waves. The results for the standard and increased area cases are also shown. ... 29 Figure 35. Showing time histories of water on deck for the long deck configuration with both 10
and 16, standard and increased area, freeing ports in regular 2.5 m beam waves
(freq=1.25 rad/s). Also shown are the results for the ‘short deck’. ... 30 Figure 36. Showing time histories of water on deck for the long deck configuration with both 10
and 16, standard and increased area, freeing ports in regular 3.0 m beam waves of
frequency 1.0 rad/s... 30 Figure 37. Showing time history of water on deck with bulwarks for freeing ports of different
area fitted with ‘flaps’ in 2.5 m beam waves at 1.25 rad/s. ... 31 Figure 38. Showing time histories of roll motions for freeing ports with flaps compared to no
freeing ports, in 2.5 m beam waves at frequency of 1.25 rad/s ... 32 Figure 39. Showing time history of volume on deck for the long deck with 16 freeing ports of
Executive Summary
Freeing ports on fishing vessels are a significant safety feature. They are designed to reduce the build up of green water on deck that may lead to loss of stability. At a more mundane level they reduce wetness on decks that are the working platforms for the fishers. Wet decks that are moving working platforms are clearly a hazard. The present study deals more with the build up of water on deck rather than just general deck wetness. It attempts to quantify the amount of water on deck for different freeing port configurations, using parameters such as number of freeing ports, freeing port areas, deck area etc. The study uses numerical simulations to evaluate these parameters. One particular vessel has been used throughout the study, namely a typical fibreglass 65 foot fishing vessel of recent design.
The main conclusions of the study are that generally there is not a great deal of difference between the amounts of water on deck for the different freeing port configurations. Although larger freeing ports allow more water on deck if the ingress and egress of water flowing through the freeing ports is unhindered in both directions, for freeing ports fitted with some device (such as ‘flaps’) that hinders the in-flow but not the out-flow then having larger freeing ports is shown to be beneficial. The benefits here are more to do with stability than general deck wetness. It is in fact clear from some of the results that larger freeing ports lead to wetter decks.
The motions of the vessel in the study with water on deck have been evaluated and it is shown that different freeing port configurations can lead to different motions of the vessel, particularly in the early stages of flooding.
1.0 INTRODUCTION
In severe weather, small fishing vessels are more at risk than larger vessels. This is due to a number of factors. One important factor is the amount of water than can enter the main deck area of the vessel through freeing ports or over the bulwarks. A certain amount of water on deck may remain trapped and lead to motions that will cause a further build up of water on deck. The depth and weight of this water may not be large, but on small boats, it may be enough to
adversely affect the stability of the boat. In this study, different freeing port configurations are considered and the amount of water that remains trapped on deck determined.
Table 1. Characteristics of Study Vessel. Displacement 224 t Length 19.8 m Beam 7.32 m Draft 2.70 m GM 1.24 m Freeboard 0.81 m Bulwark Height 1.2 m
Freeing port area 0.144 sq. m
Freeing Port length 0.56 m
Length of open deck 12 m
Speed 4 kt
Figure 2a. Showing the Geometric Form used for the Study Vessel in the Simulations. The geometric form of the vessel used in the simulations is shown in figure 2a. Notice that it is assumed to be watertight up to the shelter deck and up to the top of the bulwarks near the stern. All incursions of fluid onto the deck over the bulwarks or through freeing ports are dealt with by the coupling of codes used in the simulations. The seakeeping code deals with the
water flowing onto it which is shown below in figure 2b.This study is restricted to numerical simulations of ship motion and the flow of water on deck in and out of the freeing ports.
Figure 2b. Showing water flowing onto the deck in the CFD simulation.
2.0 NUMERICAL MODELING
The modeling of freeing ports on fishing vessels is carried out using a coupling of 2 numerical codes. Motsim is the seakeeping code that determines the time histories of motions of the vessel in waves and Flow-3D is a CFD code that allows the ingress and and exit of water through freeing ports to be modeled as well as the resulting flow of the water on deck to be determined. The water on deck flows according to the motions of the vessel, and the pressure field associated with that flow exerts forces and moments on the deck of the vessel. Those forces and moments at each time step are communicated to Motsim in the coupling of the 2 codes, thereby modifying the motions of the vessel. The motions of the deck of the vessel at each time step are fed to Flow-3D as boundary conditions.
MOTSIM is a non-linear time domain Seakeeping code that simulates six degrees of freedom motion, with forward speed in any wave conditions . The ship’s geometry is defined in terms of a sequence of sections, each of which is described by a set of panels. At each time step, the code determines the intersection of these panels with the waterline and redefines the paneling describing the ship’s wetted surface. The pressure forces associated with the incident waves are
then numerically integrated over this surface, using second order Gaussian Quadrature .The waves are taken as second order Stokes waves. The normal velocity distribution associated with the velocity of the vessel and the incident wave particle velocity is averaged over each panel and then a least squares fitting of this distribution based on the wetted panels belonging to a
particular section is made such that a unique decomposition of the modal velocities (surge, sway, heave and roll) is obtained that most closely satisfies the body boundary condition on the
section.. The use of the wetted surface to determine modal velocities serves as an approximation to a non-linear body boundary condition. The code allows for more general decompositions of the velocity distribution to be made using a higher number of non-standard modes. From this decomposition, the scattering forces and moments are determined for each section based on precalculated memory functions. The memory functions for each section are derived from added mass and damping coefficients from zero speed linear theory over a truncated semi-infinite frequency range. Their use allows for arbitrary frequency content in the scattering forces and moments. The added mass and damping coefficients can be either 2 or 3 dimensional.
Corrections are made for forward speed.
Viscous effects associated with roll damping and manoeuvring are determined using semi-empirical formulae or experimentally determined coefficients. The total forces are then used in the non-linear equations of motion to determine the motions of the vessel.
The modeling of the freeing ports in Flow-3D is achieved using 3D ‘objects’,
representing the geometry and location of the freeing ports. The ‘objects’ are defined as mass sources (or sinks). The deck of the vessel in the simplest model is just a rectangular box located at the approximate position of the vessel’s deck relative to the coordinate system situated at amidships on the water plane of the vessel. Thus the ‘box’ commences at -10 m (the stern) and ends at 2 m; the width of the box is the beam of the vessel (7.3m). The vertical coordinates start at 0.81 m (the freeboard) and are carried up to a height that will be sufficient to reflect the vertical flow of the water on deck (for more significant sloshing and rolling the greatest height used was 3.0m).
The rate of flow through the freeing ports, either out of or into the deck space, is determined by the ‘source strength’, that is by the flux across the area of the freeing ports. This rate of flow is calculated in terms of the relative head of water on either side of the bulwarks
using the standard Bernoulli equation for ideal flows. The source strength is as follows,
0.5*Area* Dc* sqrt( 9.807*abs(head)) ---(1)
Where area is freeing port area, Dc is the discharge coefficient and head is the relative height of the water. The sign of the source (and hence the direction of the flow) is determined by the sign of head .
The discharge coefficient will depend on the geometry of the freeing port. For the sake of simplicity it is taken as 1.0 in most of the calculations. Some calculations are made to illustrate the effect of a lower discharge coefficient. As expected it will mean less water on deck.
3.0 SOME BASIC FREEING PORT CONFIGURATIONS
The ‘standard’ configuration considered in this study is based on a typical fibre glass 65 footer (see figure 1). The vessel has 5 freeing ports per side, each with an area of 0.144 sq m The total area on each side is then 0.72 sq m. One of the standard formulae recommended for the area per side is given as 0.7 + 0.035 L where L is the minimum of the length of bulwark and 70% length of vessel. In the vessel under consideration, L=12 m and the recommended area per side is 1.12 sq m. This is well above the area used on the study vessel. Strictly speaking the vessel has only 3 m length of bulwarks, however there is 12 m of main deck that is shielded from the Ocean by structure that is not considered watertight
In the first set of studies, 3 configurations are used. (1) The ‘standard’, (2) ‘standard’ freeing port area increased by increasing length and height to bring area to ‘recommended area’and (3) freeing port lengths increased by a factor of 1.6 (to bring areas up to the ‘recommended area’)
4.0 FIXED VESSEL STUDIES
The first set of calculations are based on the vessel fixed and subject to regular beam waves. The waves are of 2 heights, 2m and 3m with 3 different wave frequencies 0.7, 1.0 and 1.25 rad/s. A limited number of runs are made using the wave height 2.5 m.
Table 2. Waves Used in Fixed Vessel Studies
Wave amplitude (m) Wave frequencies (rad/s)
1.0 0.7, 1.0, 1.25
1.25 0.7,1.0,1.25
1.5 0.7, 1.0, 1.5
Time histories of the volume of water on deck of the vessel are shown in the figures below for the 3 configurations.
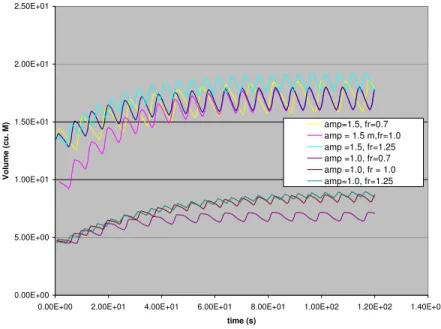
Volume on deck time history for standard model with 10 freeing ports.
0.00E+00 5.00E+00 1.00E+01 1.50E+01 2.00E+01 2.50E+01
0.00E+00 2.00E+01 4.00E+01 6.00E+01 8.00E+01 1.00E+02 1.20E+02 1.40E+02
time (s) Volu me (cu . M) amp=1.5, fr=0.7 amp = 1.5 m,fr=1.0 amp =1.5, fr=1.25 amp =1.0, fr=0.7 amp =1.0, fr = 1.0 amp=1.0, fr=1.25
Figure 3. Showing volume of water on deck for the standard case (1) in regular beam waves of amplitude 1.0 and 1.5 m waves.
Volume on deck time history with freeing ports length increased by a factor of 1.6 0.00E+00 5.00E+00 1.00E+01 1.50E+01 2.00E+01 2.50E+01
0.00E+00 2.00E+01 4.00E+01 6.00E+01 8.00E+01 1.00E+02 1.20E+02 1.40E+02
time (s) Volu me (cu . M) amp=1.0,fr=1.0,prln16 amp=1.0,fr=1.25,prln16 amp=1.0,fr=0.7,prln16 amp=1.5,fr=0.7,prln16 amp=1.5,fr=1.0,prln16 amp=1.5,fr=1.25,prln16
Figure 4. Showing volume of water on deck for increased port length (case 3) in regular beam waves of amplitude 1.0 and 1.5 m waves
Volume on deck time history for freeing ports with area increased by factor 1.6
0.00E+00 5.00E+00 1.00E+01 1.50E+01 2.00E+01 2.50E+01 3.00E+01 3.50E+01
0.00E+00 2.00E+01 4.00E+01 6.00E+01 8.00E+01 1.00E+02 1.20E+02 1.40E+02
time (s) Volu me (cu . M) amp=1.0m,fr=0.7,arx1.6 amp=1.0m,fr=1.0,arx1.6 amp=1.0m,fr=1.25,arx1.6 amp=1.5m,fr=0.7,arx1.6 amp=1.5m,fr=1.0,arx1.6 amp=1.5m,fr=1.25,arx1.6 amp=1.5m,fr=1.25,arx1.6,hi amp=1.25m,fr=0.7,arx1.6 amp=1.25m,fr=1.0,arx1.6 amp=1.25m,fr=1.25,arx1.6
Figure 5. Showing volume of water on deck for increased port area (case 2) for regular beam waves of amplitude 1.0,1.25 and 1.5 m.
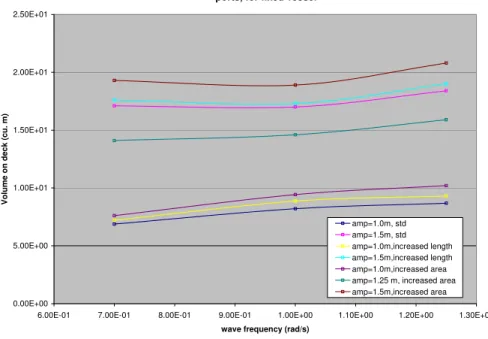
Steady state fluid volume on std deck with (1)standard,(2) longer and (3)greater area freeing ports, for fixed vessel
0.00E+00 5.00E+00 1.00E+01 1.50E+01 2.00E+01 2.50E+01
6.00E-01 7.00E-01 8.00E-01 9.00E-01 1.00E+00 1.10E+00 1.20E+00 1.30E+00
wave frequency (rad/s)
Volume o n deck (cu . m) amp=1.0m, std amp=1.5m, std amp=1.0m,increased length amp=1.5m,increased length amp=1.0m,increased area amp=1.25 m, increased area amp=1.5m,increased area
Figure 6. Showing volume of water on deck for the 3 cases, for 2 wave amplitudes (amp = 1.0, 1.5 m). An additional run is made for wave amplitude 1.25 for the increased area case.
It should be pointed out that some initial volume of water is used on the deck to reduce the amount of time before a steady state is reached. In figure 5, it is shown that putting excess water on deck leads to the same steady state as the gradual build up of water.
It is clear from the figures that increasing the wave amplitude increases the amount of water trapped on deck. Also increasing the wave frequency also increases the amount of water on deck. The results of the steady state volumes versus wave frequency are shown in figure 6 for the different freeing port configurations.
The greatest mean values of the volume of water on deck is for the increased area case at all frequencies and wave amplitudes. It is however more significant for the higher amplitude waves. One may conclude that , as expected, decks with larger freeing ports are wetter for the situation where there is not enough water on deck to influence the motions of the boat.
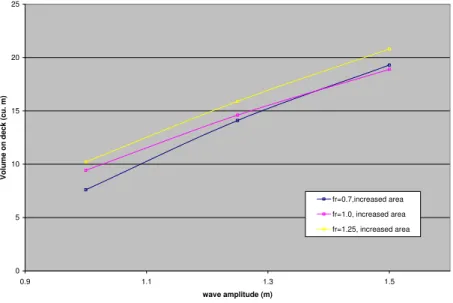
The figure 7 below shows that the variation of water on deck with wave amplitude is nearly linear for the increased freeing port area case. Similar results hold for the standard case.
Steady state fluid volume on standard deck with greater area freeing ports, for fixed vessel
0 5 10 15 20 25 0.9 1.1 1.3 1.5 wave amplitude (m) V o lum e on de c k (c u. m) fr=0.7,increased area fr=1.0, increased area fr=1.25, increased area
Figure 7. Showing volume of water on deck vs. wave amplitude, for frequencies 0.7, 1.0, and 1.25 rad/s, for the increased area case.
4.1. The Effects of a ‘Sloping’ Deck
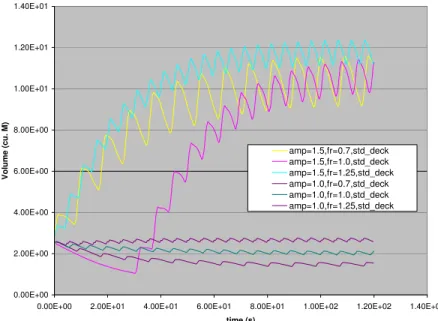
For the sake of simplicity, the simplest deck model was taken –namely a rectangular horizontal box. A more realistic case was tested, where the deck was given a a camber and rake based on the study vessel deck. That deck is shown in figure 8.
The deck form gives a higher freeboard towards the stern. The freeboard at the aft freeing port is 0.98 m as opposed to 0.81 m for the most forward freeing port. The standard box model has a freeboard of 0.81 m at each freeing port. There is therefore likely to be less volume of water on deck for the vessel in the fixed condition if the rake of the deck is considered. The rake of the deck will cause the water to flow forward, and there will be less water leaving the aft freeing ports but more from the forward freeing ports. The camber of the deck is slight and does not seem to have a strong influence on the flow.
Volume on deck time history for standard model with a 'deck' and 10 freeing ports.
0.00E+00 2.00E+00 4.00E+00 6.00E+00 8.00E+00 1.00E+01 1.20E+01 1.40E+01
0.00E+00 2.00E+01 4.00E+01 6.00E+01 8.00E+01 1.00E+02 1.20E+02 1.40E+02
time (s) Volu me (cu . M) amp=1.5,fr=0.7,std_deck amp=1.5,fr=1.0,std_deck amp=1.5,fr=1.25,std_deck amp=1.0,fr=0.7,std_deck amp=1.0,fr=1.0,std_deck amp=1.0,fr=1.25,std_deck
Figure 9. Showing time histories of flows onto the main deck with a realistic form, for the standard configuration (case (1)) for 1.0 and 1.5 m amplitude waves.
Volume on deck time history for freeing ports with area increased by factor 1.6 and with deck. 0.00E+00 2.00E+00 4.00E+00 6.00E+00 8.00E+00 1.00E+01 1.20E+01 1.40E+01 1.60E+01
0.00E+00 2.00E+01 4.00E+01 6.00E+01 8.00E+01 1.00E+02 1.20E+02 1.40E+02
time (s) Volu me (cu . M) amp=1.0,fr=0.7,ar16_deck amp=1.0,fr=1.0,ar16_deck amp=1.0,fr=1.25,ar16_deck amp=1.5m,fr=0.7,a16_deck amp=1.5,fr=1.0,ar16_deck amp=1.5,fr=1.25,ar16_deck
Figure 10. Showing time histories of flows onto the main deck with a realistic form, for the increased area configuration (case (2)) for 1.0 and 1.5 m amplitude waves.
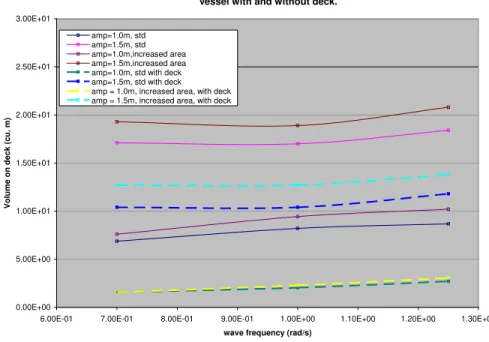
Steady state fluid volume on std deck with standard and greater area freeing ports, for fixed vessel with and without deck.
0.00E+00 5.00E+00 1.00E+01 1.50E+01 2.00E+01 2.50E+01 3.00E+01
6.00E-01 7.00E-01 8.00E-01 9.00E-01 1.00E+00 1.10E+00 1.20E+00 1.30E+00
wave frequency (rad/s)
Volume o n deck (cu . m) amp=1.0m, std amp=1.5m, std amp=1.0m,increased area amp=1.5m,increased area amp=1.0m, std with deck amp=1.5m, std with deck amp = 1.0m, increased area, with deck amp = 1.5m, increased area, with deck
Figure 11. Showing steady state volumes on the main deck with and without a realistic form, for the standard (case (1)) and the increased area configuration (case (2))
It is clear from figure 11 that there are similar variations of steady state volume relative to frequency. There are some differences between the standard and increased area configurations relative to wave amplitude. For the low amplitude wave, there is little difference between the volumes for the 2 configurations with the deck. For the higher wave amplitude, there is a somewhat greater difference between the configurations with the deck than without the deck. This is probably due to the fact that with the rake of the deck, there is less water leaving the aft freeing ports, although more leaving the forward freeing ports because of the greater head of water in that region.
4.2 Drainage Rates
Finally in this section with the vessel fixed, we look at drainage rates for the various configurations. As might be expected, the larger freeing ports clear the deck more rapidly and the sloping deck clears it more rapidly still. Figure 12 shows just how much difference there is between these configurations. The sloping deck is obviously a great asset in helping to clear the deck rapidly. The difference in drainage rates between the standard and the greater freeing port area cases is not that great. Increasing the length of the freeing port is more beneficial than a general increase in area. However as seen above, in the wave tests, there would likely be more water entering the vessel through the freeing ports when there is an increased area and so the effects of better drainage are to some extent negated. There is a difference in steady volumes between the 2 cases of increased area with the ‘increased area’ volume greater than the
‘increased length’ volume (see figure 6) which indicates that drainage rates may be somewhat more important than greater in-flow. Notice however that the ‘standard’ case freeing port configuration has the worst drainage but because it admits less water, it has the least mean volume of water on deck.
Comparisons of drainage from deck for various freeing port and deck arrangements. 0.00E+00 2.00E+00 4.00E+00 6.00E+00 8.00E+00 1.00E+01 1.20E+01 1.40E+01
0.00E+00 2.00E+01 4.00E+01 6.00E+01 8.00E+01 1.00E+02 1.20E+02 1.40E+02
time(s) volu me (cu .m .) std 10 1.6 x port length 1.6x area std 10, with deck 1.6x area, with deck
Figure 12. Showing drainage rates for a fixed vessel with 13 cu. m. of water on deck for various freeing port and deck configurations.
5.0 VESSEL FREE TO MOVE STUDIES
In the next set of cases the vessel is free to move. The motions are generally assumed to be in beam seas with wave heights of 4 and 5 m. There are some cases where greater heights are used to illustrate or emphasise a point. The wave height has to be greater in the case of free motions for the relative motions of deck edge and wave surface to be high enough for water entry through the freeing ports. It is assumed in this set of calculations that there is no water entry over the top of the bulwarks.
Table 3. Wave conditions used in free motion studies
Wave Amplitude (m) Wave Frequencies (rad/s)
2.0 0.7,1.0,1.25 2.5 0.7,1.0,1.25 3.0 1.0
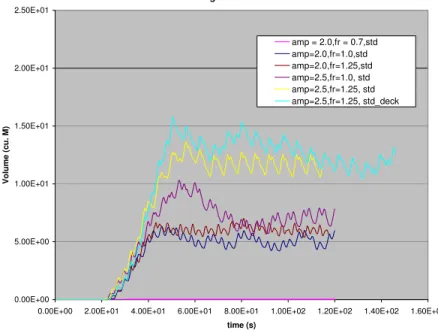
In figures 13-14, time histories of water on deck are shown for different freeing port configurations in different wave conditions.
Volume on deck time history for standard model with 10 freeing ports for vessel free to move in regular 4 and 5 m beam waves.
0.00E+00 5.00E+00 1.00E+01 1.50E+01 2.00E+01 2.50E+01
0.00E+00 2.00E+01 4.00E+01 6.00E+01 8.00E+01 1.00E+02 1.20E+02 1.40E+02 1.60E+02
time (s) V o lume ( c u . M) amp = 2.0,fr = 0.7,std amp=2.0,fr=1.0,std amp=2.0,fr=1.25,std amp=2.5,fr=1.0, std amp=2.5,fr=1.25, std amp=2.5,fr=1.25, std_deck
Figure 13. Showing time histories of water on deck for the standard model with the vessel free to move in waves of amplitude 2 and 2.5 m. Also shown is the case with a ‘deck’ for 2.5 m waves
with fr=1.25 rad/s.
Volume on deck time history for freeing ports with area increased by factor 1.6 for vessel free to move in 4 and 5 m regular beam waves
0.00E+00 5.00E+00 1.00E+01 1.50E+01 2.00E+01 2.50E+01
0.00E+00 2.00E+01 4.00E+01 6.00E+01 8.00E+01 1.00E+02 1.20E+02 1.40E+02
time (s) Vo lu me ( c u . M) amp = 2.0,fr = 0.7,std amp=2.0,fr=1.0,arx1.6 amp=2.0,fr=1.25, arx1.6 amp=2.5,fr=1.0, arx1.6 amp=2.5,fr=1.25,arx1.6 amp=2.5,fr=1.25,arx1.6_deck
Figure 14. Showing time histories of water on deck for the model with increased freeing port area with the vessel free to move in waves of amplitude 2 m and 2.5 m. Also shown is the case
Figure 15 below summarizes the steady or mean volumes of water on deck for these cases.
Steady state fluid volume on standard deck with (1)standard,(2)greater area freeing ports, for vessel free to move in 4 and 5 metre regular beam waves.
0.00E+00 2.00E+00 4.00E+00 6.00E+00 8.00E+00 1.00E+01 1.20E+01 1.40E+01
6.00E-01 7.00E-01 8.00E-01 9.00E-01 1.00E+00 1.10E+00 1.20E+00 1.30E+00
wave frequency (rad/s)
V o lu m e on de c k ( c u. m ) standard model,amp=2.0 freeing port area x 1.6,amp=2.0 standard model, amp=2.5 freeing port area x 1.6, amp=2.5
Figure 15. Showing steady state volumes of water on deck for the standard case (1) and for the increased area case (2) with the vessel free to move in regular waves of amplitude 2 m and 2.5
m.
Notice that in figures 13 and 14 there is no water on deck for the low frequency 0.7 rad/s. Clearly this is due to the particular roll of the vessel at this frequency. Case (3) is omitted here since it was clear from the fixed vessel study that there was little difference between the cases (2) and (3), with (2) allowing more water on deck.
5.1 The Effects of a Sloping Deck
In the next set of tests, the realistic form for the deck was employed for the vessel free to move. Figures 16 and 17 show time histories of water on deck for various wave conditions and for various freeing port configurations with a sloping deck.
Volume on deck time history for standard model with 10 freeing ports and a 'deck' for vessel free to move in regular 4 and 5 m beam waves.
0.00E+00 2.00E+00 4.00E+00 6.00E+00 8.00E+00 1.00E+01 1.20E+01 1.40E+01 1.60E+01
0.00E+00 2.00E+01 4.00E+01 6.00E+01 8.00E+01 1.00E+02 1.20E+02 1.40E+02
time (s) V o lu me ( c u . M) amp = 2.0,fr = 0.7 amp=2.0,fr=1.0,std amp=2.0,fr=1.25,std amp=2.5,fr=1.0, std amp=2.5,fr=1.25, std
Figure 16. Showing time histories of water on deck for the standard model with a deck for the vessel free to move in waves of amplitude 2 and 2.5 m.
Volume on deck time history for freeing ports with area increased by factor 1.6 and a 'deck' for vessel free to move in 4 and 5 m regular beam waves
0.00E+00 2.00E+00 4.00E+00 6.00E+00 8.00E+00 1.00E+01 1.20E+01 1.40E+01 1.60E+01 1.80E+01
0.00E+00 2.00E+01 4.00E+01 6.00E+01 8.00E+01 1.00E+02 1.20E+02 1.40E+02
time (s) V o lu me (c u . M) amp = 2.0,fr = 0.7 amp=2.0,fr=1.0,arx1.6 amp=2.0,fr=1.25, arx1.6 amp=2.5,fr=1.0,arx1.6 amp=2.5,fr-1.25,arx1.6
Figure 17. Showing time histories of water on deck for the model with increased freeing port area and a ‘deck’ with the vessel free to move in waves of amplitude 2 m and 2.5 m.
Steady state fluid volume on standard deck with (1)standard,and (2)greater area freeing ports with a 'deck', for vessel free to move in 4 and 5 metre regular beam waves.
0.00E+00 2.00E+00 4.00E+00 6.00E+00 8.00E+00 1.00E+01 1.20E+01 1.40E+01
6.00E-01 7.00E-01 8.00E-01 9.00E-01 1.00E+00 1.10E+00 1.20E+00 1.30E+00
wave frequency (rad/s) Vol um e on dec k (cu . m) standard model,amp=2.0 freeing port area x 1.6,amp=2.0 standard model, amp=2.5 freeing port area x 1.6, amp=2.5
Figure 18. Showing steady state volumes of water on deck for the standard case (1) and increased area case (2) with a ‘deck’ for the vessel free to move in waves of amplitude 2 m and
2.5 m.
It is apparent that the realistic form for the deck in general has no great effect on the steady state volumes when the vessel is free to move. From figures 16 and 18 it is also clear that there might be some differences in the initial stages of flooding – the realistic deck appears to sometimes allow greater volumes on deck before dispersing and reaching a similar steady state to the standard deck case. The greater freeing port area also appears in general to have a small effect on the steady state volumes. The greatest steady volume on deck occurs for the case with no sloping deck for the wave of amplitude 2.5 m and frequency 1.25 rad/s for the increased area freeing ports.
5.2 Vessel Motions
The motions of the vessel are significantly affected by the water on deck when large amounts of water are present. This would be the case when the wave frequency and wave
amplitude have their greatest values (in this study). The graphs below show the effects on heave, roll, pitch and yaw of water entering the main deck through freeing ports. The results are
compared to the motions where there are no freeing ports and the vessel geometry extends only up to the main deck. The time history of the motions shown below are for the initial stages
Heave motions for vessel with and without freeing ports in 5 m regular beam waves -3 -2 -1 0 1 2 3 20 30 40 50 60 70 80 time (s) hea ve (m ) amp=2.5,fr=1.25, no fprt amp=2.5,fr=1.25,arx1.6 amp=2.5,fr=1.25,arx1.6,with deck amp=2.5,fr=1.25,std amp=2.5,fr=1.25,std,with deck
Figure 19. Showing heave motions of the vessel with and without freeing ports in 2.5 m amplitude regular beam waves of frequency 1.25 rad/s. Also shown are the motions when there
is a ‘deck’ for the standard and the increased area cases.
Roll motions for vessel with and without freeing ports in regular 5 m beam waves
-40 -30 -20 -10 0 10 20 30 40 20 30 40 50 60 70 80 time (s) Roll (degrees) amp=2.5,fr=1.25, no fprt amp=2.5,fr=1.25,arx1.6 amp=2.5,fr=1.25,arx1.6,with deck amp=2.5,fr=1.25,std amp=2.5,fr=1.25,std,with deck
Figure 20. Showing roll motions of the vessel with and without freeing ports in 2.5 m amplitude regular beam waves of frequency 1.25 rad/s. Also shown are the motions when there is a ‘deck’
Pitch motions for vessel with and without freeing ports in 5 m regular beam waves -10 -8 -6 -4 -2 0 2 4 6 8 10 20 30 40 50 60 70 80 time (s) Pit ch ( deg rees) amp=2.5,fr=1.25, no fprt amp=2.5,fr=1.25,arx1.6 amp=2.5,fr=1.25,arx1.6,with deck amp=2.5,fr=1.25,std amp=2.5,fr=1.25,std,with deck
Figure 21. Showing pitch motions of the vessel with and without freeing ports in 2.5 m amplitude regular beam waves of frequency 1.25 rad/s. Also shown are the motions when there
is a ‘deck’ for the standard and increased area cases.
Yaw motions for vessel with and without freeing ports in 5 m regular beam waves
-30 -20 -10 0 10 20 30 40 20 30 40 50 60 70 80 time (s) Yaw ( d egrees) amp=2.5,fr=1.25, no fprt amp=2.5,fr=1.25,arx1.6 amp=2.5,fr=1.25,arx1.6,with deck amp=2.5,fr=1.25,std amp=2.5,fr=1.25,std,with deck
Figure 22. Showing yaw motions of the vessel with and without freeing ports in 2.5 m amplitude regular beam waves of frequency 1.25 rad/s. Also shown are the motions when there is a ‘deck’
The final figure here (figure 22) offers a partial explanation for some of the motions of the vessel without freeing ports. The vessel moves away from the beam position in order to maintain dynamic equilibrium. This results in quite significant pitch motions, which are quite different from the pitch motions with water on deck. The pitch motions with water on deck show a mean trim by the stern (positive pitch is bow down) , which is not surprising, since the water on deck is near the stern. The pitch motions have less trim by the stern when the ‘deck’ is used in the simulations. This again is not surprising, given the rake of the deck. The roll motions are significantly reduced when there is water on deck. This reduction in roll would be even more apparent if the vessel had stayed beam onto the waves for the case when there were no freeing ports. The heave motion is relatively unchanged by water on deck, although the mean heave is reduced by about 10 cm with water on deck. This reduces the freeboard by about 12%.The motions in general all differ to a lesser or greater degree according to the freeing port and deck configurations. Apart from the obvious remarks made above, the differences between the motions in the different modes are not so easily explained except for the general statement that the differences of the flow on the deck for the different configurations affect the motions and the motions affect the flow.
5.3 Discharge coefficient
The modeling for the freeing port hydrodynamics is based on a simple model of the Bernoulli law. The pressure head at the freeing port determines the flow velocity, which in turn determines the rate of flow into or out of the vessel. The geometry of the freeing port also determines the flow rate. This is modeled using the discharge coefficient (Dc) (see equation (1) above). In the calculations up to this point, Dc has been taken to be 1.0. This, to some extent gives a worse case scenario, in that more water will likely enter the vessel on average.This is illustrated in the following calculations for the case where steady state volumes for Dc=0.85 are compared to those for Dc=1.0 (the default value). It is illustrated for the case of the increased freeing port area. Similar results are obtained for the standard freeing port configuration. It is clear that for the higher frequency (1.25) there is a similar build up of water on deck with a smaller discharge coefficient and similar steady state values. In the case of the frequency 1.0, there is much less initial build up with Dc=0.85.
Volume on deck time history for freeing ports with area increased by factor 1.6 for vessel free to move in 5 m regular beam waves showing comparisons with dc=0.85 case.
0.00E+00 5.00E+00 1.00E+01 1.50E+01 2.00E+01 2.50E+01
0.00E+00 2.00E+01 4.00E+01 6.00E+01 8.00E+01 1.00E+02 1.20E+02 1.40E+02
time (s) Vo lu m e ( c u . M ) amp=2.5,fr=1.0, arx1.6 amp=2.5,fr=1.25,arx1.6 amp=2.5,fr=1.0,arx1.6,dc=0.85 amp=2.5,fr=1.25,arx1.6,dc=0.85
Figure 23. Showing time histories of volumes on deck for the increased freeing port area configuration, using discharge coefficient of 0.85 compared to the default value(1.0). The wave
amplitude is 2.5 m and the frequencies used are 1.25 rad/s and 1.0 rad/s.
5.4 Water Ingress over Bulwarks
In the modeling described above, water enters the main deck area through the freeing ports. It has been assumed that the water coming over the bulwarks is not significant. For the 4 m waves, this is a reasonable assumption. However the 5 m waves are very steep (steepness 1 in 8) and the likelihood of over-spilling becomes quite significant. A modeling similar to that for the freeing ports is employed. That is, that part of the vessel above the bulwarks where the waves are likely to over-spill is divided into a series of thin panels that represent fluid sources (or sinks). As with the freeing ports, the flow through these panels is determined by the relative pressure head over these panels. That part of the ‘study’ vessel where that would happen lies approximately between the stern (-10 m from amidships) and -7.0 m from amidships (see figures 1 and 2).The height of the bulwarks is 1.2 m. For the freeing port modeling, the wave velocity at the freeing ports is not likely to be significant because of diffraction effects in the surrounding hull. For the bulwark over-spill modeling, it may be more significant. For the sake of simplicity, the wave
velocity has been ignored in this case too. In fact, as will be seen below, much of the ingress over the bulwarks is on the lee side of the vessel, which would make the task of determining the wave velocity quite problematical. The cases considered below are for the standard freeing port configuration and the increased area case at a wave amplitude of 2.5 m and frequency 1.25 rad/s. There are also results for the case of waves of amplitude 3.0m and frequency 1.0 rad/s.
Volume on deck time history for standard model with 10 freeing ports for vessel free to move in regular 5 m beam waves with waves over bulwarks.
0.00E+00 5.00E+00 1.00E+01 1.50E+01 2.00E+01 2.50E+01
0.00E+00 2.00E+01 4.00E+01 6.00E+01 8.00E+01 1.00E+02 1.20E+02 1.40E+02
time (s) V o lume (cu. M ) amp=2.5,fr=1.25, std amp=2.5,fr=1.25,std with blwk amp=3.0,fr=1.0,std with blwk
Figure 24. Showing time histories of volume on deck for the standard configuration with and without bulwarks in regular 2.5 m beam waves (freq=1.25 rad/s). Also shown is the case for 3 m
waves (freq=1.0 rad/s) with bulwarks for the standard configuration.
With the standard configuration, the extra water flowing over the bulwarks appears less likely to be dispersed. The standard configuration appears to give somewhat poorer results in terms of the steady state volume compared to the increased area configuration. Notice that for the 3 m wave (frequency,1.0) the initial build up of water on deck is quite similar to that for the lower wave (frequency, 1.25), but the dispersion of the water is much more rapid and the final steady state volumes are lower (see figures 24-25).
Volume on deck time history for freeing ports with area increased by factor 1.6 for vessel free to move in 5 m regular beam waves with waves over bulwarks
0.00E+00 5.00E+00 1.00E+01 1.50E+01 2.00E+01 2.50E+01
0.00E+00 2.00E+01 4.00E+01 6.00E+01 8.00E+01 1.00E+02 1.20E+02 1.40E+02
time (s) Volume (cu. m) amp=2.5,fr=1.25,arx1.6 amp=2.5,fr=1.25,arx1.6 with blwk amp=2.5,fr=1.25,std with blwk amp=3.0,fr=1.0,arx1.6 with blwk amp=3.0,fr=1.0,std with blwk
Figure 25. Showing time histories of volume on deck for the standard and increased area configuration with and without bulwarks in regular 2.5 m beam waves (freq=1.25 rad/s). Also
shown are results for 3.0 m waves of frequency 1.0 rad/s .
Roll motions for vessel with and without freeing ports in regular 5 m beam waves taking into account waves over bulwarks
-30 -20 -10 0 10 20 30 20 30 40 50 60 70 80 Ro ll ( degrees) time (s) amp=2.5,fr=1.25, no fprt amp=2.5,fr=1.25,arx1.6 amp=2.5,fr=1.25,std amp=2.5,fr=1.25,std,with blwk amp=2.5,fr=1.25,arx1.6,with blwk
Pitch motions for vessel with and without freeing ports in 5 m regular beam waves taking into account waves over bulwarks.
-10 -8 -6 -4 -2 0 2 4 6 8 10 20 30 40 50 60 70 80 time (s) Pit ch ( d eg rees) amp=2.5,fr=1.25, no fprt amp=2.5,fr=1.25,arx1.6 amp=2.5,fr=1.25,std amp=2.5,fr=1.25,std,with blwk amp=2.5,fr=1.25,arx1.6,with blwk
Figure 27. Showing pitch motions with and without bulwark over-spill for the standard and increased area configurations in 2.5 m beam waves, frequency 1.25 rad/s
The motions are also different with the bulwark wave over-spill included. Heave changes the least. Roll and pitch are shown in figures 26 and 27. The pitch motions show a particularly large excursion to -8 degrees (stern down) in the 50-70 s range when there is water entering the deck over the bulwarks (at the stern)
5.5 Flow Rates
The flow rates through freeing ports and over the bulwarks obviously depend on wave amplitude and frequency as well as the size of the freeing ports. Qualitatively the results shown below are quite similar for other wave amplitudes and frequencies. Flow through freeing ports onto the deck is greater on the lee side, as is the flow over the bulwarks. This is principally related to the phase of the motions relative to the waves. The flow off the deck appears to be greatest on the weather side. This has been bourn out in a number of other simulations of which these are just a sample.
The first figures (28 and 29) compare the standard freeing port configuration to the increased area one on lee and weather sides. A positive flow rate indicates a flow onto the deck
Flow rate from a Freeing Port near amidships on weather side in 2.5 m beam waves. -4.00E-01 -3.00E-01 -2.00E-01 -1.00E-01 0.00E+00 1.00E-01 2.00E-01 3.00E-01 4.00E-01
0.00E+00 2.00E+01 4.00E+01 6.00E+01 8.00E+01 1.00E+02 1.20E+02 1.40E+02
time (s) flow ra te (cu.m ./s) amp=2.5,fr=1.25,std with blwk amp=2.5,fr=1.25,arx1.6 with blwk
Figure 28. Showing flow rates through a freeing port near amidships on the Weather side for the standard and increased area configurations in 2.5 m beam waves.
Flow rate from a Freeing Port near amidships on Lee side in 2.5 m beam waves.
-4.00E-01 -3.00E-01 -2.00E-01 -1.00E-01 0.00E+00 1.00E-01 2.00E-01 3.00E-01 4.00E-01 5.00E-01
0.00E+00 2.00E+01 4.00E+01 6.00E+01 8.00E+01 1.00E+02 1.20E+02 1.40E+02
time (s) flow ra te (cu.m ./s) amp=2.5,fr=1.25,std with blwk amp=2.5,fr=1.25,arx1.6 with blwk
Figure 29. Showing flow rates through a freeing port near amidships on the Lee side for the standard and increased area configurations in 2.5 m beam waves
Flow rate from a Freeing Port near amidships on Lee and Weather sides in 2.5 m beam waves for increased area configuration.
-4.00E-01 -3.00E-01 -2.00E-01 -1.00E-01 0.00E+00 1.00E-01 2.00E-01 3.00E-01 4.00E-01 5.00E-01
0.00E+00 2.00E+01 4.00E+01 6.00E+01 8.00E+01 1.00E+02 1.20E+02 1.40E+02
time (s) flow ra te (cu.m ./s)
amp=2.5,fr=1.25,arx1.6 on lee side amp=2.5,fr=1.25,arx1.6 on weather side
Figure 30. Showing flow rates through a freeing port near amidships on the Lee side and
Weather side for the increased area configuration in 2.5 m beam waves
Flow rate over bulwark near stern on Lee and Weather sides in 2.5 m beam waves.
-2.00E-01 -1.00E-01 0.00E+00 1.00E-01 2.00E-01 3.00E-01 4.00E-01 5.00E-01 6.00E-01
0.00E+00 2.00E+01 4.00E+01 6.00E+01 8.00E+01 1.00E+02 1.20E+02 1.40E+02
time (s) flow ra te (cu.m ./s)
amp=2.5,fr=1.25 on weather side amp=2.5,fr=1.25 on lee side
Notice that there is very little flow back over the bulwarks. This is quite hard to model. The figure actually shows flow through a particular panel representing a portion of the flow over the bulwarks . So the rates of flow indicated in figure 31 do not represent the total flow over the bulwarks. The total flow rate is probably closer to 2-3 times the value shown.
5.6 Longer Deck and Freeing Ports moved Forward
There are some 65 foot fishing vessels that have a full shelter deck and a shorter foc’sle deck. In the following set of calculations the deck is taken to be 3 m longer (from (-10 m to 5m) and the freeing ports are moved forward by 2 m as compared to the standard model. There is no flow over the bulwarks considered in these calculations.
Volume on deck time history for freeing ports further forward on a longer deck for vessel free to move in 5 m regular beam waves
0.00E+00 5.00E+00 1.00E+01 1.50E+01 2.00E+01 2.50E+01
0.00E+00 2.00E+01 4.00E+01 6.00E+01 8.00E+01 1.00E+02 1.20E+02 1.40E+02
time (s) Volu me (cu. m ) amp=2.5,fr=1.25,arx1.6 amp=2.5,fr=1.25,lng_dk,arx1.6 amp=2.5,fr=1.25,lng_dk,std
Figure 32. Showing time histories of water on deck for the long deck configuration with both standard and increased area freeing ports moved forward in 2.5 m regular beam waves. The
results for the ‘short’ deck with increased area freeing ports are also shown.
The results show a greater volume of water on deck for the longer deck when the freeing ports have an increased area. For the standard area freeing ports with the longer deck, there appears to be a slower build up of water on deck, that decreases rather more than the 2 other cases shown. This latter remark appears to be somewhat counterintuitive since it would be
take into account the motions of the vessel with a substantial quantity of water on deck, and of course more water can flow onto the deck through the larger freeing ports. The ingress of water is still predominantly on the lee side although more water appears to leave on the weather side.
Roll and pitch motions are shown below. The roll motions are mainly modified in the transient portion of the record with the longer deck. The pitch motions with the standard freeing ports seem most altered by the longer deck. Presumably that is associated with the reduced volume of water on deck towards the stern, even though there is more water on deck in total. However that effect is less noticeable for the increased area freeing ports, possibly because there is not such an increase in water on deck with a longer deck.
Roll motions for vessel with and without freeing ports in regular 5 m beam waves, comparisons with long deck configuration.
-40 -30 -20 -10 0 10 20 30 40 20 30 40 50 60 70 80 time (s) Ro ll ( degrees) amp=2.5,fr=1.25, no fprt amp=2.5,fr=1.25,arx1.6 amp=2.5,fr=1.25,std amp=2.5,fr=1.25,std_lng_dk amp=2.5,fr=1.25,ar1.6_lng_dk
Figure 33. Showing time histories of roll motion for the long deck configuration with both standard and increased area freeing ports moved forward in 2.5 m regular beam waves. The
Pitch motions for vessel with and without freeing ports in 5 m regular beam waves -10 -8 -6 -4 -2 0 2 4 6 8 10 20 30 40 50 60 70 80 time (s) P itch ( d egrees) amp=2.5,fr=1.25, no fprt amp=2.5,fr=1.25,arx1.6 amp=2.5,fr=1.25,std amp=2.5,fr=1.25,std_lng_dk amp=2.5,fr=1.25,ar1.6_lng_dk
Figure 34. Showing time histories of pitch motion for the long deck configuration with both standard and increased area freeing ports moved forward in 2.5 m regular beam waves. The
results for the standard and increased area cases are also shown.
5.7 Longer Deck and More Freeing Ports
With the longer deck there is likely to be a longer length of bulwark or at least a greater length of the ship which is not strictly watertight at the level of the main deck (for example crab doors may not necessarily be watertight). It would therefore be reasonable to increase the
number of freeing ports or their area for such a deck. The number of freeing ports is increased to 16 (8 per side). The calculations of the water on deck are performed for the case of 5 m high regular beam waves at a frequency of 1.25 rad/s. The results show that for the standard size freeing ports, there is a decrease in mean volume of water on deck when there are 16. If the freeing port areas are increased by a factor of 1.6, the mean volume increases somewhat and there is a noticeable increase in the variation of volume about the mean. This variation also happens for the configuration with 10 freeing ports, but is less noticeable.
The calculations are repeated for higher waves (3.0 m amplitude) but at a lower
frequency (1.0 rad/s). There are similar qualitative trends as noted above. It is quite clear (figure 36) that for the larger total freeing port area (16 ports of area 1.6x standard area), there is a greater initial build up, greater oscillations, but a similar mean. The lowest mean is obtained for the 16 freeing ports of standard area for both wave conditions.
Volume on deck time history for freeing ports further forward on a longer deck for vessel free to move in 5 m regular beam waves
0.00E+00 5.00E+00 1.00E+01 1.50E+01 2.00E+01 2.50E+01
0.00E+00 2.00E+01 4.00E+01 6.00E+01 8.00E+01 1.00E+02 1.20E+02 1.40E+02
time (s) Volum e (cu. m ) amp=2.5,fr=1.25,arx1.6 amp=2.5,fr=1.25,lng_dk,arx1.6 amp=2.5,fr=1.25,lng_dk16,std amp=2.5,fr=1.25,lng_dk16,arx1.6
Figure 35. Showing time histories of water on deck for the long deck configuration with both 10 and 16, standard and increased area, freeing ports in regular 2.5 m beam waves (freq=1.25 rad/s).
Also shown are the results for the ‘short deck’.
Time history of volume on deck for 6 m high waves at frequency 1.0 for various long deck configurations. 0.00E+00 2.00E+00 4.00E+00 6.00E+00 8.00E+00 1.00E+01 1.20E+01 1.40E+01 1.60E+01 1.80E+01 2.00E+01
0.00E+00 2.00E+01 4.00E+01 6.00E+01 8.00E+01 1.00E+02 1.20E+02 1.40E+02
time (s) volu me (cu. m ) amp=3.0,fr=1.0,lng_dk10_std amp=3.0,fr=1.0,lng_dk16_ar1.6 amp=3.0,fr=1.0,lng_dk16_std
Figure 36. Showing time histories of water on deck for the long deck configuration with both 10 and 16, standard and increased area, freeing ports in regular 3.0 m beam waves of frequency 1.0
5.8 Freeing Ports with Flaps
Although it is beyond the scope of the present project to examine ways of efficiently controlling the in-flow versus the out-flow of sea water at the freeing ports, an indication of the effect of such control is illustrated in the next calculation where the in-flow is artificially
restricted by decreasing the discharge coefficient for the in-flow to a low value (0.2) but keeping the out-flow coefficient at 1.0. This modeling in some ways approximates the use of exterior flaps on freeing ports. In this calculation water enters the deck area primarily over the bulwarks.
The graph (figure 37) shows clearly that the amount of build up in both cases is very high in the initial transient period of the motion. The larger freeing ports are shown to bring the situation under control more rapidly. The roll motions due to the build up of water coming over the bulwarks are quite high as shown in figure 38 and continue for longer in the case of the smaller freeing ports.
Time history of volume on deck with bulwarks for 5 m high waves at frequency 1.25 for freeing ports fitted with flaps
0.00E+00 5.00E+00 1.00E+01 1.50E+01 2.00E+01 2.50E+01
0.00E+00 2.00E+01 4.00E+01 6.00E+01 8.00E+01 1.00E+02 1.20E+02 1.40E+02
time (s) vo lum e ( c u. m) amp=2.5,fr=1.25,std_mod,blwk amp=2.5,fr=1.25,ar1.6_mod,blwk
Figure 37. Showing time history of water on deck with bulwarks for freeing ports of different area fitted with ‘flaps’ in 2.5 m beam waves at 1.25 rad/s.
Roll motions for vessel with and without freeing ports with flaps in regular 5 m beam waves with flow over bulwarks
-40 -30 -20 -10 0 10 20 30 40 20 30 40 50 60 70 80 time (s) R o ll ( d egrees) amp=2.5,fr=1.25, no fprt amp=2.5,fr=1.25,std_mod,blwk amp=2.5,fr=1.25,ar1.6_mod,blwk
Figure 38. Showing time histories of roll motions for freeing ports with flaps compared to no freeing ports, in 2.5 m beam waves at frequency of 1.25 rad/s
6.0 SUMMARY AND CONCLUSIONS
To clear water from decks as rapidly as possible, it is preferable to have more or greater area freeing ports (see figure 12). Sloping decks are also to be recommended. However if there are no devices fitted to freeing ports to restrict in-flow, having larger area freeing ports will allow more water to enter the deck area. In this case, there may be a greater build up of water on deck before it starts to drain and reach a relatively stable amount. In fact the final ‘steady state’ volumes are quite similar for all the configurations considered in a given wave system. The wave system is obviously an important factor , with steeper waves causing greater flooding. Lower frequency waves allow more water to drain even though the initial build up of water is may be greater than for comparable steepness waves (see figure 25). Frequency dependence is a more complex phenomenon since not only does it alter the incidence of water entering the deck area, but it also changes the roll response of the vessel. The steady state volumes reached in the above simulations are associated with steady state roll of the vessel. If the waves are steep enough the
buildup of water on deck continues and no steady roll is reached and the vessel capsizes (see figure 39)
Time history of volume on deck for 7.6 m high waves at frequency 0.9
0.00E+00 1.00E+01 2.00E+01 3.00E+01 4.00E+01 5.00E+01 6.00E+01 7.00E+01 8.00E+01
0.00E+00 1.00E+01 2.00E+01 3.00E+01 4.00E+01 5.00E+01 6.00E+01 7.00E+01 8.00E+01 9.00E+01 1.00E+02
time (s) vol um e (cu. m ) amp=3.8,fr=0.9,lng_dk16_ar1.6 amp=3.8,fr=0.9,lng_dk16_std
Figure 39. Showing time history of volume on deck for the long deck with 16 freeing ports of standard and increased area in 3.8 m waves at a frequency of 0.9 rad/s.
Notice that even though there is a much greater volume of water built up on deck with the larger freeing ports, capsize still occurs at about the same time!
Probably the most convincing case for the larger freeing port area can be made based on figure 37 that shows how the combination of effective flow control and large freeing port area reduces the time for which there is a significant danger of overwhelming flooding. The question remains as to how reliable devices for flow control really are. The simple flap mechanisms used on many fishing vessels are effective devices but unless they are carefully designed and
maintained, they will not always be reliable.
The table 4 below summarizes a number of the free motion simulation results. Only one set of wave conditions has been considered in this table, namely the 5 m high waves of period 5.2 s –these give the greatest volumes of water on deck without leading to capsize. In the table, the maximum volume on deck is the volume achieved in the initial stages of the motions (the transient stage). The ‘mean volume’ relates to the ‘steady’ state reached for which there is an
oscillation about a mean. The amplitudes of oscillation increase with increase in total area of freeing ports.
Table 4. Showing Maximum and Mean Volumes of water on deck for the configurations considered in the simulations in 2.5 m regular beam waves at a frequency of 1.25 rad/s
Freeing Port Configuration
Maximum
(m
3)
Mean (m
3)
10 Standard area freeing ports 13.5 11.5
10 increased area freeing ports 14.2 13.1
10 Standard area freeing ports with sloping deck 15.6 11.5 10 increased area freeing ports with sloping deck 17.0 11.5 10 standard area freeing ports moved forward on longer deck 16.3 13.7 10 increased area freeing ports moved forward on longer deck 16.7 14.1 16 standard area freeing ports on longer deck 15.0 12.1 16 increased area freeing ports on longer deck 16.3 12.5 10 standard area freeing ports with bulwarks 17.5 16.1 10 increased area freeing ports with bulwarks 19.2 14.4 10 standard freeing ports with bulwarks and flaps 23.0 11.6 (?) 10 increased area freeing ports with bulwarks and flaps 23.0 11.6
Although the steady state means are quite similar there are some differences that can be observed.
(1) Increasing the area of the freeing ports generally leads to greater maxima and greater means. (2) If there is a sloping deck, increasing the area of the freeing ports increases the maxima but not the mean. The mean may be decreased.
(3) Longer decks allow greater maxima and greater means unless the number of freeing ports is increased from 10 to 16. With 16 freeing ports, increasing the area increases the maximum but the mean, only by a small amount. Clearly 16 freeing ports are better than 10 on a longer deck since the water on deck is more likely to ‘find’ one to exit by.
not increase as much for the increased area case. This presumably is because of better drainage of the bulwark over-spill.
(5) For the case of flaps the maximum in the table is misleading since for the standard case, the large volume of water in the initial stages persists for longer. The estimate for the steady state mean for the standard case is based on a ‘guesstimate’ and is only included to illustrate that the volumes on deck tend in the same direction which is similar to the levels for other
configurations.
The table 5 below shows similar results for a restricted number of freeing port
configurations for the case of wave amplitude 3.0m for wave frequency 1.0 rad/s. These waves are somewhat less steep than the previous waves (1in 10) in table 4.
Table 5. Showing Maximum and Mean Volumes of water on deck for the configurations considered in the simulations in 3.0 m regular beam waves at a frequency of 1.0 rad/s.
Freeing Port Configuration
Maximum
(m
3)
Mean (m
3)
10 standard area freeing ports moved forward on longer deck 14.6 11.216 standard area freeing ports on longer deck 17.1 10.0 16 increased area freeing ports on longer deck 18.9 11.1 10 standard area freeing ports with bulwarks 19.7 9.0 10 increased area freeing ports with bulwarks 19.1 10.0
The maxima for this frequency wave are generally a lot higher than for the waves in table 3, but the means are smaller. The initial higher volumes are due to the higher waves and the lower means are associated with the lower frequency. Even with the bulwarks the means are lower. The means are generally lower on the shorter deck as before. For the longer deck, the best case is for the 16 standard area freeing ports.
There are always more questions that can be asked in any scientific investigation. A problem with the complexity of the numerical simulations carried out in this study is the time taken for the results to be obtained. In the free motion studies, the simulation times were
has to be rerun. Crashes are not unusual when investigating extreme phenomena. Sometimes when the flow contact on the hull and deck becomes extreme the mesh size has to be adjusted to smooth out the event – that generally means increasing the mesh size in the region of the event. The simulations were in nearly all cases halted after 120 s. As time progresses the build up of errors increases. For example the volume of water tracked will start to increase beyond a level that would be considered reasonable for reliable results.
Further studies are recommended. It will be necessary to ‘validate’ or ‘calibrate’ the numerical model experimentally. Qualitatively the conclusions may be valid but quantitatively they may not be. The easiest way to part-validate the modeling would be to perform tests in waves on a fixed vessel and compare the results with those in the fixed vessel simulations. The fixed vessel simulations give results which reflect some of those characteristics noted in the free motions studies. For example, dependence on frequency and wave amplitude, the effects of increasing freeing port area and the effects of a sloping deck show similar trends for the moving vessel cases. Of course in all these cases for the fixed vessel, there is no way to evaluate the initial transients that occur in the free motion studies.