Publisher’s version / Version de l'éditeur:
The Journal of Physical Chemistry C, 119, 30, pp. 17029-17038, 2015-05-26
READ THESE TERMS AND CONDITIONS CAREFULLY BEFORE USING THIS WEBSITE.
https://nrc-publications.canada.ca/eng/copyright
Vous avez des questions? Nous pouvons vous aider. Pour communiquer directement avec un auteur, consultez la
première page de la revue dans laquelle son article a été publié afin de trouver ses coordonnées. Si vous n’arrivez pas à les repérer, communiquez avec nous à PublicationsArchive-ArchivesPublications@nrc-cnrc.gc.ca.
Questions? Contact the NRC Publications Archive team at
PublicationsArchive-ArchivesPublications@nrc-cnrc.gc.ca. If you wish to email the authors directly, please see the first page of the publication for their contact information.
NRC Publications Archive
Archives des publications du CNRC
This publication could be one of several versions: author’s original, accepted manuscript or the publisher’s version. / La version de cette publication peut être l’une des suivantes : la version prépublication de l’auteur, la version acceptée du manuscrit ou la version de l’éditeur.
For the publisher’s version, please access the DOI link below./ Pour consulter la version de l’éditeur, utilisez le lien DOI ci-dessous.
https://doi.org/10.1021/acs.jpcc.5b00513
Access and use of this website and the material on it are subject to the Terms and Conditions set forth at
Long-lived LMCT in a d0 Vanadium(V) complex by internal conversion
to a state of 3dxy character
Choing, Stephanie N.; Francis, Aaron J.; Clendenning, Graham; Schuurman,
Michael S.; Sommer, Roger D.; Tamblyn, Isaac; Weare, Walter W.; Cuk,
Tanja
https://publications-cnrc.canada.ca/fra/droits
L’accès à ce site Web et l’utilisation de son contenu sont assujettis aux conditions présentées dans le site LISEZ CES CONDITIONS ATTENTIVEMENT AVANT D’UTILISER CE SITE WEB.
NRC Publications Record / Notice d'Archives des publications de CNRC:
https://nrc-publications.canada.ca/eng/view/object/?id=5da554e5-7ac2-43d0-bfc9-07b668c650eb https://publications-cnrc.canada.ca/fra/voir/objet/?id=5da554e5-7ac2-43d0-bfc9-07b668c650eb
Long-Lived LMCT in a d
0
Vanadium(V) Complex by Internal
Conversion to a State of 3d
xy
Character
Stephanie N. Choing,
†Aaron J. Francis,
‡Graham Clendenning,
¶Michael S. Schuurman,
§Roger D. Sommer,
‡Isaac Tamblyn,
¶Walter W. Weare,
‡and Tanja Cuk*
,†,∥†
Department of Chemistry, University of California, Berkeley, California, United States
‡
Department of Chemistry, North Carolina State University, Raleigh, North Carolina, United States
¶
Department of Physics, University of Ontario Institute of Technology, Oshawa, Ontario, Canada
§
National Research Council, Ottawa, Canada
∥
Chemical Sciences Division, Lawrence Berkeley National Laboratory, Berkeley, California, United States
*
S Supporting InformationABSTRACT: The excited state dynamics of a d0vanadium(V) oxido
ligand-to-metal charge transfer (LMCT) complex, VOLF, were investigated via a
combination of static optical and X-ray absorption (XAS) spectroscopy, transient optical absorption spectroscopy, and time-dependent density functional theory (TD-DFT). Upon excitation of the LMCT in the visible region, transient absorption data reveal that internal conversion traps the excited carrier population into a long-lived charge transfer state of 3dxy electron character, S1(dxy). The
internal conversion is substantiated by an isosbestic point in the transient absorption data, two nearby charge transfer states that couple well by TD-DFT, multiple rates in the ground state recovery, and the decay kinetics of an excited state absorption with the energy of a d-d transition in O K-edge XAS spectra. The long lifetime (∼420 ps) of S1(dxy) can be ascribed to its poor optical and
vibrational coupling to a distorted ground state (S0*) via a negligible electronic
dipole transition in TD-DFT. The lack of luminescence or an identifiable triplet
state also suggests attributing the lifetime to electronic contributions. In conjunction with its strong visible absorption and reduction potential, the long-lived LMCT suggests that molecules such as VOLF could have potential utility for energy
conversion applications. Moreover, the results show that internal conversion between two nearby charge transfer states, differentiated by their 3d character, can form a long-lived charge transfer excitation, broadly informing the discovery of 3d metal-centered optical absorbers with long-lived charge transfer lifetimes.
■
INTRODUCTIONMolecules and nanostructures exhibiting long-lived, optically accessible charge transfer excitations are desirable for a number of applications including energy conversion, photocatalysis, and chemical sensing. Ideal chromophores have tunable absorption profiles (e.g., for matching to the solar spectrum) and excited state lifetimes similar to or longer than the characteristic electron transfer rates to catalysts or reactants. For the past half-century, metal-to-ligand charge transfer (MLCT) processes in a vast range of pi-acceptor ligated, low-valent metal oxido,1 nitrido,2alkylidyne,3peroxo,4cyclopentadienyl, benzene,
cyclo-heptatrienyl, pyridyl, and phosphine complexes have been an area of extensive study.1Owing to relatively long, visible light-induced MLCT lifetimes, the archetypal Ru(bpy)32+ (with a
lifetime of 890 ns in acetonitrile5) and derivatives thereof, as well as polypyridyl derivatives of other metals (e.g., Os, Fe, Co, Rh, Pt, and Ir), have been investigated as systems for photophysical studies,6−9 photosensitizers in solar energy
conversion systems,10and potent excited state single-electron reductants for catalytic photon-driven organic
transforma-tions.11Substituting the metal center with an earth abundant,
3d transition metal has been a focus for applications, both due to scalability and the importance of 3d transition metals to catalysis. For all of these alternatives, transient optical spectroscopy observes short, picosecond excited state lifetimes9 [e.g., Fe(bpy)312 and Fe((NHC)2pyridine)213]. The much
shorter lifetimes in the Fe-based compounds have been attributed to fast decay into low-lying metal-centered excited states.9,12−15Recently, the same phenomena has been observed
in solid-state materials.16The only complexes that have both a 3d metal center and a longer-lived MLCT state contain a 3d10
Cu ground state, in which such low-lying states are not present due to the filled d-block.17,18
Here, we consider visible LMCT excited state dynamics in solution of an equatorially distorted C3v vanadium(V) oxido
chelate, VOLF, bearing a tetradentate aminophenol ligand, Received: January 17, 2015
Revised: May 22, 2015
Published: May 26, 2015
Article
pubs.acs.org/JPCC
© 2015 American Chemical Society 17029 DOI: 10.1021/acs.jpcc.5b00513 J. Phys. Chem. C 2015, 119, 17029−17038
through static optical and X-ray absorption, transient optical spectroscopy, and multiple levels of electronic structure theory. Similar to the Cu-based MLCT chromophores, this 3d0
complex does not contain purely metal-centered excited states that could shorten the LMCT lifetime due to its empty d-block. The advantage of studying an LMCT-based d0chromophore is
that the excited states are primarily of LMCT character, with single electron occupation of a V d orbital and a hole on the ligand.
The transient optical data at timescales longer than a picosecond reveal an internal conversion between two nearby charge transfer states. Within the LMCT absorption, VOLFhas
two relevant charge transfer states that can couple to each other, as shown in the scheme of Figure 1, S3(dyz) and S1(dxy),
where the character of the excited electron is denoted to differentiate the states. S2does not couple well to either state in
the relaxed geometry due to strong symmetry considerations, described below. The internal conversion is identified in the transient optical data by an isosbestic point, multiple rates in the ground state recovery, and the decay kinetics of excited state absorption to higher lying LMCT states [Sn(d)]. The
energy of the transition to the lowest lying Sn(d) from the
initially excited LMCT are calibrated with XAS of the O K-edge. With the use of time-dependent density functional theory (TD-DFT) and multireference second-order perturbation theory (MSCASPT2), the long lifetime of S1 (dxy) (420 ps)
is ascribed to poor optical and vibrational coupling of the occupied 3dxy orbital to a distorted ground state orbital. The
lack of luminescence in this compound supports identifying the long-lived component to electronic, rather than spin, contributions and differentiates this compound from the luminescent MLCT’s discussed above.19,20 Importantly, the results show that a charge transfer state, nearby to the main LMCT absorption and of different 3d character, that has poor optical and vibrational coupling to the ground state can collect excited 3d electrons and thereby significantly lengthen the charge transfer lifetime in a 3d metal-centered LMCT chromophore. The long lifetime, in conjunction with the strong visible absorption, suggests its use as a chromophore for energy conversion applications; particularly applications that exploit the LMCT character where reduction occurs from a strongly reducing metal center.
■
RESULTS: SYNTHESIS, CHARACTERIZATION, AND PHOTOLUMINESCENCEFigure 2 shows the X-ray crystal structure of the vanadium(V) oxido chelate, VOLF, under study supported by the fluorinated
tetradentate aminophenol ligand (LF). Although similar ligands
to H3LFhave been prepared via thermal Mannich condensation
using relatively electron-rich phenols,21 we found that this method resulted in only a trace yield of the electron-poor fluorinated ligand even after several weeks of reaction time. In contrast, we found that microwave heating of 4-fluoro-2-methylphenol, ethanolamine, and formaldehyde in 1-butanol at 110 °C for 5 h resulted in an overall yield of 50% for H3LF.
VOLF was obtained as a burgundy powder in excellent yield
(98%) through the dropwise addition of oxidovanadium triisopropoxide into a solution of H3LF in toluene.22 Red
block crystals of VOLF suitable for XRD crystallography were
obtained by vapor diffusion of cyclohexane into m-xylene (Figure 2). Full synthetic details for H3LFand VOLFare given
in the Supporting Information.
By definition, LMCT results in metal-centered excited states where reduction photochemistry can be controlled by shifting the redox properties of the metal through either ligand modification and/or metal substitution. As a result, tuning of LMCT excited state energetics should be possible over a wide range. Electrochemistry of VOLF shows that an irreversible
V(IV/V) redox couple at −1.01 V versus Fc/Fc+(Figure S17 of
the Supporting Information), which suggests that this class of compounds has metal-centered excited states that are relatively strong reductants. VOLF therefore has the thermodynamic
potential to photochemically drive the reduction of protons23
to form dihydrogen in solar energy-to-fuels applications or to mediate organic transformations such as quinone reduction.24
Unlike the MLCT compounds discussed above, there is no observed static photoluminescence. Static photoluminescence was measured on an Edinburgh Photonics FLS920 spectrom-eter. Samples of 1 μM VOLFwere prepared in nitrogen-sparged
spectroscopic grade THF (Sigma-Aldrich). The spectrum of VOLFwas recorded with excitation and emission bandwidths of
4.0 nm, 1 nm step, and a 1s dwell time; for comparison, the reported sensitivity of 6000:1 at the Raman band of water was
Figure 1.Schematic of states explored during excited state evolution of VOLF. Excitation of the LMCT transition prepares the system in a vibrationally excited LMCT state, S3(dyz). Relaxation and internal
conversion occur until the system reaches S1(dxy). Sn(d) represents the
higher-lying d orbitals which serve as final states for d1 excitations (explored with our time-dependent probe).
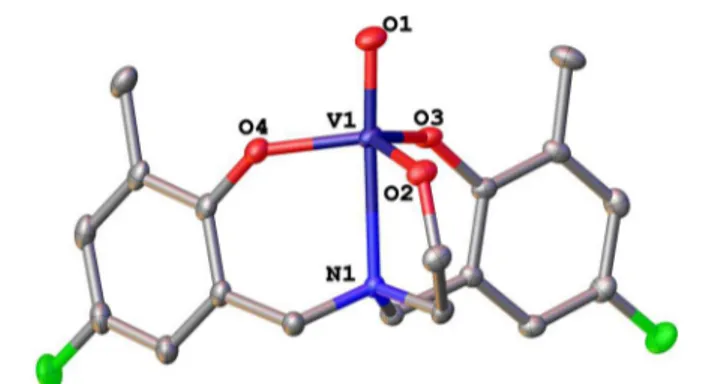
Figure 2.X-ray crystal structure of VOLF, CCDC 1027781. Selected bond distances (Å): V1−O1: 1.5991(11), V1−O2: 1.7966(11), V1− O3: 1.8047(10), V1−O4: 1.8167(11), V1−N1: 2.3922(12). Selected interatomic angles (deg): O1−V1−O2: 97.09(5), O2−V1−O3: 118.47(5), O1−V1−N1: 174.20(5). Hydrogen atoms have been omitted for clarity with thermal ellipsoids drawn at 50% probability. A unit cell consisting of cocrystallizing enantiomers of VOLF and comparison of theoretical geometries is available in the Supporting Information.
collected at 350 nm excitation, 5 nm spectral bandwidth, and 1 s integration time. Three spectra were averaged. Upon excitation with 405 nm light, no photoluminescence from the VOLFsample was detected between 415 and 750 nm. A more
concentrated, 1 mM solution of VOLF in THF was also
prepared. Static photoluminescence measurements of this 1 mM solution (excitation/emission bandwidths of 5 nm, 1 nm step size, 0.1s dwell time) also showed no photoluminescence between 415 and 750 nm.
The absence of photoluminescence suggests that the long-lived charge transfer state is not easily ascribed to triplet formation. Another way to identify triplet formation is to estimate the energy barrier for ground state recovery and compare it to previously measured singlet−triplet ISC activation barriers that lead to long-lived states. In order to determine the upper limit for the energy barrier to ground state recovery, a simple Arrhenius model was applied to the measured decay rate at room temperature (423 ps) in the ultrafast optical experiments below and the rate at −80 °C. At −80 °C, we were unable to observe any transient absorption signal on the nanosecond timescale (experimental details for the nanosecond measurements are in the Supporting Information). The time-resolution of the nanosecond transient absorption measurement, and therefore the upper bound for the lifetime of this transition at −80 °C, is ∼2 ns. Using these two data points, we conclude that the energy barrier is less than 50 meV. This 50 meV maximum barrier is significantly lower than the precedent set for ISC by rubrene in sucrose octaacetate matrix, which is on the order of 160 meV.25
■
RESULTS: STATIC OPTICAL/X-RAY SPECTRA AND TD-DFT CALCULATIONSOptically exciting VOLF in the visible region (400−500 nm)
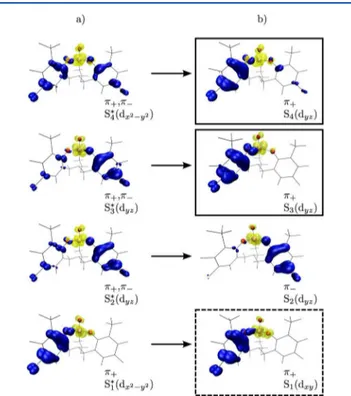
gives the LMCT absorption spectrum shown in Figure 3a). Using TD-DFT, we are able to reproduce and decompose this spectrum. There are four bright transitions that make up the absorption, hereafter labeled as S1−S4. These excited states are
shown in Figure 4, where yellow denotes an electron and blue is the corresponding hole. Electron−hole distributions are shown both for the ground state geometry and at the relaxed minima of each excited state potential energy surface. Each excited state is clearly of LMCT character, involving charge transfer from one or both of the ligands to the metal center (unoccupied V d orbitals). We label the two frontier (HOMO− 1 and HOMO) donating orbitals involved in these excitations as π−and π+, respectively (Figure 3b).
In the ground state geometry (indicated with a *), S2*−S4*are
made up of contributions from V d orbitals and both phenyl rings (π+ and π−). S4* is an even combination of π− and π+,
while S3*and S2*have slightly more weight on the π−side. For
clarity, we label all excited states by their largest d component. Figure 3b shows the largest d component of S3*as dyzsince the
transition is 60% π+ → 3dyz. The lowest energy excitation,
S1*(dx2−y2), has the hole localized to one ligand; this state has
only π+character.
In the transient optical spectroscopy discussed below, the LMCT is excited at 400 nm (Figure 3a). Since S3*(dyz) and
S4*(dx2−y2) are close in energy, both states are initially populated
due to Franck−Condon broadening. After excitation, the wave packet will evolve along the potential energy surface of each of the electronic states. Importantly, electron−hole dynamics differ along each excited state surface. As the wavepacket moves along the potential energy surface, S3(dyz) and S4(dyz) lose their
π−character; the hole becomes localized on π+. The largest d
component of S4changes from dx2−y2to dyz. As a consequence
Figure 3.(a) Optical absorption of VOLF. The broad absorption peak occurring for wavelengths longer than 400 nm is due to a charge transfer excitation from the ligand-to-metal center (LMCT). (b) Single particle orbitals contributing to the main transition (peak at 425 nm) into S3*. Vertical lines denote TD-DFT transition energies and oscillator strengths.
Figure 4.Electron−hole distribution for the first four excited states in the visible region. The hole is shown in blue and electron in yellow. This color scheme distinguishes the states from the single particle orbitals shown in Figures 3 and 5.
The Journal of Physical Chemistry C Article
DOI: 10.1021/acs.jpcc.5b00513 J. Phys. Chem. C 2015, 119, 17029−17038
to these changes, S3(dyz) and S4(dyz) essentially have the same
character in the relaxed geometry (Figure 4).
S2(dyz) exhibits the opposite trend; relaxation along the
excited state potential causes the hole to localize on π−. The
mismatch in hole localization (π+ vs π−) between S3(dyz)/
S4(dyz) and S2(dyz) suggests that internal conversion (IC)
between these states is symmetry forbidden and unlikely. Conversely, the character of S1(dxy) is unaffected by
relaxation. The hole remains localized on π+, and therefore,
IC from either S4(dyz) or S3(dyz) to S1(dxy) is possible. Since
S3(dyz) and S4(dyz) are so similar in character, we excite both
with our pump at 400 nm, and the S3*(dyz) initially excited state
is significantly brighter, we adopt S3(dyz) as the higher energy
state in a two state model of the low energy, relaxed charge transfer states. S1(dxy), the lowest energy excited state and the
only one that can couple to either S3or S4, is the lower energy
state.
We also compute the excited state absorption spectra explored through our probe. We find that there is more coupling optically (through the dipole matrix element) between S3(dyz) and higher states than from S1(dxy) (see Figure S3 of
the Supporting Information). The majority of the higher lying states within 3.0 eV are of LMCT character. From S3(dyz) up,
∼60% of states are pure LMCT, while the remaining 40% are mixed (not pure LMCT, MLCT, or ligand-to-ligand charge transfer). Similarly, S4(dyz) has ∼65% pure LMCT and 35%
mixed.
To calibrate where the nearest higher-lying LMCT states are, denoted by Sn(d) in Figure 1, we have done X-ray absorption
spectroscopy of the O K-edge (1s absorption) of the molecule (Figure 5). Since LMCT states all have the electron primarily
on vanadium, the energy differences between V LUMO orbitals, or the d1 absorptions, are indicative of the level
splitting between LMCT states. The level alignment of the LUMO is informed by the pre-edge region of the O K-edge that comprises three lower energy (529−535 eV) bands, each a mixture of oxygen 2p orbitals with vanadium 3d states.26−29 Previous work has shown that for tetrahedral compounds of e and t2 symmetries,28,29 the peak separation of these bands in
the O K-edge reproduces observed d-d transitions fairly well.26,28 Therefore, the energy separation between the lower two peaks in the XAS spectrum, 2.2 eV, is assigned to the level splitting between the lowest LUMO orbitals (two degenerate pairs, LUMO/LUMO+1, and LUMO+2/LUMO+3), indicative of excited state absorption from the initial LMCT to the next higher LMCT state.30−34
■
RESULTS: TRANSIENT OPTICAL SPECTROSCOPY AND TD-DFT CALCULATIONSExcitation of VOLFat 400 nm leads to the transient spectrum,
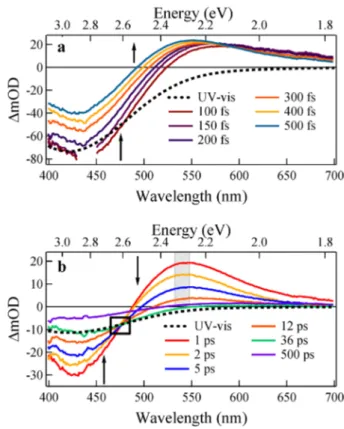
probed from 400−700 nm, shown in Figure 6. This spectral
region comprises the LMCT excitation into the initial charge transfer states (∼400−525 nm) and excited state absorptions (∼500−600 nm). Transient spectra were collected at both short time delays (100−500 fs, Figure 6a) and longer time delays (1−500 ps, Figure 6b). To aid assignment of the transient signals, the transient spectra are compared to the static UV−vis LMCT spectrum in each time window, at 100 fs and at 36 ps. In the region of 400−525 nm, the transient spectra exhibit a −ΔmOD associated with a ground state bleach (GSB) and stimulated emission (SE). An excited state absorption predominates in the region beyond 525 nm for times faster than 36 ps. After 36 ps, the ESA has decayed substantially, and the transient spectrum largely follows the UV−vis LMCT spectrum (Figure 6b).
Importantly, the transient spectrum contains an isosbestic point for the time window 1 to 36 ps where the ΔmOD is time independent (Figure 6b). For the isosbestic point to appear, there must be negligible back electron transfer to the ground state. This suggests that at these timescales there is a concentration of total excited carriers that is constant over the entire spectral region but whose contribution exchanges between two different excited electronic populations that both contribute to the spectrum.35−37S
3(dyz) and S1(3dxy) described
in the two-state model for VOLF can account for these two
populations. An isosbestic point would result from internal
Figure 5.X-ray absorption spectrum of powder VOLFin PFY mode. Scheme shows the DFT d orbital (dashed lines) splitting based on observed transition energies from XAS.
Figure 6.Transient spectra of VOLFin THF taken (a) at early times and (b) at later times. Arrows show the direction of signal growth (decay) as time delay increases. Early contributions from solvent response are removed at times before 200 fs. The isosbestic point occurring at intermediate times is demarcated by a black box. The maximum of the ESA (2.3 eV) is highlighted in gray.
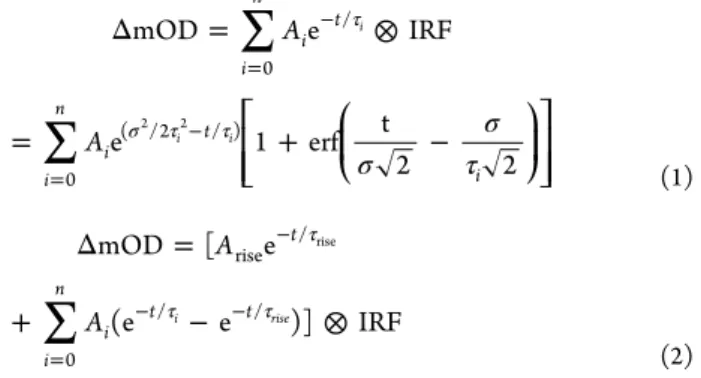
conversion (IC) between them. We will return to a detailed description of the isosbestic point after describing its involvement in the kinetic components of the spectral signals. For our kinetic analysis, we applied a sum of single exponential functions, each convolved with the Gaussian instrument response function (IRF) of our system (fwhm 100 fs), as the fitting function for the kinetic traces in most spectral regions (eq 1). The excepted region (540−590 nm, centered about the peak of the ESA) was modeled with a slight variation on the general summation to account for a small rising component (eq 2). Time constants were extracted from global fits of multiple kinetic traces within a particular spectral region.
∑
∑
σ σ τ Δ = ⊗ = + − τ σ τ τ = − = − ⎡ ⎣ ⎢ ⎢ ⎛ ⎝ ⎜ ⎞ ⎠ ⎟ ⎤ ⎦ ⎥ ⎥ A A mOD e IRF e 1 erf t 2 2 i n i t i n i t i 0 / 0 ( /2 / ) i i i 2 2 (1)∑
Δ = + − ⊗ τ τ τ − = − − A A mOD [ e (e e )] IRF t i n i t t rise / 0 /i /rise rise (2)The kinetics probed by the GSB/SE transition are shown in Figure 7a and Figure S9 of the Supporting Information. Kinetic traces reveal rapid relaxation of the initial state and then a much slower decay. The kinetics are well-represented by a triexponential function composed of fast 0.180 ps ± 0.005
(τISC‑IVR), intermediate 7.27 ps ± 0.32 (τ1), and slow 455 ps ±
30 (τ2) time constants. The expected amplitude of the transient
signal at time zero based on the concentration of VOLF in
solution, the pump power, and interpreting the signal as a GSB of the LMCT transition with an extinction coefficient derived from static UV−vis is −100 ΔmOD, while here −80 ΔmOD is observed. There are at least two physical phenomena that could be attributed to the 0.18 ps time constant: singlet-to-triplet intersystem crossing (ISC) and intra- and intervibrational relaxation (IVR). Generally in the MLCT compounds studied previously, a fast 0.02−0.1 ps ISC is observed as first as a stimulated emission signal from the singlet state significantly shifted from the GSB and then a much weaker, further red-shifted emission signal of the triplet state.38An SE contribution
related to ISC may be less important in VOLF since no
long-lived emission is observed; the 0.18 ps time constant is observed in the region of the GSB rather than in a red-shifted spectrum, and there is gross agreement of the signal magnitude with expectations from a GSB. However, it may also be the case that the SE in VOLF is not significantly red-shifted from the
GSB or that the ESA contribution masks the true SE signal. IVR of the initially excited Franck−Condon state to a relaxed state less well-coupled to the ground state geometry will certainly be present and can also account for the 0.18 ps time constant. Given the TD-DFT description where the hole localizes to π+and the d-electron undergoes symmetry changes
(Figure 4), this IVR could be quite large; this is further indicated by the 90% reduction in the transition dipole back to S0for S3*(Table S2 of the Supporting Information). Therefore,
for now, the time constant of 0.18 ps is attributed to a combination of ISC and IVR (τISC‑IVR) and we focus on the
longer timescale kinetics and transient spectrum. Resolution of the ISC and IVR contribution to τISC‑IVR through separate
ultrafast fluorescence studies that would directly detect SE38,39 is set aside for later experiments.
We now turn to the two longer time constants of the GSB/ SE spectrum [7.27 ps (τ1), 455 ps (τ2)]. Since IVR and ISC are
expected to occur at faster timescales, these later time constants should come from electronic contributions of excited populations. The observation of two long timescale contribu-tions to the GSB decay is unlike that seen in the canonical Ru(bpy)32+or recent Fe(bpy)32+ where fast ISC, IVR, and IC
are followed by a single long time constant identified by GSB traces, attributed to a fluorescent, charge transfer state in Ru(bpy)32+ and the high spin metal-centered state in
Fe(bpy)32+.5,40,41Indeed, VOLF has two closely spaced charge
transfer states that could both contribute significantly to the GSB spectral decay (Figure 3a, Figure 4). The clear resolution of the two timescales in the GSB traces in VOLF could be a
result of a population exchange between the initially excited S3
population and the lower energy S1 population (i.e., a series
pathway that comes from internal conversion between the two CT states). On the other hand, the resolution of the two timescales could result from a parallel pathway, in which both S3and S1 decay back to the ground state with different time
constants. DFT calculations that reproduce the LMCT UV−vis spectrum do show that the relaxed geometry of S3(dyz) has a
finite transition dipole to the ground state [S3(dyz) → S0], while S1(dxy) → S0is significantly smaller; this would effect how each
transition contributes to the GSB and their decay, in either a series or parallel model. The transition dipoles of these two transitions are shown in Table S2 of the Supporting Information.
Figure 7.Kinetic traces of VOLFat variable probe wavelengths of (a) 425, (b) 550, and (c) 500 nm with corresponding fits in black. The transitions contributing to the traces at each wavelength are indicated. The Gaussian IRF (100 fs fwhm, red dotted) is plotted in (a) to compare with the GSB/SE dynamics, and the 425 nm kinetic trace is reproduced (gold dashed) in (b) to highlight the rise component in the ESA trace.
The Journal of Physical Chemistry C Article
DOI: 10.1021/acs.jpcc.5b00513 J. Phys. Chem. C 2015, 119, 17029−17038
The decay kinetics probed by the ESA spectrum, shown in Figure 7b and Figure S8 of the Supporting Information, can be fit with a triexponential function containing one rise component and two decaying components (eq 2) having time constants of 0.188 ps ± 0.024 (τISC‑IVR), 0.602 ps ± 0.054
(τ0), and 6.63 ps ± 0.12 (τ1), respectively, in the region of the
maximum of the ESA (2.3 eV, 540−590 nm). The similarity of τ1with the intermediate timescale observed in the GSB traces (7 ps) ties the decay of the ESA to the same state involved in the GSB decay. If a series pathway/internal conversion between the two charge transfer states is involved then the ESA decay would report uniquely on the decay of S3. In a parallel pathway
of S3and S1to the ground state, the ESA would report on one
or the other. The isosbestic point that we observe between 1 and 36 ps, in the same timeframe that the IC would be expected by τ1of the ESA, is what primarily points to a series pathway/
internal conversion, the assignment of this ESA signal to the S3
state, and identifying τ1with IC. Further, our initial excitation is
at 400 nm, ∼ 0.3 eV away from the poorly absorbing S1state.
Therefore, S1is unlikely to be substantially excited initially such
that it could account for the rather large 20 ΔmOD ESA at early times. Internal conversion, on the other hand, could significantly populate the S1state. The time constant τ0∼0.602
ps is tied to τ16.63 ps, occurring exclusively together as will be
discussed further below; it likely comes from IVR within S3.
The rise time of 0.188 ps is determined by the inclusion of a negative amplitude exponential to modulate the amplitude of subsequent decay (eq 2). Since it is similar to the fast 0.180 ps τ0 of the LMCT GSB, it likely results from an overlapping −ΔmOD and therefore could be related to IVR or ISC. Finally, we note that the large ESA observed also invalidates attributing 6.63 ps τ1or 0.6 ps τ1to an ISC, since excited state absorptions
will primarily be determined by the electronic structure, regardless of whether the initial state is a singlet or triplet with respect to the ground state.
To model the kinetics at probe wavelengths (500 nm) where the ESA and the GSB/SE overlap, the amplitudes of four exponentials with fixed time constants determined above (0.18, 0.60, 6.63, and 455 ps) were fit to each trace. As seen in Figure 7c and Figure S10 of the Supporting Information, these fixed time constants generate curves that match the data well, suggesting that these are the main time constants involved. The contributions of each can be clearly illustrated by the changes in sign of the transient signal. Immediately after excitation, the GSB/SE (−ΔmOD) is the most prominent, decaying within 0.18 ps. After the first picosecond, the GSB/SE signal has decayed enough such that the signal is dominated by the ESA which lasts for 6.63 ps. The decay of the ESA results in a second sign change and the reemergence of the longer lived, 455 ps GSB (−ΔmOD) as the dominant signal. Given the long time constant of τ2, we can safely associate it with a pure GSB
rather than SE signal. The decay kinetics in this region of spectral overlap show that a separate time constant to account for the ESA of S1is not required to fit the traces. This suggests
that the ESA of S1 decays concomitantly with its associated
GSB, or the 455 ps τ2 time constant. While for S3 there are
spectral regions where the ESA dominates leading to a separately measured time constant in the GSB and ESA, for S1the GSB dominates the spectrum throughout.
Having given some of the evidence for IC between two charge transfer states through the kinetics of the GSB/SE and the ESA, we now turn to the assignment of the ESA spectrum. Since DFT calculations show that the majority of the higher
lying excited states to which there could be an absorption are of LMCT character (Figures S3 and S4 of the Supporting Information), the contributions to the ESA from Sn(d) are
likely. A positive assignment of the ESA to higher-lying LMCT states comes from the energy of d1transitions obtained by XAS
of the O K-edge (Figure 5). The ESA peaked at 550 nm (2.3 eV) (Figure 6b) comes very close to the splitting (2.2 eV) of the two lowest pre-edge peaks in the XAS spectrum, uniquely assignable to d-d transitions with significant O 2p character and discussed above. A 2.2 eV absorption also agrees with d1
absorptions in vanadium(IV) compounds in the literature.30−34 While a positive assignment can be made based on the energy of the ESA and the XAS data, there are in principle, three other possible transitions that could account for the ESA: MLCT, dication LMCT, and intraligand transitions. An dication LMCT transition is the least likely candidate as removal of a second electron from the ligand to create a dication is highly unfavorable and such a transition is expected to appear significantly blue-shifted from the LMCT. An excited state MLCT transition could come from excitation of the electron in V d LUMO orbitals to a higher-lying ligand LUMO orbital. However, in our TD-DFT calculations, we do not see any pure MLCT transitions up to 3.0 eV away from the relaxed states. The intraligand hole excitation to lower-lying HOMO orbitals is the only real alternative to a higher-lying LMCT state as an assignment of the ESA. Ideally, one would perform spectroelectrochemical measurements of the ligand to determine the UV−vis spectrum of the ligand cation. Unfortunately, electron or hole transfer by electrochemistry decomposes the ligand. In the measurements done, the tail of a new UV absorption near 375 nm is observed with no accompanying absorptions above 400 nm. Oxidative and reductive spectroelectrochemistry of VOLF reveals complex
decomposition without discernable formation of redox products by optical absorption spectroscopy. Furthermore, subtraction of the normalized absorption spectrum of VOLF
from the one-electron reduced or oxidized VOLF does not
furnish meaningful data. Indeed, cyclic voltammetry of VOLFin
THF shows irreversible one-electron redox couples (see the Supporting Information for cyclic voltammetry of VOLF and
spectroelectrochemical characterization of VOLF and H 3LF in
Figures S17 and S18 of the Supporting Information.)
In order to clarify the roles of the ligand hole and Sn(d) to
the ESA, singular value decomposition (SVD) transformation of our transient data was carried out, and a global analysis subsequently applied (refer to the Supporting Information for details). For our global analysis, we applied the general model (eq 1) used in our earlier fits to the resultant SVD kinetic basis vectors and extracted the global time constants associated with the excited state without regard to particular spectral regions (Figure S13a of the Supporting Information). The best fit for the global analysis was obtained from a tetraexponential function, producing decays of 141 and 777 fs and 6.85 and 423 ps, in good agreement with the parameters obtained from our prior fits. The corresponding normalized decay-associated spectra (DAS) (refer to the Supporting Information), reflective of the relative spectral contributions for each time constant, are shown in Figure 8.
At early times following excitation, the creation of the initial charge transfer excited state is illustrated by DAS1, consisting of both an LMCT GSB and the ESA (141 fs, Figure 8). Importantly, the 423 ps spectrum, DAS4 is nearly identical to DAS1 in both the LMCT GSB and the ESA. The fact that an
ESA persists at longer timescales and is so similar to the initially excited charge transfer state points to the fact that the long-lived state is indeed of charge transfer character. However, the similarity of the ESA at the two timescales might not at first seem consistent with the involvement of two different charge transfer states, S3and S1. This could be reconciled by an ESA of
common origin for the two states agnostic of the excited state electron character, with the most likely candidate being a ligand hole absorption. The similarity in DAS1 and DAS4 likely comes from the fact that, in both, the GSB reports on the unexcited population through the S3*transition, while the ESA reports on
the total excited state population through the ligand hole transition. Furthermore, the ESA of DAS1 and DAS4 also occurs in DAS2 and DAS3, and is therefore present throughout the ground state recovery, again indicating an ESA of common origin.
On the other hand, a comparison of the decay-associated spectra at intermediate times (DAS2, 777 fs and DAS3, 6.85 ps) with the early/late DAS reveals an additional ESA. The ESA is slightly blue-shifted from the ESA assigned to the ligand hole and has a significantly greater intensity with respect to the GSB. This blue-shifted ESA is peaked at 2.3 eV, the energy of a d-d transition roughly indicated by our XAS oxygen pre-edge (2.2 eV). The presence of this d1absorption at intermediate times
and its disappearance at longer times despite a long-lived CT state can be explained by internal conversion from S3to S1over
1−36 ps, where the absorption from S3far exceeds that of S1.
This explanation is corroborated by theory with our calculation of significantly reduced optical coupling to higher-lying d states from S1 [S1(dxy) → Sn(d)] as compared to S3 [S3(dyz) →
Sn(d)] (Figure S3 and Table S3 of the Supporting
Information). The analysis of the kinetic traces of the ESA above, the similarity in the DAS2 and DAS3 spectra, and the rationale given by the TD-DFT calculations, assigns these two intermediate time constants to the S3(dxy) state. Further, the
unique ESA of this state, regardless of the exact assignment, means that its disappearance at later times is related to changes in the electronic nature of the excited state rather than relaxations within a similar state, either due to IVR or solvent dynamics. This suggests that the isosbestic point is electronic in nature and supports an internal conversion occurring with a 6.8 ps time constant.
Now we turn to defining the transient spectral contributions to the isosbestic point. Contributions to the transient spectrum, as demonstrated by Han et al.,35can be written as
Δ = −ϵ + ϵ + −ϵ + ϵ − − S t S t mOD ( )[ (d )( )] ( )[ (d )( )] yz xy LMCT 3 d d 3 3 LMCT 1 d d 1 1 (3)
where ϵLMCT3 and ϵLMCT1 are the S3(dyz) → S0, S1(dxy) → S0
transitions and ϵd−d3 and ϵd−d1 are the S3(dyz) → Sn(d), S1(dxy)
→ Sn(d) transitions. The ligand hole contribution to each state
is not included because the normalized DAS suggest that the absorptions, relative to the LMCT GSB, are similar in magnitude and would negate one another in the calculation of the isosbestic point below. Further, the ligand hole contribution at the wavelength of the isosbestic point, 485 nm, if any, is strongly overshadowed by the LMCT GSB and the ESA of Sn(d) origin. We note that analyzing isosbestic
points in transient absorption spectra at the many picoseconds timescale has precedence.42−44
The isosbestic point requires a population exchange, such that [S3(dyz)(t)] = c0 − [S1(dxy)(t)], where c0 represents the
excited state population after IVR and ISC in the initial picosecond. For the ΔmOD to be time independent at 485 nm from 1 to 36 ps, the extinction coefficients must be, at 485 nm, related in the following way: −ϵLMCT3 + ϵd−d3 = −ϵLMCT1 + ϵd−d1 .
In order to see if this is viable, we can utilize extinction coefficients for the LMCT back to S0 and for the ESA
transitions to Sn(d) (summed over 2.0 to 2.5 eV) calculated by
TD-DFT for both states (Tables S2 and S3 of the Supporting Information). Since the extinction coefficients reported in the tables indicate an average magnitude, most attributable to the peak energy of the transitions, we scale these first by the amount the extinction coefficient would decrease from the peak energy to 485 nm, a wavelength significantly to the blue of the LMCT transition and to the red of the ESA transition to Sn(d) .
For the LMCT transition, the scaling is 50% from the UV−vis absorption. The ESA transition to Sn(d) is harder to estimate,
but DAS2 and DAS3 suggest that 10% as a higher bound is reasonable. With these considerations, the equation roughly holds, where it is imbalanced by ∼4% of the transition dipole for the initial S3* transition. A final note on these extinction
coefficients is that the deconvolved spectra (DAS2 and DAS3) and the TD-DFT calculations suggest that ϵLMCT3 ∼ ϵd−d3 . While
extinction coefficients are generally much weaker for d-d than LMCT transitions, these d-d transitions really involve two LMCT states, which can significantly enhance optical d-d transitions from what one would normally expect in the ground state.45−47
■
DISCUSSIONTaken together, the results show that a long-lived excited LMCT state is created by internal conversion between two CT states, differentiated by their V d-character: S3(dyz) and S1(dxy).
The evidence comes from (1) an isosbestic point at intermediate timescales (from 1 to 36 ps); (2) after the initial picosecond of IVR/ISC, the recovery of the LMCT GSB with two time constants (6.8 and 423 ps); (3) a distinct 6.8 ps decay observed independently in the kinetic traces of the ESA and DAS3, within the time window of the isosbestic point and, therefore, assignable to internal conversion; (4) unique DAS spectra at intermediate timescales (0.78 ps, 6.8 ps), where the energy of the ESA can be assigned to a transition to Sn(d),
Figure 8. Normalized decay-associated spectra (DAS) for the associated time constants (141 fs, 777 fs, 6.82 ps, and 423 ps) determined by our global analysis. As with Figure 6a, Raman scattering from the tetrahydrofuran solvent has been removed from the DAS at 2.8 eV.
The Journal of Physical Chemistry C Article
DOI: 10.1021/acs.jpcc.5b00513 J. Phys. Chem. C 2015, 119, 17029−17038
corroborates interpreting the isosbestic point as coming from an internal conversion between different excited electronic states; and (5) a DAS4 spectrum at 423 ps that still exhibits an ESA, likely related to a ligand hole. Corroborating this evidence are TD-DFT calculations that suggest a two state model where internal conversion between S3(dyz) and S1(dxy) is likely by
symmetry. Further, they suggest a higher transition dipole of S3(dyz) to Sn(d) than for S1(dxy), explaining why a 6.8 ps decay
related to internal conversion can be isolated from the ESA. Finally, the TD-DFT calculations for the different transition dipoles also show that an isosbestic point is viable.
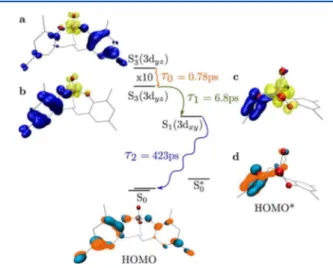
Figure 9 depicts the kinetic pathway that results from this internal conversion. For the purposes here, we are concerned
with the longer timescales associated with this internal conversion rather than the initial ISC/IVR of 0.14 ps found in the LMCT GSB and for the earliest DAS spectra. We note that this time constant, if attributable to IVR, could involve relaxations from both S4*(dx2−y2) and S3*(dyz), until they end up
in relaxed states of the same symmetry (Figure 4). Under-standing this fast decay fully is set aside for later experiments, as internal conversion is similarly possible from singlet or triplet states. After a combination of IVR and ISC within 0.14 ps, the initial wave packet excited by the pump ends up in a still unthermalized S3*(dyz) state, given that thermalization
time-scales are usually longer and that there are two time constants associated with S3based on the two DAS spectra (0.78 and 6.82
ps). We assign the 0.78 ps time constant (τ0) to thermalization
of S3*(dyz) to S3(dyz), though in this case S3*(dyz) is not
necessarily the initially excited Franck−Condon state but has relaxed already after ISC/IVR. Thereafter, the S3(dyz)
population can transfer to the energetically nearby CT state provided by S1(3dxy). To this internal conversion, we assign the
6.82 ps (τ1) time constant. Finally, decay of S1(3dxy) to the
ground state occurs with the last CT timescale associated with the DAS spectra, 423 ps (τ2).
We now explore why internal conversion is an efficient pathway and why population of S1(3dxy) leads to such a long
lifetime by TD-DFT and MSCASPT2 calculations. In Figure 9, the symmetries of the excited states are shown with electron occupation in yellow and hole occupation in blue. The electron
occupation of the ground state, S0, is shaded in blue/orange,
denoting phase. (a) In both S0 and the initially excited
S3*(3dyz), electron occupation for S0 and hole occupation for
S3*(3dyz) span both ligands, π+and π−orbitals. (b) As S3*(3dyz)
moves along the potential energy surface the geometry is altered, and the hole is localized on π+. (c) At this point,
S3(3dyz) has the right symmetry to internally convert into
S1(3dxy). For S1(3dxy), there is minimal electron weight on the
bridging oxygen (i.e., V coordinating) to the π+ligand. To make
this more clear, the molecule is shown from above for (c and d). The minimal weight leads to weak coupling between S1(3dxy) and the distorted ground state, S0*, calculated at the
geometry of S1(3dxy) and where the blue/orange indicate
unoccupied electron density (d). Further, in this configuration, (d) S0* has unoccupied electron density on π+ rather than
distributed across both π+ and π−. Together, the minimal
electron weight on the bridging oxygen to π+ and the π+
occupation of S0* leads to a very small transition dipole for
S1(dxy) → S0*[Table S2 of the Supporting Information or ∼1%
of the initially excited transition to S3*(dyz)]. Furthermore,
Franck−Condon overlap between low energy vibration modes of S1(3dxy) with the ground state is negligible (<10−8). While
S0* does lie higher in energy than S0, the energy difference is
small.
Given the significant distortions in the unoccupied density of S0*, with the weight on the π+orbital, one could ask whether or
not the lifetime of the excited charge transfer state S3(3dyz),
would also be long if the S1(3dxy) state was not available. While
the TD-DFT and MSCASPT2 indicate that the overlap of S1(3dxy) with the distorted ground state leads to a very small
transition dipole, it is still significant for S3(3dyz). While the
transition dipole between S3(3dyz) with the same distorted
ground state is indeed reduced, it is still 10% of the initially excited transition to S3*(dyz) [S3(3dyz) relaxes to a saddle point,
thus we cannot assess Franck−Condon overlap]. In con-junction with the absence of photoluminescence and identifiable triplet formation at longer timescales, this indicates that the electronic structure of S1(3dxy) is critical for the long
charge transfer lifetime. In comparison to S3(3dyz), the
electronic structure is primarily differentiated by the symmetry of electron occupied 3d orbital, since in both states the hole is localized on π+(Figure 9).
■
CONCLUSIONIn conclusion, a long-lived (423 ps) LMCT state is found in a 3d metal-centered compound, VOLF. The long lifetime is
ascribed to internal conversion from the initially excited state to a nearby charge transfer state, S1(3dxy), with poor optical and
vibrational overlap to a distorted ground state. In conjunction with no observed photoluminescence, the long lifetime is attributed to a nonradiative transition with little opportunity to release its energy to vibrations. Future work will investigate the universality of this type of long-lived charge transfer in 3d metal-centered compounds by transient absorption and TD-DFT, along with uses for VOLF and related compounds
containing d0 LMCT transitions for driving photochemical
reactions.
■
ASSOCIATED CONTENT*
S Supporting InformationSynthesis and characterization of H3LF and VOLF, and further
experimental details for X-ray crystallography (CCDC 1027781), DFT calculations, X-ray absorption measurements,
Figure 9. Scheme of relaxation pathways for excited VOLF with corresponding time constants determined from the DAS of the transient optical spectroscopy and excited and ground states depicted by TD-DFT. The relative energy differences are to scale, the one exception being S3*(3dyz).
ultrafast and nanosecond transient absorption, and photo-luminescence measurements. These details include: NMR, FT-IR spectra; a cyclic voltammogram and spectroelectrochemistry of VOLF (characterization); unit cell determination and
comparison of experiment to theoretical geometries (crystallog-raphy); a full molecular orbital diagram and decomposition of the major contributions to the LMCT transition and calculated transition dipoles for ground-state bleaches and excited state absorptions (theory); group velocity dispersion (GVD) correction, singular value decomposition (SVD) spectrally resolved global fits of kinetic traces; as well as global analysis to generate decay-associated spectra (ultrafast transient absorp-tion). The Supporting Information is available free of charge on the ACS Publications website at DOI: 10.1021/ acs.jpcc.5b00513.
■
AUTHOR INFORMATIONCorresponding Author
*E-mail: tanjacuk@berkeley.edu. Tel: (510) 643-7344. Fax: (510) 642-8369.
Notes
The authors declare no competing financial interest.
■
ACKNOWLEDGMENTSThis work was supported by NSERC, ComputeCanada, and SOSCIP. W.W.W. acknowledges generous support from NCSU Startup funds. T.C. acknowledges support by LBNL startup funds. We thank the Joint Center for Artificial Photosynthesis and Drs. Ian Sharpe and Jason K. Cooper for their assistance with ultrafast transient absorption measurements.
■
REFERENCES(1) Daul, C. A.; Gu, H. U. Excited-State Energies and Distortions Of d0Transition Metal Tetraoxo Complexes: A Density Functional Study.
J. Chem. Phys. 1997, 107, 4606−4617.
(2) Pollagi, T. P.; Stoner, T. C.; Dallinger, R. F.; Gilbert, T. M.; Hopkins, M. D. Nonlinear Optical and Excited-State Properties Of Conjugated, One-Dimensional [NM(OR)3]n Polymers. J. Am.
Chem. Soc. 1991, 113, 703−704.
(3) Da Re, R. E.; Hopkins, M. D. Electronic Spectroscopy and Photophysics Of Metal-Alkylidyne Complexes. Coord. Chem. Rev. 2005, 249, 1396−1409.
(4) Vogler, A.; Kunkely, H. Photochemistry Of Peroxo Complexes Induced By LMCT, MLCT and Peroxide IL/LLCT Excitation. Coord. Chem. Rev. 2006, 250, 1622−1626.
(5) Juris, A.; Balzani, V.; Barigelletti, F.; Campagna, S.; Belser, P.; von Zelewsky, A. Ru(II) Polypyridine Complexes: Photophysics, Photo-chemistry, ElectroPhoto-chemistry, and Chemiluminescence. Coord. Chem. Rev. 1988, 84, 85−277.
(6) Caspar, J. V.; Westmoreland, T. D.; Allen, G. H.; Bradley, P. G.; Meyer, T. J.; Woodruff, W. H. Molecular and Electronic Structure In The Metal-To-Ligand Charge-Transfer Excited States Of d6 Transition-Metal Complexes In Solution. J. Am. Chem. Soc. 1984, 106, 3492−3500.
(7) Huynh, M. H. V.; Dattelbaum, D. M.; Meyer, T. J. Exited State Electron and Energy Transfer In Molecular Assemblies. Coord. Chem. Rev. 2005, 249, 457−483.
(8) Furue, M.; Maruyamaa, K.; Kanematsub, Y.; Kushiiab, T.; Kamachii, M. Competitive Energy and Electron-Transfer Quenching In lntramolscular Processes Of Excited Polypyridine Ruthenium(ll)/ Osmium(ll) Binuclear Complexes M. Coord. Chem. Rev. 1994, 132, 201−208.
(9) Huse, N.; Kim, T.; Jamula, L.; McCusker, J.; de Groot, F.; Schoenlein, R. Photo-Induced Spin-State Conversion In Solvated
Transition Metal Complexes Probed Via Time-Resolved Soft X-ray Spectroscopy. J. Am. Chem. Soc. 2010, 132, 6809−6816.
(10) McCusker, C. E.; Castellano, F. N. Orange-To-Blue and Red-To-Green Photon Upconversion With A Broadband Absorbing Copper(I) MLCT Sensitizer. Chem. Commun. (Cambridge, U.K.) 2013, 49, 3537−3539.
(11) Andrews, R. S.; Becker, J. J.; Gagné, M. R. Intermolecular Addition Of Glycosyl Halides To Alkenes Mediated By Visible Light. Angew. Chem., Int. Ed. 2010, 49, 7274−7276.
(12) Zhang, W.; Alonso-Mori, R.; Bergmann, U.; Bressler, C.; Chollet, M.; Galler, A.; Gawelda, W.; Hadt, R. G.; Hartsock, R. W.; Kroll, T.; et al. Tracking Excited State Charge and Spin Dynamics in Iron Coordination Complexes. Nature 2014, 509, 345−348.
(13) Liu, Y.; Harlang, T.; Canton, S. E.; Chabera, P.; Suarez-Alcantara, K.; Fleckhaus, A.; Vithanage, D. A.; Goransson, E.; Corani, A.; Lomoth, R.; et al. Towards Longer-Lived Metal-To-Ligand Charge Transfer States Of Iron(II) Complexes: An N-Heterocyclic Carbene Approach. Chem. Commun. 2013, 49, 6412−6414.
(14) Khalil, M.; Marcus, M. A.; Smeigh, A. L.; McCusker, J. K.; Chong, H. H.; Schoenlein, R. W. Picosecond X-ray Absorption Spectroscopy of a Photoinduced Iron(II) Spin Crossover Reaction In Solution. J. Phys. Chem. A 2006, 110, 38−44.
(15) McCusker, J. K.; Rheingold, A. L.; Hendrickson, D. N. Variable-Temperature Studies of Laser-Intiated 5T
2 → 1A1 Intersystem Crossing In Spin-Crossover Complexes: Empirical Correlations Between Activation Parameters and Ligand Structure in a Series Of Polypyridyl Ferrous Complexes. Inorg. Chem. 1996, 35, 2100−2112.
(16) Waegele, M.; Doan, H.; Cuk, T. Long-Lived Photoexcited Carrier Dynamics Of d-d Excitations In Spinel Ordered Co3O4. J. Phys.
Chem. C 2014, 118, 3426−3432.
(17) Armaroli, N.; Accorsi, G.; Cardinali, F.; Listorti, A. Photo-chemistry and Photophysics Of Coordination Compounds: Copper. Top Curr. Chem. 2007, 280, 69−115.
(18) Chen, L. X.; Shaw, G. B.; Novozhilova, I.; Liu, T.; Jennings, G.; Attenkofer, K.; Meyer, G. J.; Coppens, P. MLCT State Structure and Dynamics of a Copper(I) Diimine Complex Characterized By Pump-Probe X-ray and Laser Spectroscopies and DFT Calculations. J. Am. Chem. Soc. 2003, 125, 7022−7034.
(19) Lytle, F. E.; Hercules, D. M. The Luminescence Of Tris(2,2′-bipyridine)Ruthenium(II) Dichloride. J. Am. Chem. Soc. 1969, 91, 253−257.
(20) Penfold, T.; Karlsson, S.; Capano, G.; Lima, F.; Rittmann, J.; Reinhard, M.; Rittmann-Frank, M.; Braem, O.; Baranoff, E.; Abela, R.; et al. Solvent-Induced Luminescence Quenching: Static and Time-Resolved X-Ray Absorption Spectroscopy Of A Copper (I) Phenanthroline Complex. J. Phys. Chem. A 2013, 117, 4591−4601.
(21) Sopo, H.; Sviili, J.; Valkonen, A.; Sillanpää, R. Uranyl Ion Complexes With Aminoalcoholbis(phenolate) [O,N,O,O′] Donor Ligands. Polyhedron 2006, 25, 1223−1232.
(22) Wichmann, O.; Sopo, H.; Lehtonen, A.; Sillanpää, R. Oxidovanadium(V) Complexes With Aminoethanol Bis(phenolate) [O,N,O,O′] Ligands: Preparations, Structures, N-Dealkylation and Condensation Reactions. Eur. J. Inorg. Chem. 2011, 2011, 1283−1291. (23) Bartelmess, J.; Francis, A.; El Roz, K.; Castellano, F.; Weare, W.; Sommer, R. Light-Driven Hydrogen Evolution By BODIPY Sensitized Cobaloxime Catalysts. Inorg. Chem. 2014, 53, 4527−4534.
(24) Connelly, N.; Geiger, W. Chemical Redox Agents in Organometallic Chemistry. Chem. Rev. 1996, 96, 877−910.
(25) Song, L.; Fayer, M. Temperature Dependent Intersystem Crossing and Triplet-Triplet Absorption Of Rubrene In Solid Solution. J. Lumin. 1991, 50, 75−81.
(26) De Groot, F.; Grioni, M.; Fuggle, J.; Ghijsen, J.; Sawatzky, G.; Petersen, H. Oxygen 1s X-ray-Absorption Edges Of Transtition-Metal Oxides. Phys. Rev. B 1989, 40, 5715−5723.
(27) Van Aken, P.; Liebscher, B.; Styrsa, V. Core Level Electron Energy-Loss Spectra Of Minerals: Pre-Edge Fine Structures at the Oxygen K-Edge. Phys. Chem. Miner. 1998, 25, 494−498.
(28) Minasian, S.; Keith, J.; Batista, E.; Boland, K.; Bradley, J.; Daly, S.; Kozimor, S.; Lukens, W.; Martin, R.; Nordlund, D.; et al. Covalency
The Journal of Physical Chemistry C Article
DOI: 10.1021/acs.jpcc.5b00513 J. Phys. Chem. C 2015, 119, 17029−17038
in Metal-Oxygen Multiple Bonds Evaluated Using Oxygen K-Edge Spectroscopy and Electronic Structure Theory. J. Am. Chem. Soc. 2013, 135, 1864−1871.
(29) Brydson, R.; Garvie, L.; Cravens, A.; Sauer, H.; Hofer, F.; Cressey, G. L2,3 Edges Of Tetrahedrally Coordinated d0 Transition-Metal Oxyanions XO4n−. J. Phys.: Condens. Matter 1993, 5, 9379−9392. (30) Seena, E.; Mathew, N.; Kuriakose, M.; Kurup, M. Synthesis, Spectral and EPR Studies Of Oxovanadium (IV) Complexes Incorporating Tridentate ONO Donor Hydrazine Ligands: Structural Study Of One Oxovanadium (V) Complex. Polyhedron 2008, 27, 1455−1462.
(31) Ortolano, T.; Selbin, J.; McGlynn, S. Electronic Structure, Spectra, and Magnetic Properties Of Oxycations. V. The Electronic Spectra Of Some Vanadyl Complexes. J. Chem. Phys. 1964, 41, 262− 268.
(32) Kuska, H.; Rogers, M. Assignment Of Optical Spectra For Vanadyl Complexes. Inorg. Chem. 1965, 5, 313−315.
(33) Boucher, L.; Tynan, E.; Yen, T. Spectral Properties of Oxovanadium (IV) Complexes. I. β-Ketimines. Inorg. Chem. 1967, 7, 731−736.
(34) Ferrer, E.; Baran, E. Electronic and Photoelectron Spectra Of Vanadyl (IV) Tetraphenylporphyrin. J. Electron Spectrosc. 1991, 57, 189−197.
(35) Han, Y.; Spangler, L. Use of Isosbestic Points For Determination Of Quantum Efficiency In Transient Absorption Spectroscopy. J. Phys. Chem. A 2002, 106, 1701−1707.
(36) Kuciauskas, D.; Monat, J.; Villahermosa, R.; Gray, H.; Lewis, N.; McCusker, J. Transient Absorption Spectroscopy Of Ruthenium and Osmium Polypyridyl Complexes Adsorbed onto Nanocrystalline TiO2 Photoelectrodes. J. Phys. Chem. B 2002, 106, 9347−9358.
(37) Einterz, C.; Lewis, J.; Kliger, D. Spectral and Kinetic Evidence for the Existence Of Two Forms Of Bathorhodopsin. Proc. Natl. Acad. Sci. U.S.A. 1987, 84, 3699−3703.
(38) Gawelda, W.; Cannizzo, A.; Pham, V.-T.; Van Mourik, F.; Bressler, C.; Chergui, M. Ultrafast Nonadiabatic Dynamics Of [FeII(bpy)
3]2+in Solution. J. Am. Chem. Soc. 2007, 129, 8199−8206. (39) Iwamura, M.; Takeuchi, S.; Tahara, T. Real-Time Observation of the Photoinduced Structural Change Of Bis(2,9-Dimethyl-1,10-Phenanthroline)Copper(I) By Femtosecond Fluorescence Spectros-copy: A Realistic Potential Curve Of The Jahn-Teller Distortion. J. Am. Chem. Soc. 2007, 129, 5248−5256.
(40) Damrauer, N. H.; Cerullo, G.; Yeh, A.; Boussie, T. R.; Shank, C. V.; McCusker, J. K. Femtosecond Dynamics Of Excited-State Evolution in [Ru(bpy)3]2. Science 1997, 275, 54−57.
(41) McCusker, J. K.; Walda, K. N.; Dunn, R. C.; Simon, J. D.; Magde, D.; Hendrickson, D. N. Subpicosecond 1MLCT → 5T
2 Intersystem Crossing Of Low-Spin Polypyridyl Ferrous Complexes. J. Am. Chem. Soc. 1993, 115, 298−307.
(42) Aubard, J.; Maurel, F.; Buntinx, G.; Poizat, O.; Levi, G.; Guglielmetti, R.; Samat, A. Femto/Picosecond Transient Absorption Spectroscopy Of Photochromic 3,3-Diphenylnaphtho[2,1-b]pyran. Mol. Cryst. Liq. Cryst. 2000, 345, 215−220.
(43) Martin, M.; Plaza, P.; Meyer, Y.; Bégin, L.; Bourson, J.; Valeur, B. A New Concept Of Photogeneration Of Cations: Evidence For Photoejection Of Ca2+and Li+From Complexes With A Crown-Ether-Linked Merocyanine By Picosecond Spectroscopy. J. Fluoresc. 1994, 4, 271−273.
(44) Kwok, W.; Ma, C.; Phillips, D.; Matousek, P.; Parker, A.; Towrie, M. Picosecond Time-Resolved Study Of 4-Dimethylamino-benzonitrile In Polar and Nonpolar Solvents. J. Phys. Chem. A 2000, 104, 4188−4197.
(45) Fenske, R. F. Intensities of Forbidden Transitions in Octahedral Complexes. J. Am. Chem. Soc. 1967, 89, 252−256.
(46) Zink, J. I. Photo-Induced Metal-Ligand Bond Weakening, Potential Surfaces, and Spectra. Coord. Chem. Rev. 2001, 211, 69−96. (47) Juban, E. A.; Smeigh, A. L.; Monat, J. E.; McCusker, J. K. Ultrafast Dynamics Of Ligand-Field Excited States. Coord. Chem. Rev. 2006, 250, 1783−1791.