Economics of End-of-Life Materials Recovery: A Study
of Small Appliances and Computer Devices in Portugal
The MIT Faculty has made this article openly available. Please share how this access benefits you. Your story matters.
Citation Ford, Patrick, Eduardo Santos, Paulo Ferrão, Fernanda Margarido, Krystyn J. Van Vliet, and Elsa Olivetti. “Economics of End-of-Life Materials Recovery: A Study of Small Appliances and Computer Devices in Portugal.” Environmental Science & Technology 50, no. 9 (May 3, 2016): 4854–4862.
As Published http://dx.doi.org/10.1021/acs.est.6b00237
Publisher American Chemical Society (ACS)
Version Author's final manuscript
Citable link http://hdl.handle.net/1721.1/107710
Terms of Use Article is made available in accordance with the publisher's policy and may be subject to US copyright law. Please refer to the publisher's site for terms of use.
1
Economics of End-of-Life Materials Recovery – A Study of
1
Small Appliances and Computer Devices in Portugal
2
Patrick Ford1,5, Eduardo Santos2, Paulo Ferrão3,5, Fernanda Margarido3,5, Krystyn J. Van
3
Vliet1,4,5, and Elsa Olivetti1,5*
4
Departments of 1Materials Science and Engineering and 4Biological Engineering, Massachusetts
5
Institute of Technology, Cambridge, MA 02139 USA; 23Drivers – Engenharia, Inovação e
6
Ambiente, Lda, Lisbon, Portugal; 3Department of Mechanical Engineering, Instituto Superior
7
Técnico, Universidade de Lisboa, Lisbon, Portugal; 5MIT Portugal Program 8
*Corresponding Author: elsao@mit.edu 9 MIT / Room 8-403 10 77 Massachusetts Ave. 11 Cambridge, MA 02139-4307 12 Tel: (617) 253-0877 13 Fax: (617) 258-7471 14 15
Keywords: WEEE Preprocessing, Dynamic Product Flow Analysis (dPFA), Small Appliances
16
and Computer Devices (SACD), Economic Framework
17
18 19
Abstract
20
The challenges brought on by the increasing complexity of electronic products, and the criticality
21
of the materials these devices contain, present an opportunity for maximizing the economic and
22
societal benefits derived from recovery and recycling. Small appliances and computer devices
23
(SACD), including mobile phones, contain significant amounts of precious metals including gold
24
and platinum, the present value of which should serve as a key economic driver for many
25
recycling decisions. However, a detailed analysis is required to estimate the economic value that
26
is unrealized by incomplete recovery of these and other materials, and to ascertain how such
27
value could be reinvested to improve recovery processes. We present a dynamic product flow
28
analysis for SACD throughout Portugal, a European Union member, including annual data
29
detailing product sales and industrial-scale preprocessing data for recovery of specific materials
30
from devices. We employ preprocessing facility and metals pricing data to identify losses, and
31
develop an economic framework around the value of recycling including uncertainty. We show
32
that significant economic losses occur during preprocessing (over $70M USD unrecovered in
33
computers and mobile phones, 2006-2014) due to operations that fail to target high value
34
materials, and characterize preprocessing operations according to material recovery and total
35
costs.
36
Introduction
37
The consumer electronics industry has seen increased adoption rates, device diversification and
38
decreased product lifetimes all resulting in significant product proliferation. Effective disposal of
39
these devices, or management of Waste Electrical and Electronic Equipment (WEEE), has long
40
been a focus of environmental management policy, due primarily to concerns around human
41
health and ecosystem impact.1-4 More recently, high demand for, and fluctuating supplies of,
42
metals within such devices, the mining and primary processing of which includes additional
43
environmental and geopolitical impact,5 has renewed interest in the overall flow of these devices
44
at end-of-life. These ongoing efforts aim to discover where materials come to rest within the
so-45
called “urban mine”, and to quantify how the embedded value in particular electronic products
46
might drive material recovery.6-8
47
Despite the potential value present within these devices, collection rates for products and
48
materials recovery remains low. Limited materials recovery stems primarily from the lack of
49
actionable information within the recovery network. Simply put, it is often not clear a priori
50
whether the recovery of existing materials from used electronic devices is economically
51
competitive with procurement of “new” materials. The composition of the generated waste
52
stream is dynamic and offset in time and geographic location from the sale of the device, such
53
that the available materials for recovery are not considered at the point of recycling system
54
design. More specifically, there are several processes upstream of the actual metal recovery and
55
refinement processes (generally termed preprocessing), which dictate final process yields and
3
resulting value.9, 10 These combined factors can result in scenarios that are intended to promote
57
effective recycling – e.g., legislated recovery targets, grouping of printed circuit board (PCB)
58
levels upon collection, and recovery facility design – that do not align well with maximizing the
59
value recovered. Even when the amounts and locations of materials within devices are known, it
60
may not be clear whether and to whom the recycling of such materials at end-of-life presents
61
value.11
62
Through dynamic product and material flow analysis, coupled with detailed case data for
63
preprocessing facility performance, this work establishes an economic framework for the value
64
of recycling. Here we focus on the country of Portugal as a data-rich and well-defined recovery
65
network that employs advanced technologies within its facilities, and consider the system from
66
the point of sale to the preprocessing step for a subset of products that we term as small
67
appliances and computer devices (SACD). This categorization is our own term. It is consistent
68
with the classification of recovery data collected in Portugal that was grouped to include small
69
consumer products and industrial equipment that shared electronic components including PCBs,
70
and to exclude large products (including large household appliances and photovoltaic panels). By
71
considering the perspective of the preprocessor facilities within a particular country, we identify
72
losses in material recovery that could be reinvested in the system in that region. Even though a
73
preprocessor does not typically have visibility into the materials-level recovery potential, the
74
decisions at this stage limit maximum efficiency of downstream recovery and refinement steps
75
that define the secondary materials market.
76
Previous work to understand electronic waste recovery can be grouped into two distinct focus
77
areas: (1) product/material flows and urban mine characterization; and (2) recycling system
78
architecture and performance.
79
First, understanding overall material and product flows within the current recycling infrastructure
80
informs criticality assessments, access to the urban mine, legislative compliance, and design for
81
materials or product targeting. The foci of these studies have been twofold, to understand the
82
composition and flow of products and materials in the urban mine, and to analyze the losses
83
during the preprocessing and recovery stages of recycling. According to Georgiadis and Besiou,
84
the total amount of WEEE to enter the urban mine was projected to rise by 16-28% annually.12
85
Several studies have quantified the materials contained in a variety of electronic devices that
86
make up the urban mine, including but not limited to computers,7, 13 phones,14-19 and printers.7 In
87
2015, Chancerel et al. examined the quantities of critical metals in consumer equipment,
88
potential pathways for the removal of those metals, and the potential economic impacts of
89
recovery processes.20
90
Our analysis is modelled after work completed by several researchers in the areas of substance
91
and material flows. Navazo et al. used a material flow analysis to study the material and energy
92
impacts of the recovery process for mobile phone materials.21 Chancerel et al. used a substance 93
flow analysis to explore the flow of precious metals through the preprocessing stage of
recycling.22 Several other researchers have employed varying sets of tools, including system
95
dynamics and agent-based modeling, environmental impact assessments, and life cycle
96
assessments, to explore the recycling system and its impacts.2, 12, 23, 24
97
Second, researchers have investigated system architecture and performance to assess key
98
material losses, legislative costs, and the environmental and economic health of the system. In
99
2014, Navazo et al. detailed the material losses experienced during the processing and recovery
100
stages of electronic waste recycling.21 Meskers et al. provided an overview of the recycling and 101
recovery process for WEEE and batteries, which included an analysis of which materials drive
102
the economic argument for recycling, and the barriers to improved best practices.18 Hageluken
103
discussed the economic, environmental, and resource recovery opportunities surrounding the
104
processing of electronic waste, finding that value-based metrics are needed to supplement the
105
weight-based metrics specified in the WEEE Directive. The author also addressed tradeoffs
106
between manual and mechanical preprocessing, and challenges such as material comingling and
107
process capital costs.25 In 2009, Chancerel et al. analyzed the flow of one tonne of information
108
technology and telecommunications equipment (WEEE category 3) through the preprocessing
109
stages of recycling, including sorting, manual dismantling, and shredding, focusing on gold,
110
silver, palladium and platinum. This study identified losses at each stage of recycling, and
111
provided recommendations for system improvements.22 Several other studies have analyzed the
112
preprocessing stage of recycling and quantified key material and economic losses.19, 26, 27 Further,
113
impact assessments carried out by the United Kingdom’s Department for Business, Innovation,
114
and Skills (BIS), in conjunction with others, studied the economic costs and benefits of the most
115
recent WEEE Directive, listing impacts for businesses, government, and recyclers.28
116
Work to date has not emphasized how legislative decisions have influenced the potential
117
economic benefits of materials recovery. These factors could include the implications of how
118
products are categorized and the effectiveness of material mass-based targets. In addition, few
119
reports have analyzed the impact of targeted investments within the recycling system on overall
120
material recovery. Therefore, the work to date has been focused more on materials
121
characterization rather than on the economic viability of the system. The key contributions of the
122
present work include: 1) quantifying the value of potential materials recovery within SACD over
123
time and by material; and 2) informing operational and investment decisions from the
124
perspective of the preprocessor. In particular, we provide a framework for specific
125
recommendations in facility investment and product grouping for preprocessing facilities.
126
Through this analysis, we also support the evidence of the limitations inherent in material
mass-127
based metrics and targets.
128
The case presented involves materials recovery data specific to Portugal and accompanying
129
legislation within the European Union (EU). However, we provide conclusions as a function of
130
the characteristics in the system, which may be applicable to other EU nations because of
131
Portugal’s state-of-the-art technologies and participation in EU wide recycling initiatives.
5
Portugal has two take-back programs, Associação Portuguesa de Gestão de Resíduos (Amb3e)
133
and Associação Gestora de REEE (ERP Portugal), that organize the collection and treatment of
134
WEEE, and have been licensed by the government since 2006.29, 30 These organizations
135
participate in the WEEE Forum (the European Association of Electrical and Electronic Waste
136
Take Back Systems), an EU wide sector association that conducts benchmarking analysis of the
137
country-level performance of its members. Since 2006, operators in Portugal have complied with
138
the recycling and recovery targets set in the WEEE Directive, which was updated in 2012 as
139
2012/19/EU and legislates the treatment of electronic waste.31, 32
140
The following analysis demonstrates that, even with explicit consideration of the uncertainty
141
within the data, current operations include unrealized material recovery and associated economic
142
value. This value may be sufficient for reinvestment in preprocessing operations for the
143
increased recovery of specific SACD subsets, device components, and key materials.
144
Methods
145
The framework presented here identified the material and economic losses experienced
146
throughout the defined electronic waste supply chain, and identified which opportunities
147
existed to maximize the total recovered value for the system.
148
A dynamic product flow analysis (dPFA) was developed to determine the amount of materials
149
available for recovery using a methodology derived from work of Navazo and Chancerel et al.
150
and combined with a detailed assessment of preprocessing facilities.21, 22 We used dPFA to track
151
sales of SACD (Sp) through their projected lifetimes (Gp(t)), collection (Cp(t)), and preprocessing 152
(Rp(t)). At the point of preprocessing we applied detailed accounting for materials composition 153
by product and over time, preprocessing yields, and economic performance within preprocessing
154
facilities. It was also necessary to calculate the costs associated with each operation within the
155
preprocessing plants in an effort to guide potential investments aimed at reducing widespread
156
losses. An overall schematic of the methodology is provided in Figure 1.
157
158
Figure 1. Schematic of overall model methodology 159
WEEE entering preprocessing stock R in each year t was tracked by product group p, as detailed
160
below. Therefore, the mass (or units) of WEEE into preprocessing year t, Rp(t), was the amount 161
of WEEE generated Gp(t) multiplied by the fraction of products collected in that year Cp(t). 162
Thus, Gp(t) equaled the mass (or units) of products sold in the previous year Sp (indexed on s), 163
multiplied by the probability of reaching end-of-life in year t, λp, summed over all production 164
years prior to t. Therefore, the amount of product in preprocessing was calculated using the
165 following relationship. 166 𝑅! 𝑡 = 𝑆! ! !!!! 𝑠, 𝑡 ∗ 𝜆! 𝑠, 𝑡 ∗ 𝐶!(𝑡)
Rp in each year may be manually dismantled or shredded (or a combination of both), and 167
are then sorted into a range of categories based on material composition. Prior to being
168
shredded, the battery is removed from the device in accordance with de-pollution
169
regulations.33 The non-battery fractions, including components such as the PCB,
170
speaker(s), camera(s), and outside casings are then sent to the appropriate downstream
171
processes within the preprocessing facility. At the preprocessing stage, the total mass of
172
each material subcategory not recovered was multiplied by the approximate value for
173
which the material fraction could have been sold on the secondary materials market.
174
The remainder of this section contains an overview of data used in each dPFA step as
175
defined in Figure 1. Additional detail on the treatment of the data used in each of these
176
steps can be found in the supporting information. Finally, uncertainty has been calculated
177
in the sales, collection, preprocessing, and material composition data, empirically where
178
data allowed. Otherwise, a data quality indicator analysis was performed.34
179
Sales, Sp(t). The starting point for this analysis was the use of detailed SACD sales data
180
and projections for the years 2000 – 2014. These years were chosen due to the specificity
181
of data available. A large portion of the sales information was gathered by ANREEE in its
182
annual market data reports.35-42
183
SACD includes WEEE categories two through ten, as defined in the WEEE Directive:
184
small household appliances; IT and telecommunications equipment; consumer equipment;
185
lighting equipment; electrical and electronic tools; toys, leisure, and sports equipment;
186
medical devices; monitoring and control instruments; and automatic dispensers.43 The
187
heterogeneity of these device categories complicates characterization and definitions
188
focused on materials recovery processes. For this reason, we combined these WEEE
189
categories within five product groups that are based on the type of product, the quality of
190
its PCB and the materials contained within, and the projected lifespan of the device.
191
Please refer to Table S7 in the Supporting Information for a detailed breakdown of the
7
Figure 2. Mass of computers sold in 2005 that is generated until 2014 (primary axis) and the cumulative mass of computers generated over the same time period (secondary axis)
0 5,000 10,000 15,000 20,000 25,000 0 100 200 300 400 500 600 2005 2007 2009 2011 2013 Ma ss G en er ate d - C u m u la ti ve (T o n n es ) Ma ss G en er ate d - So ld in 2 00 5 (T o n n es ) Year Generated Sold in 2005 Cumulative Generation
Example Device Generation Curve
devices within each WEEE category into the five product groups below. The five product
193
groups used are as follows:
194 1. Computing Devices 195 2. Telecommunications Devices 196 3. Printers 197
4. Other with 20+ year mean lifespan
198
5. Other with 0-19 year mean lifespan
199
Generation, Gp(t). In the context of this model, a waste generation event was defined as
200
the point in which a device enters the waste stream, after being used and/or reused for an
201
amount of time determined by the assumed mean and standard deviation (SD) of its
202
lifespan. The distribution was assumed to be log-normal. According to the methodology
203
developed in this work and modelled after the work of Duan et al., the lifespan of each
204
device included initial use, initial storage, informal reuse, and reuse storage.6 Product
205
lifespan data were collected from various sources, including that of Duan et al., Geyer and
206
Blass, and Navazo et al., in conjunction with the Lifespan Database for Vehicles,
207
Equipment, and Structures.6, 21, 44, 45 Table S8 in the supporting information shows the 208
mean and standard deviations used for the lifespans of the five product groups. Figure 2
209
shows the mass generated (i.e., that entered the waste stream) by year for an example set
210
of computers sold in 2005 on the primary vertical axis (dashed line). The peak between
211
2010 and 2011 reflects the average lifespan of computing devices, as noted in Table S8.
212
The secondary vertical axis portrays the cumulative mass generated over that time period
213
(dotted line). The data shown in Figure 2 are for computers (product group 1) only and
214
the shading qualitatively represents the uncertainty in the data, which is propagated
215
throughout the analysis and shown quantitatively in Figure 4.
216 217 218 219 220 221 222 223 224 225 226 227 228 229 230 231 232 233
Collection, Cp(t). The collection rate varied by the product group and over time. It was 234
assumed that the collection rate for all devices prior to 2006 was 0% because there was a
235
limited formal collection system established prior to when Portugal transposed the WEEE
236
Directive. Data made available by Eurostat were used for all product groups for 2006 to
237
2013, and data calculated by our collaborators were used for 2014.29, 46 For 2006 to 2013,
238
the collection rates were calculated by dividing the mass of WEEE collected in a given
239
year by the mass put on the market in the preceding three years. For 2014, collection rates
240
were calculated by dividing the mass of WEEE generated in a given year by the mass of
241
WEEE collected in that year within the Portuguese recycling infrastructure.29 As of 2014,
242
the average collection rate for all SACD fell between 37.0% and 40.0%.29, 46-48 See Table
243
S6 in the supporting information for detailed collection data by year and by product group
244
including uncertainty.
245
Preprocessing, Rp(t). To calculate material recovery and loss during preprocessing, we
246
used data from sixteen preprocessing facilities within the recycling infrastructure of
247
Portugal collected by one of the authors.29 Among the 16 facilities, which comprise the
248
outstanding majority of plants in the country, there was a wide range of material recovery
249
percentages due to variances in their size and use of manual and mechanical separation
250
operations. Smaller plants (twelve in total) relied mostly on manual operations to dismantle
251
fractions for the purpose of recovering the PCB and any other valuable materials (i.e., copper).
252
Medium sized plants (three in total) relied less on manual dismantling, and were equipped with
253
medium sized shredders and separators for the processing, identification, and sorting of metals
254
and plastics. For the sole large plant, a majority of WEEE processing was done in large shredders
255
and separators (i.e., car shredders) along with other waste materials, such as end-of-life vehicles
256
(WEEE generally represented only a small percentage of the feedstock).
257
As a part of the aforementioned thesis, full-scale batch tests were performed by our collaborators
258
at the main operators in Portugal, representing more than 70% of the total installed capacity, to
259
evaluate the industrial technologies used to preprocess the WEEE.29 The shredded and
260
dismantled pieces produced by these technologies were divided into the following
261
material-level categories: ferrous, aluminium, copper, other metals, plastic, rubber,
262
textiles, cement, glass, wood, and other. For the dPFA, the category labelled other metals
263
was assumed to contain the following elements: Ag, Au, Pd, Pt, Co, Ni, Sn, Ta, W, and
264
other nonferrous metals except aluminum. Using this dataset in conjunction with
265
available literature, we determined the approximate material composition of all waste
266
streams and the recovery percentages for all metals and non-metals. Material composition
267
data for a device was broken down by product category and year manufactured. The two
268
time periods used for mobile phones were 2001 – 200515, 21 and 2006 – 2014.17-19 For the
269
remainder of the devices, a single time period of 2001 – 2014 was used.7, 13 See Tables S1-S5 of
270
the supporting information for a breakdown of the material composition data used in the
271
analysis, including uncertainty.
9 0.0 0.1 0.2 0.3 0.4 0.5 0.6 2001 2004 2007 2010 2013 Ma ss o f G o ld (T o n n es ) Year Generation Collection Preprocessing
Preprocessing operators, facility providers, and equipment providers supplied the cost
273
data on individual preprocessing operations within the Portuguese recycling system. The
274
data were divided into fixed costs and variable costs by operation (manual and
275
mechanical treatment) for each plant and varied based on the types of materials being
276
targeted and processed.29 The average fixed cost and variable cost to preprocess SACD
277
(using a combination of manual and mechanical dismantling) was 10 to 80 USD/tonne
278
and 125 to 175 USD/tonne, respectively. These cost data were compared to studies
279
completed by WRAP49, the WEEE Forum47, Ramboll and Fichtner,50 and the Department
280
for Business, Innovation, and Skills (BIS) in the United Kingdom.28 The purpose of this
281
comparison was to analyze the relative costs of preprocessing throughout the EU, in order
282
to verify the data collected from processors within the Portuguese system. 283
To calculate the potential profit lost during preprocessing we evaluated the economic
284
value of the recovered and lost materials as a source of potential revenue. Values were
285
assigned to each metal for each year based on annual data presented by the United States
286
Geological Survey (USGS) and the United States Department of the Interior.51, 52 All
287
values were adjusted to 2010 USD to account for inflation. See Table S9 in the supporting
288
information for a detailed breakdown of the material values used in the analysis.
289
Results
290
The growth of the electronics industry, and in particular the increasing diversity of materials
291
contained within SACD, provided a new opportunity to investigate economic potential for
292
materials recovery at the device end-of-life. We focused on the perspective of the preprocessor,
293
as facility infrastructure decisions at this stage of recycling hold significant impact for
294
downstream materials recovery that results in secondary material markets. The results detailed
295
below support the assertion that present day WEEE preprocessing is limited by inefficiencies
296
that reduce potential revenues for operators.
297
Figure 3 shows the result of the product and material flow analysis by mass, depicting the
298
quantity collected and then preprocessed over the years modelled. Here we provide an example
299
for the mass of gold in computers spanning 2001 – 2014 where the vertical axis indicates the
300
mass in tonnes in each year available upon generation (dashed line), after collection (dotted line)
301
and after preprocessing (solid line). The line corresponding to the mass generated at end-of-life
302
is a direct result of the dynamic PFA, and is derived from the assumed sales and lifetime
303
distribution of the products. The model assumed collection began in 2006 as shown by the red
304
arrow in Figure 3. Finally, the mass of gold recovered during preprocessing was based on the
305
data for the 16 preprocessors in Portugal. The arrow labeled “loss during collection” reflects
306
losses due to ineffective collection schemes and incomplete public awareness of and compliance
307
with collection streams for end-of-life electronic goods. The arrow labeled “loss during
308
preprocessing” represents operational inefficiencies that fail to target the high value materials
0.0 0.1 0.2 0.3 0.4 0.5 0.6 2001 2004 2007 2010 2013 Ma ss o f G o ld (T o n n es ) Year Generation Collection Preprocessing
locked in the devices’ PCBs. These losses can occur during both manual dismantling and
310
shredding. Based on our analysis, the largest loss of gold in 2014 was due to inefficient
311
collection (over 3 tonnes of gold left unrecovered), however, the mass lost during preprocessing
312
also represents significant economic potential (over 1 tonne of gold lost). The qualitative
313
uncertainty represented by the shading in Figure 3 was calculated for the material composition,
314
sales, collection, and preprocessing efficiency data, and carried throughout the analysis.
315 316 317 318 319 320 321
Figure 3. Mass of gold from computers at the generation, collection, and preprocessing stages of 322
recycling in Portugal over time. Arrows represent the materials losses incurred from inefficiencies 323
during collection and preprocessing. All values for mass are derived from the material composition 324
data in the PFA, and shading represents qualitative uncertainty. 325
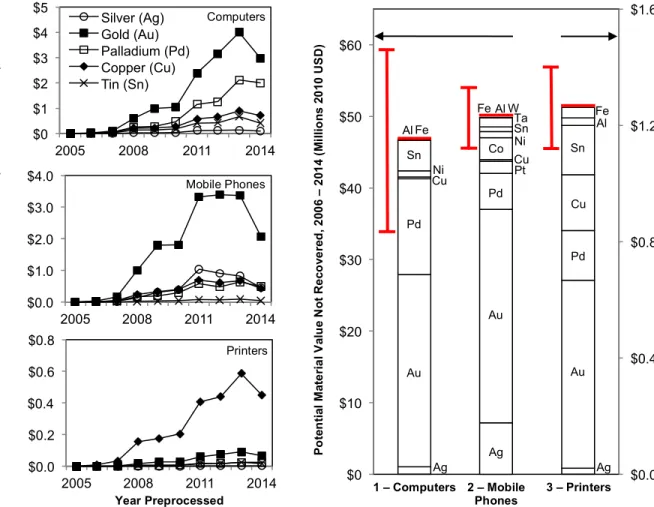
Figure 4a shows the individual market value by product group of materials recovered during
326
preprocessing (silver, gold, palladium, copper, and tin) for each year in the first three levels:
327
computers, mobile phones and printers. These trends over the years appear similar to those in
328
Figure 3, but represent the total market value of each material independently in millions of USD.
329
This figure represents the total value that is contained in the silver, gold, palladium, copper, and
330
tin found in the end-of-life electronics that are recovered at the preprocessing facilities. Due to
331
inefficient operational schemes, this value is lower than the potential recovery, as represented in
332
Figure 4b, although there is significant uncertainty in these figures.
333
We see from Figure 4 that the recovery of mobile phones and computers is driven by the
334
potential recovery of gold. This result is consistent with previous work that has indicated that
335
gold is the most important metal contributing to increasing the economic value of recycling.20, 53
336
The economics of printer recycling, on the other hand, is shown to be driven by the potential for
337
recovery of copper. This is because the mass of gold in the PCBs of printers is smaller than that
338
found in computers and mobile phones. Due to its larger size, the copper can be targeted more
339
easily and removed from printer PCBs.7
340
1
Material Loss - Collection
Collection Began
2
11
Figure 4b uses the same materials price data but quantifies the value of the lost material
341
corresponding to the arrow labeled “loss during preprocessing” found in Figure 3. For
342
computers and mobile phones, the majority of lost value again is in the gold not recovered based
343
primarily on incomplete separation of PCBs. Palladium is also a potentially valuable material
344
stream to target for increased recovery within the computer and phone product groups. For
345
printers, the losses were much less significant due to the high recovery rates of copper, but this
346
analysis also indicates that the increased recovery of gold, palladium, and tin would have the
347
greatest impact on reducing economic losses during preprocessing. The heterogeneity of the
348
devices within each product group and the operations used during preprocessing introduce
349
uncertainty into these results, with the largest contribution coming from the device composition
350
data (For clarity, uncertainty is only shown for Figure 4b). However, even at the lower bounds
351
of our uncertainty analysis, we found that the potential economic value not recovered in Portugal
352
during the specified time period exceeded $70M for the materials shown.
353
The quantification of the value of materials recovery within SACD over time and by material
354
demonstrates that a few key materials drive the recycling economics for electronic waste and that
355
there are significant losses for the case of Portugal. Studies have shown that this is also the case
356
for recycling systems in many other EU nations. Similar to the situation in Portugal, low
357
collection rates mean that only a fraction of the potential end-of-life devices arrive at facilities
358
able to separate and sort their contents, and that gold and other precious metals are key targets
359
for making system wide improvements.54, 55 360
Figures 3 and 4 include data only up to 2014 for two reasons. The first is that the goal of the
361
study was to analyze the current conditions of the recovery system, and to use that information to
362
inform future decision making, not to make predictions. The second is that fluctuations in
363
material prices made it difficult to project the economic implications of material losses into the
364
future.
365
Figure 4 focused only on the first three categories; we next summarize this potential across all
366
five product groups in Figure 5 and then discuss potential approaches for system improvement.
367 368 369 370 371 372 373 374
$0.0 $0.4 $0.8 $1.2 $1.6 $0 $10 $20 $30 $40 $50 $60 1 – Computers $0 $1 $2 $3 $4 $5 2005 2008 2011 2014 Silver (Ag) Gold (Au) Palladium (Pd) Copper (Cu) Tin (Sn) $0.0 $1.0 $2.0 $3.0 $4.0 2005 2008 2011 2014 $0.0 $0.2 $0.4 $0.6 $0.8 2005 2008 2011 2014 Ni Ni Al 375 376 377 378 379 380 381 382 383 384 385 386 387 388
Figure 4. (a) Total market value of materials recovered during preprocessing by product group in 389
2010 USD across 16 preprocessing plants within Portugal (b) Total potential market value not 390
recovered by product group from 2006 – 2014 and the metals impacting the economic losses (Error 391
bars represent one standard deviation). The values for computers and mobile phones are plotted on 392
the primary y-axis, and the values for printers are plotted on the secondary y-axis. 393
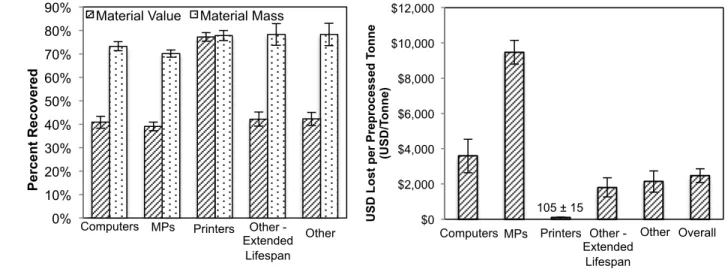
Figure 5a shows by product group, by mass (dotted, light grey), and by value (striped, dark
394
grey), the percentage of material recovered from 2006 - 2014. These data were calculated using
395
material recovery data within the PFA. Current EU legislation describes mass-based targets and
396
Figure 5a shows that these mass targets - ranging from 65-75% according to the WEEE Directive
397
- are met. However the value recovered is approximately 40-50% for all categories except for
398
printers. Previous authors have highlighted this gap between the metrics of system performance
399
as well, and noted that mass-based recycling targets do not encourage the targeting of precious
400
metals and other valuable materials locked into complex devices.20 Our work further supports
401
this conclusion. Figure 5b shows that by value the lost potential per tonne for mobile phones is
402
larger than the other categories studied because of the high value of the materials in the device
403
PCBs and the smaller mass of the individual devices and total flow of materials. These results
404
should be viewed as a way to compare across product categories rather than as absolute values,
405
due to the uncertainties inherent in the assumptions used in the dPFA and the heterogeneity of
406 preprocessing operations. 407 Computers Mobile Phones Printers 2 – Mobile Phones 3 – Printers Year Preprocessed To ta l M ar k et V al ue of M a te ri al s Re co ve re d (M ill io n s 2 0 10 US D) Po te n ti al M at e ri a l V al u e N o t R e co ve re d , 2 00 6 – 20 14 ( M il lio n s 201 0 U S D ) Ag Au Pd Ag Au Pd Al Sn Cu Fe Pt Cu Co Sn Ta W Fe Au Sn Cu Pd Fe Al Ag
13 0% 10% 20% 30% 40% 50% 60% 70% 80% 90% Pe rc en t R ec o ve re d
Material Value Material Mass
Computers MPs Printers Other - Extended Lifespan Other $0 $2,000 $4,000 $6,000 $8,000 $10,000 $12,000 U SD L o st p er Pr ep ro ce ss ed T o n n e (U SD /T o n n e) Computers MPs Other - Extended Lifespan Overall Other Printers 105 ± 15 408 409 410 411 412 413 414 415
Figure 5. (a) Comparison of material mass recovered versus material value recovered during 416
preprocessing for all product groups as calculated in the recycling system PFA (b) Total 2010 USD 417
lost per tonne of each product group that was preprocessed from 2006 – 2014 (Error bars represent 418
one standard deviation).
419
The results so far have shown that there is significant potential economic value not recovered
420
from electronic waste in Portugal. The model framework developed here can be used to inform
421
operational and investment decisions from the perspective of the preprocessor. Increased
422
recovery of materials will come at a cost to the facility in the form of additional equipment or
423
personnel. Our final analysis explores the impact of these potential investments.
424
The heterogeneity of the operations used by varying preprocessing plants presents challenges to
425
optimizing recovery across recycling systems. However, the results presented in our analysis can
426
provide useful insights into some of the tradeoffs between costs and recovery percentages for
427
high value materials. Among the 16 plants studied, the major difference that we observed was
428
the recovery of “other metals,” which includes high value nonferrous metals such as gold,
429
palladium, platinum and silver. This is due in large part to the fact that several of these plants are
430
not equipped to remove the PCBs from devices effectively, either through manual or mechanical
431
dismantling. For this analysis, we studied two primary operations, manual dismantling and
432
shredding. In manual dismantling, workers remove valuable materials from larger devices such
433
as laptops and printers and hazardous materials, such as the battery, from all devices. In
434
mechanical dismantling, or shredding, devices that have gone through the manual dismantling
435
step are shredded into pieces of varying sizes, and sorted using density-based, sensor, and other
436
technologies. The degree to which these machines can identify and remove valuable materials
437
plays a large role in the final economic output of the plant.
438
In order to make recommendations for future investments, we adopted several assumptions about
439
the data. First, for Figure 6 below, we considered in detail the data from three of the 16 plants.
440
Second, due to the low recovery rates and high values associated with so-called “other metals,”
441
we focused potential changes on fractions or processes containing other metals. In addition,
based on fieldwork, we assumed that these plants had made process updates since they were
443
analyzed fully in 2012. It is for this reason that high recovery rates are observed for several
444
residual waste streams. Lastly, we assumed that the recovery rate of gold was the same as that
445
for all “other metals” due to the fact that many of them are found in the PCB.
446
Figure 6 presents data from these three plants that could be used to inform future investments.
447
Due to the complexity of these systems, any investments made would need to consider
448
downstream impacts on other systems at the plants, evolving process inputs, material market
449
prices, and many other factors. The horizontal axis indicates the material value of the entire
450
output fraction containing other metals, divided by the tonnes of that fraction preprocessed by a
451
given plant in a year. The vertical axis indicates the recovery percentage of other metals for a
452
given fraction, divided by the fixed and variable costs associated with the preprocessing of that
453
fraction. All values used in Figure 6 were calculated as a part of the dPFA in accordance with the
454
previously described methodology. The points highest on the graph, shown in blue, represent
455
those processes for which the largest amount of material can be recovered at the lowest cost. In
456
this case, each of these points represents a manual dismantling process, due in large part to the
457
low capital costs of hiring more people as compared to installing shredders and separators. Also,
458
the further to the right that a point is located (points shown in orange), the higher the value of the
459
materials contained in that fraction relative to the tonnes preprocessed. The orange highlighted
460
area includes process streams from both manual and mechanical dismantling. These are
461
significant because they represent fractions containing high value materials that have been
462
targeted, even though the mass of that fraction is small in comparison to others, such as the
463
ferrous metals. Therefore, the red arrow in the figure points to the desired area of the graph in
464
terms of framing future investments, where high recovery percentages of valuable materials at
465
the lowest costs occur. Overall, the vertical axis is concerned with the process that a given
466
fraction undergoes during preprocessing, and the horizontal axis conveys the make-up and
467
quantity of that fraction.
468
Downstream processing and refining was not included as a part of the present analysis, but it is
469
necessary to consider the costs associated with these processes in order to make investment
470
decisions. The costs of refining and recovery of metals from preprocessed fractions ranges from
471
approximately $500 to $2,500 USD per tonne. Within this range, the cost of recovering the
472
metals in PCBs is approximately $1,500 USD per tonne.29 These values are only assumptions,
473
and may vary greatly across companies and treatment technologies used.
474 475 476 477 478
15 479 480 481 482 483 484 485 486 487
Through this data-driven analysis, we identified opportunities for investment that could increase
488
recovery and realize increased economic value of materials at the preprocessing stage of
489
recycling. These findings are consistent with several studies completed in the past, and are
490
strengthened by the addition of granular material market value data.19, 21, 22, 26, 27, 56, 57 For
491
example, incrementally adding workers to dismantle devices is the most effective way to
492
increase the recovery percentages of “other metals” at the lowest up front cost. Additionally,
493
making investments in mechanical dismantling that prioritize sorting operations post-shredding
494
will have the largest impact on recovery rates, especially for those metals that are found in the
495
PCB. This can be seen in the orange region, where most of the losses of other metals are due to
496
PCBs that end up in waste streams. If facilities are able to minimize lost PCBs or recover other
497
metals from material streams, then a higher economic value can be extracted. Certainly, the
498
exact magnitude of any investments would need to be determined on a case-by-case basis
499
depending on the location of the plant, the costs, the materials preprocessed, and several other
500
factors. However, these findings provide a methodology and framework to identify specific
501
operational and systems-level modifications that can drive decisions on the economic viability of
502
materials recovery. The major implication of these findings for the preprocessing industry is the
503
potential for an optimization of plant operations based not only on total mass recovered, but also
504
on the economic value contained in the WEEE. We have also provided evidence for the
505
importance of utilizing granular materials characterization data in the operational decision
506
making process.
507
Overall, the key contributions of this work are twofold. First, we have quantified the economic
508
value of materials lost due to inefficient preprocessing schemes for 16 plants in Portugal
509
including uncertainty. The results presented as a part of this analysis can also be used to analyze
510
Figure 6. Normalized process and material data showing the tradeoffs between recovery percentages, costs, material values, and tonnes preprocessed.
0.000 0.001 0.002 0.003 0.004 0.005 0.006 0.007 0.008 0.10 1.00 10.00 100.00 1,000.00 10,000.00 100,000.00 R ec o ve ry Pe rc en ta g e G o ld / Pr ep ro ce ss in g C o sts
Material Value/Tonnes Preprocessed (All Waste) [Log Scale]
Manual Mechanical 1 Mechanical 2
preprocessing plants throughout the EU, as well as other regions and nations. Second, we have
511
provided results that can be used to inform operational and investment decisions from the
512
perspective of the preprocessor. Future work in this area could include an analysis of the
513
economic implications of updating a specific process within a given plant on the final output and
514
other processes at that plant and further downstream in the recycling system. In addition, future
515
research on the effectiveness of specific operations to identify and remove valuable materials
516
from complex input streams could help inform the decision-making schemes of preprocessors as
517
to which materials to target. Such data-driven, material-specific analysis of this key recycling
518
stage could aid a larger effort in efficient use of material resources that would have broad impact,
519
albeit moderated strongly by regional policies and operations.
520
Acknowledgement
521
This publication was made possible by the generous support of the Government of Portugal
522
through the Portuguese Foundation for International Cooperation in Science, Technology, and
523
Higher Education, and was undertaken in the MIT Portugal Program.
524
Supporting Information Available
525
Supporting information in the form of an 18-page pdf file including 9 tables is available at
526
http://pubs.acs.org.
527
References
528
1. Widmer, R.; Oswald-Krapf, H.; Sinha-Khetriwal, D.; Schnellmann, M.; Boni, H. Global
529
perspectives on e-waste. Environmental Impact Assessment Review 2005, 25 (5), 436-458.
530
2. Lam, C. W.; Lim, S. R.; Schoenung, J. M. Linking material flow analysis with
531
environmental impact potential. Journal of Industrial Ecology 2013, 17 (2), 299-309.
532
3. Williams, E.; Kahhat, R.; Allenby, B.; Kavazanjian, E.; Kim, J.; Xu, M. Environmental,
533
social, and economic implications of global reuse and recycling of personal computers.
534
Environmental Science & Technology 2008, 42 (17), 6446-6454.
535
4. Mianqiang, X.; Alissa, K.; Zhenming, X.; Schoenung, J. M. Waste management of
536
printed wiring boards: A life cycle assessment of the metals recycling chain from liberation
537
through refining. Environmental Science & Technology 2015, 49 (2), 940-947.
538
5. Bauer, D.; Diamond, D.; Li, J.; McKittrick, M.; Sandalow, D.; Telleen, P. U.S.
539
Department of Energy Critical Materials Strategy. In Energy, D. o., Ed. U.S. Department of
540
Energy Office of Policy and International Affairs (PI): 2011; p 196.
541
6. Duan, H.; Miller, T. R.; Gregory, J.; Kirchain, R.; Linnell, J. Quantitative
542
Characterization of Domestic and Transboundary Flows of Used Electronics; Analysis of
543
Generation, Collection, and Export in the United States; StEP Initiative: 2013.
544
7. Oguchi, M.; Murakami, S.; Sakanakura, H.; Kida, A.; Kameya, T. A preliminary
545
categorization of end-of-life electrical and electronic equipment as secondary metal resources.
546
Waste Management 2011, 31, 2150-2160.
17
8. Kang, H. Y.; Schoenung, J. M. Economic analysis of electronic waste recycling:
548
Modeling the cost and revenue of a materials recovery facility in California. Environmental
549
Science & Technology 2006, 40 (5), 1672-1680.
550
9. Jianbo, W.; Zhenming, X. Disposing and recycling waste printed circuit boards:
551
Disconnecting, resource recovery, and pollution control. Environmental Science & Technology
552
2015, 49 (2), 721-733. 553
10. Jinhui, L.; Xianlai, Z.; Mengjun, C.; Ogunseitan, O. A.; Stevels, A. "Control-Alt-Delete":
554
Rebooting solutions for the e-waste problem. Environmental Science & Technology 2015, 49
555
(12), 7095-7108.
556
11. Nicolli, F.; Johnstone, N.; Söderholm, P. Resolving failures in recycling markets: The
557
role of technological innovation. Environmental Economics & Policy Studies 2012, 14 (3),
261-558
288.
559
12. Georgiadis, P.; Besiou, M. Environmental and economical sustainability of WEEE
560
closed-loop supply chains with recycling: A system dynamics analysis. International Journal of
561
Advanced Manufacturing Technology 2010, 47 (5), 475-493.
562
13. Szalatkiewicz, J. Metals content in printed circuit board waste. Polish Journal of
563
Environmental Studies 2014, 23 (6), 2365-2369.
564
14. Fitzpatrick, C.; Olivetti, E.; Reed Miller, T.; Roth, R.; Kirchain, R. Conflict minerals in
565
the compute sector: Estimating extent of tin, tantalum, tungsten, and gold use in ICT products.
566
Environmental Science & Technology 2015, 49 (2), 974-981.
567
15. Huisman, J. QWERTY and Eco-Efficiency Analysis on Cellular Phone Treatment in
568
Sweden; TU Delft: Delft, 2004; pp 1-33.
569
16. Materials Case Study 1: Critical Metals and Mobile Devices; OECD: Belgium, 2010; pp
570
1-84.
571
17. Marin, C. GRID-Arendal - Cell Phone Composition.
572
http://www.grida.no/graphicslib/detail/cell-phone-composition_1057.
573
18. Meskers, C. E.; Hageluken, C.; Van Damme, G.; Howard, S. M. In Green Recycling of
574
EEE: Special and Precious Metal Recovery from EEE, EPD Congress 2009, San Francisco, CA,
575
USA, 2009; Howard, S. M., Ed. Metals & Materials Society (TMS): San Francisco, CA, USA,
576
2009.
577
19. Meskers, C. E. M.; Hageluken, C.; Salhofer, S.; Spitzbart, M. In Impact of
Pre-578
Processing Routes on Precious Metals Recovery from PCs, European Metallurgical Conference,
579
Innsbruck, Austria, 2009; Harre, J., Ed. GDMB: Innsbruck, Austria, 2009; p 16.
580
20. Chancerel, P.; Marwede, M.; Nissen, N. F.; Lang, K.-D. Estimating the quantities of
581
critical metals embedded in ICT and consumer equipment. Resources, Conservation & Recycling
582
2015, 98, 9-18. 583
21. Valero Navazo, J.; Villalba Méndez, G.; Talens Peiró, L. Material flow analysis and
584
energy requirements of mobile phone material recovery processes. International Journal of Life
585
Cycle Assessment 2014, 19 (3), 567-579.
586
22. Chancerel, P.; Meskers, C. E. M.; Hagelüken, C.; Rotter, V. S. Assessment of precious
587
metal flows during preprocessing of waste electrical and electronic equipment. Journal of
588
Industrial Ecology 2009, 13 (5), 791-810.
589
23. Bollinger, L. A.; Davis, C.; Nikolić, I.; Dijkema, G. P. J. Modeling metal flow systems.
590
Journal of Industrial Ecology 2012, 16 (2), 176-190.
24. Deng, L.; Babbitt, C. W.; Williams, E. D. Economic-balance hybrid LCA extended with
592
uncertainty analysis: case study of a laptop computer. Journal of Cleaner Production 2011, 19,
593
1198-1206.
594
25. Hageluken, C. In Improving Metal Returns and Eco-Efficiency in Electronics Recycling -
595
A Holistic Approach for Interface Optimisation between Pre-Processing and Integrated Metals
596
Smelting and Refining, 2006 IEEE International Symposium on Electronics and the Environment
597
(IEEE Cat. No. 06CH37796), Scottsdale, AZ, USA, 2006; IEEE: Scottsdale, AZ, USA, 2006.
598
26. Hageluken, C.; Meskers, C. Technology Challenges to Recover Precious and Special
599
Metals from Complex Products; http://ewasteguide.info/files/Hageluecken_2009_R09.pdf, 2009.
600
27. Chancerel, P.; Bolland, T.; Rotter, V. S. Status of pre-processing of waste electrical and
601
electronic equipment in Germany and its influence on the recovery of gold. Waste Management
602
& Research: The Journal of the International Solid Wastes & Public Cleansing Association,
603
ISWA 2011, 29 (3), 309.
604
28. Impact Assessment of the Recast Directive 2012/19/EU on Waste Electrical and
605
Electronic Equipment (WEEE); Department for Business, Innovation and Skills (BIS): United
606
Kingdom, 2013.
607
29. Santos, E. L. M. Mapping, Modelling and Improving the WEEE Treatment and
608
Recovery: A Portuguese Case Study. Universidade de Lisboa Instituto Superior Técnico,
609
Portugal, 2013.
610
30. Salema, M. I. G.; Barbosa-Povoa, A. P.; Novais, A. Q. In Design of a Recovery Network
611
in Portugal: The Electric and Electronic Equipment Case, 2008 IEEE International Engineering
612
Management Conference (IEMC-Europe 2008), Estoril, Portugal, 2008; IEEE: Estoril, Portugal,
613
2008.
614
31. Relatorio de Actividades 2014; Portugal, 2014; pp 1-185.
615
32. Relatorio Anual de Actividades 2013; Portugal, 2013; pp 1-144.
616
33. Directive 2006/66/EC Of The European Parliament And Of The Council of 6 September
617
2006 on batteries and accumulators and waste batteries and accumulators and repealing Directive
618
91/157/EEC. In Council, E., Ed. European Union: 2006; p 14.
619
34. Frischknecht, R.; Jungbluth, N.; Althaus, H.-J.; Doka, G.; Dones, R.; Heck, T.; Hellweg,
620
S.; Hischier, R.; Nemecek, T.; Rebitzer, G.; Spielmann, M. The ecoinvent database: Overview
621
and methodological framework. International Journal of Life Cycle Assessment 2005, 10 (1),
3-622
9.
623
35. Valores do Mercado Português de EEE em 2007; Portugal, 2008; pp 1-6.
624
36. Valores do Mercado Português de EEE em 2008; Portugal, 2009; pp 1-6.
625
37. Portugal 2009: Market Data of Electrical and Electronic Equipments; Portugal, 2010; pp
626
1-9.
627
38. Dados de Mercado EEE em Portugal 2010; Portugal, 2011; pp 1-14.
628
39. Dados de Mercado EEE 2011; Portugal, 2012; pp 1-10.
629
40. Dados de Mercado de 2012 de Equipamentos Eléctricos e Eletrónicos; Portugal, 2013;
630
pp 1-12.
631
41. Dados de Mercado Equipamentos Elétricos e Eletrónicos 2013; Portugal, 2014; pp 1-12.
632
42. Market Report - Electric and Electronic Equipment; Portugal, 2014; pp 1-12.
633
43. WEEE Compliance - Categories of WEEE.
634
http://weee.clarity.eu.com/categories_of_eee.php.
635
44. Geyer, R.; Blass, V. D. The economics of cell phone reuse and recycling. International
636
Journal of Advanced Manufacturing Technology 2010, 47 (5-8), 515-525.
19
45. Daigo, I.; Hashimoto, S.; Murakami, S.; Oguchi, M.; Tasaki, T. Lifespan Database for
638
Vehicles, Equipment, and Structures: LiVES. http://www.nies.go.jp/lifespan/index-e.html.
639
46. Eurostat - Waste Electrical and Electronic Equipment (WEEE).
640
http://ec.europa.eu/eurostat/web/waste/key-waste-streams/weee.
641
47. 2008 Key Figures - Key Figures on Quantities of Electrical and Electronic Equipment
642
Put on the Market, Quantities of WEEE Collected, and Costs Related to WEEE Management;
643
European Union, 2010; pp 1-14.
644
48. WEEE Forum Key Figures Report 2010-2012; European Union, 2014; pp 1-18.
645
49. Haig, S.; Morrish, L.; Morton, R.; Wilkinson, S. Electrical Product Material
646
Composition; United Kingdom, 2012; pp 1-10.
647
50. Fichtner, R. Technical Assistance For Waste from Electrical and Electronic Equipment
648
(WEEE) Directive Implementation; Study on Costs Related to the Implementation of the WEEE
649
Directive; 2007; pp 1-27.
650
51. Metal Prices in the United States Through 2010; United States Geological Survey:
651
Reston, Virginia, 2013; p 204.
652
52. Mineral Commodity Summaries 2015; United States Geological Survey: Reston,
653
Virginia, 2015; p 196.
654
53. Cucchiella, F.; D’Adamo, I.; Lenny Koh, S. C.; Rosa, P. Recycling of WEEEs: An
655
economic assessment of present and future e-waste streams. Renewable and Sustainable Energy
656
Reviews 2015, 51, 263-272.
657
54. Buchert, M.; Manhart, A.; Bleher, D.; Pingel, D. Recycling Critical Raw Materials from
658
Waste Electronic Equipment; 2012; pp 37-41, 58-74.
659
55. Tojo, N.; Manomaivibool, P. The Collection and Recycling of Used Mobile Phones; Case
660
Studies of Selected European Countries; Lund University: IEEE, 2011; p 66.
661
56. van Schaik, A.; Reuter, M. A. Dynamic modelling of E-waste recycling system
662
performance based on product design. Minerals Engineering 2010, 23, 192-210.
663
57. Menad, N.; Kanari, N.; Menard, Y.; Villeneuve, J. Process simulator and environmental
664
assessment of the innovative WEEE treatment process. International Journal of Mineral
665
Processing 2016, 148, 92-99.
666 667