HAL Id: hal-00318044
https://hal.archives-ouvertes.fr/hal-00318044
Submitted on 3 Jul 2006
HAL is a multi-disciplinary open access
archive for the deposit and dissemination of
sci-entific research documents, whether they are
pub-lished or not. The documents may come from
teaching and research institutions in France or
abroad, or from public or private research centers.
L’archive ouverte pluridisciplinaire HAL, est
destinée au dépôt et à la diffusion de documents
scientifiques de niveau recherche, publiés ou non,
émanant des établissements d’enseignement et de
recherche français ou étrangers, des laboratoires
publics ou privés.
gravity wave effects in the polar mesosphere during the
MaCWAVE program
C. L. Croskey, J. D. Mitchell, M. Friedrich, F. J. Schmidlin, R. A. Goldberg
To cite this version:
C. L. Croskey, J. D. Mitchell, M. Friedrich, F. J. Schmidlin, R. A. Goldberg. In-situ electron and
ion measurements and observed gravity wave effects in the polar mesosphere during the MaCWAVE
program. Annales Geophysicae, European Geosciences Union, 2006, 24 (4), pp.1267-1278.
�hal-00318044�
www.ann-geophys.net/24/1267/2006/ © European Geosciences Union 2006
Annales
Geophysicae
In-situ electron and ion measurements and observed gravity wave
effects in the polar mesosphere during the MaCWAVE program
C. L. Croskey1, J. D. Mitchell1, M. Friedrich2, F. J. Schmidlin3, and R. A. Goldberg4
1Pennsylvania State University, Department of Electrical Engineering, University Park, PA 16802, USA 2Graz University of Technology, A-8010 Graz, Austria
3NASA/Goddard Space Flight Center, Wallops Flight Facility, Code 972, Wallops Island, VA 23337, USA
4NASA/Goddard Space Flight Center, Laboratory for Solar and Space Physics, Code 612.3, Greenbelt, MD 20771, USA
Received: 6 October 2005 – Revised: 23 February 2006 – Accepted: 4 May 2006 – Published: 3 July 2006
Part of Special Issue “MaCWAVE: a rocket-lidar-radar program to study the polar mesosphere during summer and winter”
Abstract. Langmuir probe electron and ion measurements
from four instrumented rockets flown during the MaCWAVE (Mountain and Convective Waves Ascending VErtically) program are reported. Two of the rockets were launched from Andøya Rocket Range, Norway, in the summer of 2002. Electron scavenging by ice particulates produced reductions of the electron density in both sharp narrow (≈1–2 km) lay-ers and as a broad (≈13 km) depletion. Small-scale irregu-larities were observed in the altitude regions of both types of electron depletion. The scale of the irregularities extended to wavelengths comparable to those used by ground-based radars in observing PMSE. In regions where ice particles were not present, analysis of the spectral signatures provided reasonable estimates of the energy deposition from breaking gravity waves.
Two more instrumented rockets were flown from Esrange, Sweden, in January 2003. Little turbulence or energy deposi-tion was observed during one flight, but relatively large val-ues were observed during the other flight. The altitude distri-bution of the observed turbulence was consistent with obser-vations of a semidiurnal tide and gravity wave instability ef-fects as determined by ground-based lidar and radar measure-ments and by falling sphere measuremeasure-ments of the winds and temperatures (Goldberg et al., 2006; Williams et al., 2006).
Keywords. Atmospheric composition and structure
(Aerosols and particles) – Meteorology and atmospheric dynamics (Middle atmosphere dynamics; Turbulence)
Correspondence to: C. L. Croskey
(ccroskey@psu.edu)
1 Introduction
The state of the polar mesosphere is influenced by a num-ber of energy sources that can be driven either globally or lo-cally. The MaCWAVE (Mountain and Convective Waves As-cending VErtically) program was designed to determine the connection between some of the possible energy sources and the corresponding responses in the mesosphere and lower thermosphere (MLT). While tidal forces can directly influ-ence the MLT, another common mechanism for the trans-port of energy is through gravity waves, which propagate up-wards from the Earth’s surface. There can be many possible sources of gravity waves, such as topography, wind shear, convection, geostrophic adjustment, wave-wave interaction, energetic particle precipitation, etc. (Fritts, 1993; Fritts and Alexander, 2003). Tropospheric convective activity, which commonly occurs during the summertime, was the planned source for the summer MaCWAVE launch sequences that were conducted from Andøya Rocket Range in northern Nor-way. This location was chosen because of the availability of ground-based radar and lidar support facilities, which pro-vided important data about the state of the atmosphere at the time of the rocket launches.
Gravity waves can also be generated by the movement of winds over orographic features such as a mountain range. The winter MaCWAVE program was designed to investi-gate this source mechanism and consisted of rocket launches from Esrange in northern Sweden. Prevailing winds across the mountain range located to the west of the launch range were expected to create gravity waves whose effects would be seen in the MLT. Both the summer and winter MaCWAVE programs included a large number (∼25 and 20) of mete-orological rockets for the determination of the winds and temperatures over four separate 12-h intervals.
Fig. 1. Instrument configuration for the Terrier-Orion rockets of the
MaCWAVE program.
A large instrumented rocket was also included within each 12-h salvo. The primary data instruments of these Terrier-Orion rocket payloads were a pair of forward- and aft-mounted Langmuir probes. The probes’ DC current data were used to determine the large-scale characteristics of the electron and ion densities. At the same time, high-gain AC channels were used to detect small-scale irregularities in the electron and ion currents. These AC data permitted deter-mination of the energy dissipation when the gravity waves became unstable and deposited energy in the region. Gold-berg et al. (2004; 2006) have provided overviews of the lo-gistics and results of the MaCWAVE program. In this work we describe in detail the results from the Langmuir probe measurements.
2 Payload configuration
Each of the four instrumented MaCWAVE rockets carried es-sentially the same payload consisting of Langmuir probes, blunt probes, and a radio-wave propagation experiment (Fig. 1). A Langmuir probe was positioned on the central axis at each end of the payload to enable charge collection under both ram and wake flow conditions throughout
essen-tially the entire flight. The front hemispherical collector was extended forward of the main body to ensure that the shock front from the payload structure would not perturb the aero-dynamic flow at the collector. Multiple telemetry data chan-nels were used to properly handle the wide dynamic range of the measured currents. The outputs of the logarithmic elec-trometers were processed by several different “DC” channels of different gain values. The data were also highpass filtered on the payload to reduce the effects of spin modulation and then transmitted to ground via multiple “AC” gain channels. The DC channels enabled the measurements of the electron and positive- and negative-ion currents/concentrations, while the AC channels were used to detect spectral features associ-ated with encountered plasma density irregularities.
Because two of the flights were scheduled for launch dur-ing summertime conditions at a high latitude site, we ex-pected that ice particles would be present. Therefore two screened blunt probes (Mitchell et al., 2001) were added to each end of the payload but located well behind the Lang-muir probe. These instruments were used to identify altitude regions where large ice particles were present; such parti-cles are not affected very much by the shock front from the more forward Langmuir probe. We have used DSMC (Direct Simulation Monte Carlo) computer modeling (Hor´anyi et al., 1999; Mitchell et al., 2005) to determine the particle trajec-tories around the blunt probe structure. One blunt probe was biased at +2.5 volts, and the other at –2.5 volts. The alternate bias voltages help to identify the polarity of the ice particles that are found (Mitchell et. al., 2005).
A radio-wave propagation experiment on the same pay-load measured the phase of the polarization between signals of three different pairs of frequencies (1.300 and 7.835 MHz, 2.200 and 7.835 MHz, and 3.883 and 7.835 MHz). These sig-nals were received by the same dipole antenna, which elimi-nated orientation errors caused by coning of the payload. As the payload ascended, the lower, more sensitive frequency signals were absorbed, and the next higher frequency pair was used. The Faraday rotation technique for obtaining ab-solute electron density avoids problems of payload charging and aerodynamic effects (Bennett et al., 1972; Jacobsen and Friedrich, 1979); however, the altitude resolution is limited to the spin rate of the rocket.
Although it is well known that simple classical Langmuir probe theory is inadequate to describe the relationship be-tween the electron density and collected current in the transi-tion/collisional regimes, we use this simple theory (Thrane, 1986) as a starting point in processing the Langmuir data. Absolute calibration of the electron density values is made though use of the results of the Faraday rotation experi-ment. This is accomplished by the application of an empir-ical, altitude-dependent correction term to force agreement with the Faraday data. While the Faraday experiment cannot resolve fine structure in the electron density profile, its use ensures that the large-scale features of the Langmuir probe are correctly scaled.
As previously noted, the same configuration of a Lang-muir probe and two blunt probes was also included on the aft experiment deck of the payload. During the upleg portion of the flight, these instruments operated in the wake, and both the forward Langmuir probe and aft Langmuir probe were bi-ased at +5 volts to collect negative charges. As described in a following section, the polarity of the collection voltage of the aft Langmuir probe was reversed at apogee. During the downleg portion of the flight, this “aft” probe now operated in ram flow conditions and collected positive ions.
3 Results: Langmuir probe electron measurements
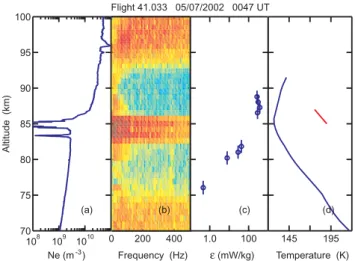
The payload on NASA Flight 41.033 was launched from Andøya Rocket Range, Norway, on 5 July 2002, at 00:47 UT. In Fig. 2 we show an expanded view of the data in a for-mat to emphasize the relationship between the observed elec-tron densities, the irregularities in the plasma, and the calcu-lated energy dissipation rates. As discussed by Goldberg et al. (2004), strong PMSEs (polar mesosphere summer echoes) were observed at the time of the rocket flight, and their ef-fects are shown in Fig. 2a. The electron bite-out due to scav-enging by aerosol particles was observed by both the Fara-day rotation experiment (Croskey et al., 2004) and to higher altitude resolution by the Langmuir probe. Data from the screened blunt probes show the presence of heavy aerosols in this bite-out region (Mitchell et al., 2005). The correlation of the sporadic-E layer seen at 96 km to a sudden sodium layer observed by the ground-based Weber sodium lidar is discussed by Williams et al. (2006).
Figure 2b shows a spectrogram of the electron density ir-regularities observed by the Langmuir probe. For some of the spectra, significant amounts of power extend to frequen-cies of several hundred Hertz, which correspond to scales less than 3 m. For comparison, the inner scale (Eq. 1) iden-tifies the length scale, l0H, between the inertia and viscous subranges. l0H =9.9 ∗ υ 3 ε !1/4 . (1)
In this altitude region, the kinematic viscosity, υ, is of order 1 m2/s, and if the energy dissipation rate, ε, is 1 W/kg (a large value), the inner scale is 9.9 m. Smaller energy dissipation rates produce even larger values for the inner scale. Molec-ular diffusion rapidly destroys velocity fluctuations in struc-tures that are smaller than the inner scale. Thus the spectral shape of neutral turbulence is expected to rapidly decrease for such small scales. However, as others have noted (Kel-ley et al., 1987; Rapp and L¨ubken, 2003), charged particles modify the electron diffusivity, producing plasma variations to scales smaller than three meters. Such structure is respon-sible for the extremely large radar echoes known as PMSEs, but it precludes the use of the plasma density fluctuations as
108 109 1010 70 75 80 85 90 95 100 Altitude (km) (a) 0 200 400 (b) 1.0 100 (c) 145 195 (d) Ne (m ) Frequency (Hz) (mW/kg) Temperature (K)-3 ε Flight 41.033 05/07/2002 0047 UT
Fig. 2. Data obtained 5 July 2002, 00:47 UT (Flight 41.033) from
Andøya, Norway. (a): electron density; (b) negative charge irregu-larities; (c), inferred energy dissipation rates; (d), neutral tempera-ture measured by an adjacent falling sphere flight. The red line in (d) indicates the slope of the adiabatic lapse rate.
a tracer of neutral turbulence. On the other hand, in regions where such particles are not present, plasma density irregu-larities can be used to identify regions of neutral turbulence, as demonstrated by Croskey et al. (2004) using a compari-son of the results from these data with the neutral turbulence values determined by an open ionization gauge carried by a companion rocket (Rapp et al. 2004).
A theoretical model of the spectral shape produced by tur-bulence (Heisenberg, 1948) is fitted to the individual spectra of Fig. 2b to determine the inner scale, where the slope of the inertia range (–5/3) changes to the slope of the viscous dissipation range (–7). Unfortunately the fundamental of the payload roll rate (∼5.5 Hz) and harmonics (∼11 Hz, 16.5 Hz, etc.) fall into the spectral range of interest. This problem is resolved by filtering in the frequency domain. The data sample rate is 5000 sps, and relatively long time segments of 8192 samples each are used. The resulting signal spec-tra has a frequency bin spacing of 0.61 Hz, which is suffi-cient to resolve the “picket fence” produced by the harmon-ics of the payload roll rate. The spectrum is then resampled in the frequency domain by choosing the values that occur “midway” between the roll harmonics, e.g., 2.4 Hz, 7.9 Hz, 14.0 Hz, 20.1 Hz, etc. An example of the process is shown in Fig. 3. In this example the primary result has been the rejection of the fundamental at 5.5 Hz. As will be shown later, when the same procedure is applied in a region without turbulence, the filtered spectrum is very different from the unfiltered spectrum.
The energy dissipation rates corresponding to the spectra of Fig. 2b are shown in Fig. 2c. Because a fairly long FFT window was needed to properly remove the effects of the payload roll rate, each spectrum represents the average over
100 101 102 103 40 50 60 70 80 90 100 110 120 130 140 Frequency (Hz)
Relative power spectral density (dB)
Full spectrum Selected spectrum Heisenberg fit Flight 41.033 05/07/2002 0047 UT Alt. = 88.0 km
Fig. 3. An example from Flight 41.033 of the use of frequency
domain filtering to reduce the effects of payload roll modulation on the Heisenberg spectra fit. (Altitude = 88.0 km.)
108 109 1010 70 75 80 85 90 95 100 Altitude (km) (a) 0 200 400 (b) 1.0 100 (c) 145 195 (d) Flight 41.032 01/07/2002 2356 UT Ne (m ) Frequency (Hz) (mW/kg) Temperature (K)-3 ε
Fig. 4. Same as Fig. 2 except data obtained 1 July 2002, 23:56 UT
(Flight 41.032), from Andøya, Norway.
an ∼1.6 km interval. This averaging over distance is illus-trated with the vertical “error bars”.
In the altitude region of the electron bite-out (Fig. 2a), the spectral energies shown in Fig. 2b extend to much higher frequencies. Although Heisenberg fits can be made to these spectra, the resulting energy dissipation rates are extremely large. The observed increase in power spectral density at high frequencies (small scales) can be attributed to an en-hanced electron Schmidt number. Although the Heisenberg model does not explicitly depend on the Schmidt number, the spectral model of Driscoll and Kennedy (1985) does de-pend on both the Schmidt number and the energy dissipa-tion rate, ε, as described by L¨ubken et al. (1994). In the work described by L¨ubken et al.,1998, an independent mea-surement of ε was available from their (neutral) CONE
in-strument. They used these ε values with the Driscoll and Kennedy model to determine apparent values for the electron Schmidt number. Since we do not have measured ε values within the PMSE/NLC layers for these MaCWAVE flights, we are not able to directly follow the same procedure. As a compromise, we have used the ε values measured by the CONE instrument on the MIDAS rocket (MMMI24) that was flown after this flight (Flight 41.033) (Rapp et al., 2004). By using Fig. 5 of L¨ubken et al., 1994, we can estimate the elec-tron Schmidt numbers to be in the 1.7 to 16 range, depending on altitude. Because the CONE ε measurements were made 23 min after the MaCWAVE rocket flight and the rocket tra-jectories did not pass through the same volume, the results should only be considered to be approximate.
Examination of the wind data produced by a series of falling sphere measurements and the sodium lidar observa-tions has identified the presence of gravity waves and strong wind shears at the time of this 5 July 2002 launch (Williams et al., 2004; Fritts et al., 2004). Finally, Fig. 2d shows the neutral temperature at the time of the launch. The inserted small red line represents an adiabatic slope. Turbulence can be expected when the temperature gradient approaches this adiabatic limit. The calculation of the Brunt-V¨ais¨al¨a buoy-ancy frequency and the Richardson number requires temper-ature and wind measurements be made with high altitude resolution. We have evaluated a “high resolution” falling sphere data set (M. Rapp, personal communication, 2004) for a flight that occurred 92 min after Flight 41.033. Static instabilities, as identified by negative buoyancy frequencies, are seen at 66 and 70–72 km. Dynamic instabilities are sug-gested by Ri values on the order of 0.7 at 90 km. While this is not below the classic instability threshold of 0.25, we must remember that 90 km is at the upper altitude limit of the falling sphere technique. Fritts et al. (2004) provide a more detailed analysis of the observed temperature gradients and wind shears.
Figure 4 provides a data presentation for NASA Flight 41.032, which was launched at 23:56 UT on 1 July 2002, from Andøya Rocket Range. PMSEs were also present during this flight; however, as shown in Fig. 1 of Gold-berg et al. (2004), they were not nearly as strong as for Flight 41.033. At the times of these flights the solar zenith angles were very similar (87.2◦/87.4◦). Also, a comparison of the magnetogram data for the times of the flights (Fig. 5) reveals that the geomagnetic activity was similar on these two evenings. It is therefore not surprising that the elec-tron density values shown in Figs. 2a and 4a are compara-ble at high altitudes. However, for Flight 41.032 the pres-ence of ice particles has drastically changed the appearance of the electron density profile between 77 and 90 km. Al-though there is a small “feature” at 82 km, it is not a “bite-out” in the classic sense. Figure 4a shows that in the broad depletion region the electron density is reduced to about 20% of what might be otherwise expected. The spectrogram Fig. 4b is consistent with an interpretation of scavenging of
the electrons. As Fig. 4b shows, the spectral energy extends to high frequencies (smaller scales) implying a large Schmidt number. (A 2.8-m Bragg wavelength corresponds to frequen-cies that range from 350 Hz at 80 km to 320 Hz at 90 km on Fig. 4b.) Croskey et al. (2001) noted that during the DROPPS program, which was also launched from Andøya, Norway in the summertime, PMSEs were observed over a wider altitude range than the bite-out region. Rapp et al. (2003) observed the same effect on a MIDAS rocket flight that was launched one half hour later. The data in Fig. 4b show an in situ ob-servation of Schmidt number enhancement in electron tion regions even when the magnitude of the electron deple-tion does not reach bite-out magnitudes. Rapp and L¨ubken (2003; 2004) discuss a physical process that predicts large Schmidt numbers during active turbulence. This theory also explains how the plasma structure can be “fossilized” as the particulates grow and sediment downwards. As a result, the large Schmidt numbers can persist for tens of minutes after the turbulence has decayed.
Although Heisenberg fits to the individual spectra of Fig. 4b are possible, the corresponding energy dissipation rates are unrealistically large. Figure 4c shows the few val-ues of energy dissipation which are not affected by the pres-ence of charged particles; the upper two values are consis-tent with the values measured by an open ionization gauge almost two hours later on the MIDAS MMMI12 flight (Rapp et al., 2004). The ionization gauge technique, which directly observes fluctuations in the neutral density, is of course not affected by charged particles, and it observed turbulence over much of this altitude region (Rapp et al., 2004).
We have used these MIDAS measurements of ε to esti-mate the electron Schmidt numbers for this altitude region, finding values in the 1.2 to 11 range. Again, the Schmidt number values should be considered approximate due to the time and spatial difference between the MaCWAVE and MI-DAS flights.
Standard theories for the development of ice particles in the cold summer mesosphere consider their generation at high altitudes, followed by sedimentation to a lower layer, at which point they sublimate due to a larger background temperature. When gravity waves are present, the sublima-tion and growth phases can be repeated over several cycles (Sugiyama, 1994). From the work of Marti and Mauersberg (1993) we find very large water vapor saturation pressures for the temperatures that were observed below 80 km. Since the degree of saturation, S, is much less than one, any sed-imented ice particles will sublimate within a few minutes. The downleg portion of the same rocket flight showed a clas-sic electron bite out centered at 81.7 km but did not have the broad depletion that extended below 80 km. Apparently the upleg portion of this rocket trajectory traversed a region where the gravity wave motion had produced a downwelling of the particles, but they had not sublimated at the time of the rocket passage. We also note that Ulwick et al. (1988) reported for the STATE campaign both an electron bite-out
Fig. 5. Magnetogram records for the launch times of Flights 41.032
(1 July 2002, 23:56 UT) and 41.033 (5 July 2002, 00:47 UT) from Andøya, Norway. 108 109 1010 70 75 80 85 90 95 100 Altitude (km) (a) 0 200 400 (b) 0.1 10 (c) 190 210 230 (d) Flight 41.030 24/01/2003 2050 UT Ne (m ) Frequency (Hz) (mW/kg) Temperature (K)-3 ε
Fig. 6. Same as Fig. 2 except data obtained 24 January 2003,
20:50 UT (Flight 41.030), from Esrange, Sweden. Note the change of the temperature range (panel d).
at 85 km and depletion below 80 km. A similar electron de-pression was observed with a radiowave propagation experi-ment during the DECIMALS-B flight (Friedrich and Torkar, 1993). Williams et al. (2004) and Fritts et al. (2004) have in-dicated that gravity waves were present during both summer-time MaCWAVE launch salvos, but we have not yet found a consistent explanation as to why a thin bite-out region was present for Flight 41.033 but not the upleg portion of Flight 41.032.
We turn next to the results for the winter MaCWAVE flights. Figure 6 presents the results for Flight 41.030, which was launched from Esrange, Sweden, at 20:50 UT on 24 January 2003. Because the solar zenith angles were very large for the wintertime flights (116 to 128◦), we would expect negligible solar UV ionization in the production of ions/electrons. As a result, the electron density dropped off more rapidly with decreasing altitude than it would occur during the summer. The positively biased Langmuir probe collected both electrons and negative ions; the measured
100 101 102 103 40 50 60 70 80 90 100 110 120 130 140 Frequency (Hz)
Relative power spectral density (dB)
Full spectrum Selected spectrum
-5/3
-7
Flight 41.030 24/01/2003 2050 UT Alt. = 86.9 km
Fig. 7. An example from Flight 41.030 of the use of frequency
domain filtering to reduce the effects of payload roll modulation on the Heisenberg spectra fit. Notice that the filtered spectrum is quite different from the unfiltered spectrum at this altitude of 84.6 km.
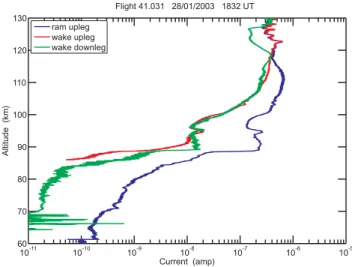
108 109 1010 70 75 80 85 90 95 100 Altitude (km) (a) 0 200 400 (b) 1.0 100 (c) upleg downleg 190 210 230 (d) Ne (m ) Frequency (Hz) (mW/kg) Temperature (K)-3 ε Flight 41.031 28/01/2003 1832 UT
Fig. 8. Same as Fig. 2 except data obtained 28 January 2003,
18:32 UT (Flight 41.031), from Esrange, Sweden.
probe current exhibited a sudden change in scale height at about 77 km. We believe that the current below 77 km was primarily due to the presence of negative ions.
At the time of this flight the background temperature was nearly isothermal above 72 km, as shown in Fig. 6d. Analysis of the available wind data by Wang et al. (2006, this issue) shows the presence of gravity waves, which reached a peak amplitude in the 45–50 km region. However the clamshell nosecone that protected the Langmuir probe did not deploy until ∼54 km, and the spectra obtained for the next 19 km did not have the signature of turbulence.
At higher altitudes the spectral amplitudes were very small and could not be identified as being produced by turbulence. Figure 7 shows an example of a spectrum that is severely
100 101 102 103 40 50 60 70 80 90 100 110 120 130 140 Frequency (Hz)
Relative power spectral density (dB)
Full spectrum Selected spectrum Heisenberg fit Flight 41.031 28/01/2003 1832 UT Alt. = 90.0 km
Fig. 9. An example from Flight 41.031 of the use of frequency
domain filtering to reduce the effects of payload roll modulation. At this altitude of 90.0 km, a good Heisenberg fit can be found.
affected by the payload roll modulation. If a shorter time interval had been used, the resulting frequencies bins would have been more coarsely spaced and even though a Hanning window was used, the “picket fence” of the roll harmon-ics would have merged together. As a result, a “turbulent spectrum” might have been erroneously identified. However, when the data from the “valleys” between the roll harmon-ics, which are on the order of 30 dB smaller, are used, the resulting spectral profile does not match that of turbulence.
As shown in Fig. 6c, low values for the energy dissipa-tion were observed between 73 and 74 km. The Langmuir probe current in this region was primarily due to negative ions. When comparisons of electron ram, electron wake, and positive ion ram spectra were made for Flight 41.033, very similar energy dissipation rates were determined (Croskey et al., 2004). However the “noise floor” for wake or ion mea-surements is effectively higher, which reduces the number of spectra that can be attributed to turbulence.
The situation was quite different at the flight time of the second winter MaCWAVE instrumented rocket (Flight 41.031, 18:32 UT, 28 January 2003). A much larger temperature gradient was present, as shown in Fig. 8d. Also, the wind analysis of Wang et al. (2006) shows that the wave activity was most pronounced at about 60 km and higher, but could not be attributed to mountain wave generation. As Goldberg et al. (2006) point out, a very large semidiurnal tide was identified, which contributed to the instability of the 80–90 km region. As a result, plasma density irregularities developed as shown in Fig. 8b and corresponding significant energy dissipation rates could be calculated. The “signal-to-noise” ratio was large enough that a number of proper spectra were also identified in the wake during the downleg portion of the flight.
100 101 102 103 40 50 60 70 80 90 100 110 120 130 140 Frequency (Hz)
Relative power spectral density (dB)
Full spectrum Selected spectrum Heisenberg fit Flight 41.031 28/01/2003 1832 UT Alt. = 84.9 km
Fig. 10. Another example from Flight 41.031 of the use of
fre-quency domain filtering to reduce the effects of payload roll modu-lation. At this altitude of 84.9 km, the quality of the Heisenberg fit is not as good.
Figure 9 shows an example in which the selected spectrum that was obtained from the “valleys” in the full spectrum can be easily fitted to a theoretical Heisenberg spectrum. The quality of the spectral fit is not as good at other altitudes; Fig. 10 shows an example where a higher noise floor limited the identification of the viscous subrange. Both upleg and downleg measurements of the energy deposition are shown in Fig. 8c. These values are unusually large for wintertime conditions (L¨ubken, 1997).
The auroral conditions were quite different for the two wintertime flights (Fig. 11). These magnetograms indicate that very disturbed geomagnetic conditions were present dur-ing the launch of Flight 41.030 (Fig. 11a), as reflected in the observed electron density profile of Fig. 6a. As will be dis-cussed in following paragraphs, enhanced positive ion den-sities were also observed at this time. In contrast, Fig. 11b shows that very quiet geomagnetic conditions were present at the time of the launch of Flight 41.031. We see in Fig. 8a that the electron density values were very much reduced. A very sharp drop in the electron current was observed at 88.6 km. The width of this “electron ledge” was only about 300 m, which is much smaller than can be expected from a simple Chapman layer profile. Similar electron ledges have been observed at both auroral and equatorial latitudes (Croskey et al., 1990). Chesworth and Hale (1974) attributed the forma-tion of such ledges to rapid changes in the degree of ion hy-dration. Friedrich et al. (1999) followed a similar reasoning, suggesting that such electron ledges correspond to gradients in the density of atomic oxygen. Because atomic oxygen inhibits both the formation of negative ions and of positive clusters, a significantly reduced effective recombination rate results.
Fig. 11. Magnetogram records for the launch times of Flights 41.030 (24 January 2003, 20:50 UT) and 41.031 (28 Jan-uary 2003, 18:32 UT) from Esrange, Sweden.
10-11 10-10 10-9 10-8 10-7 10-6 10-5 60 70 80 90 100 110 120 130 Current (amp) Altitude (km) ram upleg wake upleg wake downleg Flight 41.032 01/07/2002 2356 UT
Fig. 12. Comparison of electron current measurements for Flight 41.032 (1 July 2002, 23:56 UT).
4 Results: Langmuir probe ion current measurements
The discussion so far has focused primarily on the upleg por-tions of each flight, during which the Langmuir probes col-lected electrons. At apogee the bias voltage of the down-ward probe was reversed so that positive ions were collected in ram flow conditions as the payload descended. The con-version of the Langmuir probe currents to absolute charge number densities is a process that requires knowledge of the electron mobility, negative ion mobility, and positive ion mo-bility. Because precise values of these terms are not well known, our approach has been to first use the Faraday rota-tion data to calibrate the electron current measurements. For positive ion measurements at altitudes around 95 km, charge neutrality can be invoked to determine an effective aperture for positive ion collection, which in turn enables calcula-tion of the excess metal ion concentracalcula-tion in the sporadic-E layer (Williams et al., 2006). In the altitude regions where there aren’t many electrons, the calibration procedure is more
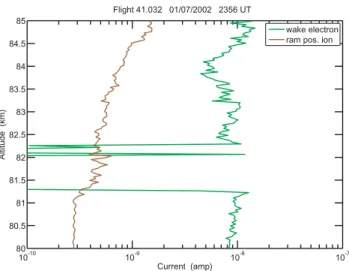
10-10 10-9 10-8 10-7 80 80.5 81 81.5 82 82.5 83 83.5 84 84.5 85 Current (amp) Altitude (km) wake electron ram pos. ion Flight 41.032 01/07/2002 2356 UT
Fig. 13. Comparison of electron and positive ion Langmuir probe
currents during the downleg portion of Flight 41.032 (1 July 2002, 23:56 UT). 10-11 10-10 10-9 10-8 10-7 10-6 10-5 60 70 80 90 100 110 120 130 Current (amp) Altitude (km) ram upleg wake upleg wake downleg Flight 41.033 05/07/2002 0047 UT
Fig. 14. Comparison of electron current measurements for Flight 41.033 (5 July 2002, 00:47 UT).
difficult. Because the rocket velocity was supersonic (partic-ularly, at the lower altitudes), a significant shock front de-veloped in front of the probe. As a result, assumptions of “frozen chemistry” are not valid (Hale et al., 1972). We can expect that the ions are hydrated, but fragmentation or sub-limation is likely to occur within the shock front. In addi-tion the (reduced) mobility of light positive ions is different from that of light negative ions. For these reasons we ex-amine only the measured Langmuir probe ion currents. Our description of these ion currents begins with the summertime MaCWAVE Flight 41.032 (Fig. 12).
As described earlier, during the upleg portion of each flight, electrons were collected under both ram and wake con-ditions. The wake current is very much reduced when com-pared to the ram measurements (Fig. 12), and it generally
displays the same broad depletion, particularly noticeable at 77–90 km, that was pointed out in Fig. 3a. Interestingly, the wake electron current during the downleg portion of the flight was not depleted as strongly, but the current did go to a very small value, suggesting a “bite-out” over a narrow altitude region. At 85 km the horizontal displacement between the upleg and downleg portions of the flight was 38.3 km. The wake currents of Fig. 12 demonstrate a significant differ-ence over this horizontal distance in the efficiency of electron scavenging, possibly due to variation in the ice particle den-sity and/or size. Similar combinations of broad depletion and sharp bite-outs in the electron density have been observed for earlier flights during PMSE and NLC conditions (Croskey et al., 2001). Correlations of these electron bite-out regions with the signatures seen in the blunt probe currents have been presented by Mitchell et al., 2005.
For the downleg portion of the flight, the ram Langmuir probe was biased with a negative voltage to collect posi-tive ions. Because of the horizontal separation and associ-ated variations between the upleg and downleg current mea-surements for this flight, we only compare the downleg pos-itive ion (ram) current to the downleg electron (wake) cur-rent (Fig. 13). As can be seen in the figure, a one-km thick layer of nearly complete depletion of electron density was observed. In this same altitude region, the positive ion cur-rent increased by 24%. Assuming that the positive ion mo-bility has not changed at the same time, we interpret this to mean that the positive ion concentration increased by the same amount. We note that we cannot completely rule out the possibility that a shift in the potential of the skin (return electrode) with respect to the plasma could have produced this effect. The potential of the return electrode would have to shift by about 1.2 volts to produce such a change in the positive ion current. Although such a shift would simultane-ously also reduce the electron current in the other Langmuir probe, it is not large enough to reduce the electron current to essentially zero. We also note that at about 84 km the electron density was reduced by 50%, but the positive ion density did not increase. Blix and Thrane (1993) have reported a similar increase in positive ion current in an NLC/PMSE region.
The other summer MaCWAVE launch was Flight 41.033. Plots of the Langmuir probe currents for electron collection (Fig. 14) do not display electron depletion over a very wide altitude range, as was seen for Flight 41.032. Instead the most severe electron scavenging seems to be confined to a 2-km region centered at 84 km. The AC Langmuir probe current data shown in of Fig. 2b also do not indicate elec-tron scavenging outside of the bite-out region. In Fig. 15 we examine the variation of positive ion current in this narrow layer. Although there is a fair amount of structure within the layer, the positive ion current (concentration) is increased by 24% at the top and 75% at the bottom of the layer. Careful inspection of Fig. 15 also reveals a positive ion bite-out struc-ture between 83.3 km and 83.7 km. The mass spectrometer measurements previously reported by Balsiger et al. (1993)
10-10 10-9 10-8 10-7 82 82.5 83 83.5 84 84.5 85 85.5 86 86.5 87 Current (amp) Altitude (km) wake electron ram pos. ion
Flight 41.033 05/07/2002 0047 UT
Fig. 15. Comparison of electron and positive ion Langmuir probe
currents during the downleg portion of Flight 41.033 (5 July 2002, 00:47 UT).
demonstrated a depletion of positive ions in an NLC region. For Flight 41.033, we have an electron bite-out region be-tween 83 km and 85.4 km, accompanied by positive ion en-hancement at the top and bottom edges of this layer. In ad-dition there is a complete depletion of positive ions in the middle of the electron depletion region. While models of particle charging in the polar summer mesosphere (Rapp and L¨ubken, 2001; L¨ubken and Rapp, 2001) can produce both positive ion enhancement and depletion, we believe that the data from this flight are the first reported case of both ef-fects occurring within the same electron bite-out region. The OASIS (Originally Austrian Study of the IonoSphere) model of Gumbel et al. (2003) suggests that temperature variations of only a few Kelvin can produce major effects in the particle layering.
As could be expected, the mesosphere was much warmer during the winter MaCWAVE flights, and ice particulate lay-ers were not evident. As shown in Fig. 16, for Flight 41.031 the wake currents for the upleg and downleg portions of the flight were very similar at altitudes below 120 km, which in-dicates that the plasma densities were fairly uniform over this horizontal distance. A sporadic-E layer was seen during both the upleg and downleg flight segments but at slightly differ-ent altitudes. There was an appardiffer-ent upward tilt of 0.83 km in the 45.5 km horizontal difference between the traversals of the layer.
As was previously mentioned, at the time of this rocket launch there was evidence of a very large diurnal tide, which produced large-scale wave structure in the observed electron Langmuir probe currents. At the lowest altitudes, these probe currents were primarily due to negative ions. Because nega-tive ions are less mobile than electrons, the ratio of wake-to-ram currents was smaller for the wintertime flights than for
10-11 10-10 10-9 10-8 10-7 10-6 10-5 60 70 80 90 100 110 120 130 Current (amp) Altitude (km) ram upleg wake upleg wake downleg Flight 41.031 28/01/2003 1832 UT
Fig. 16. Comparison of electron current measurements for Flight 41.031 (28 January 2003, 18:32 UT).
10-11 10-10 10-9 10-8 10-7 10-6 10-5 60 70 80 90 100 110 120 130 Current (amp) Altitude (km) ram upleg wake upleg wake downleg Flight 41.030 24/01/2003 2050 UT
Fig. 17. Comparison of electron current measurements for Flight 41.030 (24 January 2003, 20:50 UT).
the summertime flights, which exhibited electron currents to lower altitudes.
As shown by the magnetograms in Fig. 11, the geomag-netic conditions were much more active during the launch of Flight 41.030. As expected, the Langmuir probe currents are much larger for this flight (Fig. 17). We note that the downleg electron current profile is larger than the upleg ram profile. This indicates that the auroral activity had produced “hot spots.” For example, at 90 km during the downleg, the electron density was likely on the order of 30 times larger than the value measured during the upleg portion of the flight. We also note that the transition from negative ion to electron collection occurred at about 77 km on the upleg portion of the flight (blue curve); the height of the same transition was
10-11 10-10 10-9 10-8 10-7 60 65 70 75 80 85 Current (amp) Altitude (km)
negative charge current 41.031 positive charge current 41.031 negative charge current 41.030 positive charge current 41.030
Fig. 18. Comparison of Langmuir ram probe currents for Flights 41.030 (24 January 2003, 20:50 UT) and 41.031 (28 Jan-uary 2003, 18:32 UT), Esrange, Sweden.
reduced to about 65 km on the downleg portion of the flight. Goldberg et al. (1984) have indicated that 400-keV relativis-tic electrons would penetrate to a depth of 65 km. Secondary bremsstrahlung X rays could also be involved in this auroral enhancement, but we do not have a clear way to separate the two effects in this data set.
As shown in Fig. 6b, plasma irregularities extended down to 85 km. We think it is likely that the irregularity en-hancements are the result of the enhanced auroral activity during this flight compared to the quiet conditions during Flight 41.031. The work of Blix et al. (1996) and Blix (1999), suggest that the instability mechanism proposed by Dimant and Sudan (1995) has been observed in the D region. Hori-zontal electric fields larger than about 40 mV/m are needed to excite this instability mechanism, which seems possible for the disturbed auroral conditions during Flight 41.030. How-ever, electric field measurements were not made during this flight, and we are unable to provide a direct confirmation of the Dimant and Sudan theory.
In Fig. 18 we focus on the positive and negative ion cur-rents observed during the wintertime flights. Because we be-lieve that ram current measurements are the more reliable, Fig. 18 shows only those currents. There was little hori-zontal variability during the quiet flight (41.031), so a direct comparison of the negative ion and positive ion currents can be done. The negative ion currents are larger than the posi-tive ion currents by a ratio of about 1.7. However, the pay-load angle of attack was larger during the downleg portion of the flight, so the actual effective current ratio was 1.5. Us-ing values for reduced mobility of µ+=1.8 cm2V−1s−1 and
µ−=2.3 cm2V−1s−1(Cole and Pierce, 1965), we would
ex-pect a current ratio of 1.4. Because we also exex-pect equal positive and negative charge number densities in this altitude region, the observed current ratio is consistent with a
com-plete breakup of ion hydration within the shock front of the probe.
The Langmuir negative charge current for Flight 41.030 (green curve in Fig. 18) shows a dramatic change in scale height at 77 km. We interpret this as an indication of neg-ligible electron effects below this height and that the nega-tive ion concentrations are very similar to those of the quiet flight. However, above 77 km the auroral precipitation has produced an enhancement of the Langmuir probe current due to the increase in electron concentration. As was previously described, there are indications that the payload moved into a “hot spot” during the downleg portion of the flight, as indi-cated by the enhanced wake electron currents (Fig. 17) that extend down to 65 km. (The ray path geometry of the Fara-day rotation experiment precludes its use during the downleg flight segment.) In Fig. 18, the positive ion current measure-ments of Flight 41.030 are shown to be larger by a factor of 2.3 or more compared to the quiet-day flight throughout much of the lower mesosphere. In this disturbed case the “hot spot” that was encountered during the downleg portion of the flight produced both an enhancement of the wake elec-tron current measurement (Fig. 17) and an enhancement in the ram positive ion current values (Fig. 18).
5 Summary and conclusions
The combination of summer and winter flights has provided a number of opportunities for comparison of Langmuir probe electron and ion current measurements under various geo-physical conditions. In the cold summer polar mesosphere, ice particle formation can produce sharp layer bite-outs in the electron density and/or broad regions of electron deple-tion. Both types of electron depletions are accompanied by plasma irregularities with scales smaller than a few meters. Although the occurrence of PMSEs seems to be associated with the regions of largest plasma density irregularities and bite-outs, small-scale irregularities can extend over a wider altitude region, where there is less severe electron depletion. At altitudes outside of the particle region (electron depletion region), plasma density irregularities can be used as a tracer of neutral turbulence. Another observation is that the positive ion density is increased in the electron bite-out regions.
The DC Langmuir probe current measurements illustrated large-scale gravity wave motion for both flights; however, for one flight the AC fluctuations indicated the presence of turbulence in only a limited altitude region. Turbulence was observed over a much larger altitude range for the second winter flight, and fairly large energy dissipation rates were inferred. This is consistent with the observation of a large-amplitude semidiurnal tide, which was deduced from data from falling spheres, radiosondes, and ground-based lidars that were an integral part of the MaCWAVE program.
Acknowledgements. The authors gratefully acknowledge the launch support provided by personnel of the NASA Wallops Flight Facility, the Andøya Rocket Range, Esrange, and the ALOMAR Observatory. T. Wheeler provided critical payload support during the launching of the rockets. This research was supported by NASA grants NAG5-01075, NAS5-02036, and NAG5-5313, by the Ger-man BMBF through DLR grants 50 OE 9802 and 50 OE 9901, and by Austrian Research Funds (FWF) through Grant P15468.
Topical Editor U.-P. Hoppe thanks M. Rapp and C. T. Steigies for their help in evaluating this paper.
References
Balsiger, F., Kopp, E., Friedrich, M., Torkar, K. M., and W¨alchli,
U.: Small-scale structure of O2+ and protron hydrates in a
noc-tilucent cloud and polar mesospheric summer echo of August 9.10 1991 above Kiruna, Geophys. Res. Lett., 20, 2315–2318, 1993.
Bennett, F. D. G., Hall, J. E., and Dickinson, P. H. G.: D-region electron densities and collision frequencies from Faraday rota-tion and differential absorprota-tion, J. Atmos. Terr. Phys., 34, 1321– 1335, 1972.
Blix, T. A.: Small scale plasma and charged aerosol variations and their importance for polar mesosphere summer echoes, Adv. Space Res., 24, 537–546, 1999.
Blix, T. A. and Thrane, E. V.: Noctilucent clouds and regions with polar mesospheric summer echoes studied by means of rocket-borne electron and ion dc-probes, Geophys. Res. Lett., 20, 2303– 2306, 1993.
Blix, T. A., Thrane, E. V., Kirkwood, S., Dimant, Y. S., and Sudan, R. N.: Experimental evidence for unstable waves in the lower E/upper D-region excited near the bisector between the electric field and the drift velocity, Geophys. Res. Lett., 23, 2137–2140, 1996.
Chesworth, E. T. and Hale, L. C.: Ice particulates in the mesosphere, Geophys. Res. Lett., 1, 347–350, 1974.
Cole, R. K. and Pierce, E. T.: Electrification in the earth’s atmo-sphere for altitudes between 1 and 100 kilometers, J. Geophys. Res., 70, 2735–2749, 1965.
Croskey, C. L., Hale, L. C., and Mitchell, J. D.: Electrical stratifica-tion in the middle atmosphere, Adv. Space Res., 10 (10), 49–52, 1990.
Croskey, C. L., Mitchell, J. D., Friedrich, M., Torkar, K. M., Hoppe, U.-P., and Goldberg, R. A.: Electrical structure of PMSE and NLC regions during the DROPPS program, Geophys. Res. Lett., 28, 1427–1430, 2001.
Croskey, C. L., Mitchell, J. D., Goldberg, R. A., Blix, T. A., Rapp, M., Latteck, R., Friedrich, M., and Smiley, B.: Coordinated in-vestigation of plasma and neutral density fluctuations and par-ticles during the MaCWAVE/MIDAS summer 2002 program, Geophys. Res. Lett., 31, L24S08, doi:10.1029/2004GL020169, 2004.
Dimant, Y. S. and Sudan, R. N.: Kinetic theory of the Farely-Buneman instability in the E region of the ionosphere, J. Geo-phys. Res., 100, 14 605–14 623, 1995.
Friedrich, M. and Torkar, K. M.: An attempt to parameterise neg-ative ions in the ionospheric D-region, Proceedings12th ESA Symposium on Rocket and Balloon Programmes & Related Re-search, ESA SP-370, 257–261, 1995.
Friedrich, M., Gumbel, J., and Pilgram, R.: Atomic oxygen in the mesosphere and its relevance for the Ionosphere, ESA SP-437, 287–290, 1999.
Fritts, D. C.: Gravity wave sources, source variability and lower and middle atmosphere effects, in : Coupling Processes in the Lower and Middle Atmosphere, edited by: Thrane, E. V., Blix, T. A., and Fritts, D. C., Kluwer Academic Publishers, 1993.
Fritts, D. C. and Alexander, M. J.: Gravity wave dynamics and ef-fects in the middle atmosphere, Rev. Geophys., 41,1, 1003, doi 10.1029/2001RG000106, 2003.
Fritts, D. C., Williams, B. P., She, C. Y., Vance, J. D., Rapp, M., L¨ubken, F.-J., M¨ullemann, A., Schmidlin, F. J., and Goldberg, R. A.: Observations of extreme temperature and wind gradients near the summer mesopause during the MaCWAVE/MIDAS rocket campaign, Geophys. Res. Lett., 31, L24S06, doi:10.1029/2003GL019389, 2004.
Goldberg, R. A., Jackman, C. H., Barcus, J. R., and Søraas, F.: Nighttime auroral energy deposition in the middle atmosphere, J. Geophys. Res., 89, 5581–5596, 1984.
Goldberg, R. A., Fritts, D. C., Williams, B. P., L¨ubken, F.-J., Rapp, M., Singer, W., Latteck, R., Hoffmann, P., M¨ullemann, A., Baumgarten, G., Schmidlin, F. J., She, C.-Y., and Krueger, D. A.: The MaCWAVE/MIDAS rocket and
ground-based measurements of polar summer dynamics: Overview
and mean state structure, Geophys. Res. Lett., 31, L24S02, doi:10.1029/2004GL019411, 2004.
Goldberg, R. A., Fritts, D. C., Schmidlin, F. J., Williams, B. P., Croskey, C. L., Mitchell, J. D., Friedrich, M., Russell III, J. M., Blum, U., Fricke, K. H.: The MaCWAVE program to study grav-ity wave influences on the polar mesosphere, Ann. Geophys., 24, this issue, 2006.
Gumbel, J., Siskind, D. E., Witt, G., Torkar, K. M., and Friedrich, M.: Influences of ice particles on the ion chemistry of the polar mesosphere, J. Geophys. Res., 108, doi:10.1029/2002JD002413, 2003.
Hale, L. C., Nickel, L. C., Kennedy, B., and Powell, T. A.: Su-personic and subsonic measurements of mesospheric ionization, Radio Science, 7, 89–91, 1972.
Heisenberg, W.: Zur statistischen Theorie der Turbulenz, Z. Physik, 124, 628–657, 1948.
Hor´anyi, M., Gumbel, J., Witt, G., and Robertson, S.: Simulation of rocket-borne particle measurements in the mesosphere, Geophys. Res. Lett., 11, 1537–1540, 1990.
Jacobsen, T. A. and Friedrich, M.: Electron density measurements in the lower D-region, J. Atmos. Terr. Phys., 41, 1195–1200, 1979.
Kelley, M. C., Farley, D. T., and R¨ottger, J.: The effect of clus-ter ions on anomalous VHF backscatclus-ter from the summer polar mesosphere, Geophys. Res. Lett., 14, 1031–1034, 1987. L¨ubken, F.-J: Seasonal variation of turbulent energy dissipation
rates at high latitudes as determined by in situ measurements of neutral density fluctuations, J. Geophys. Res., 102, 13 441– 13 456, 1997.
L¨ubken, F.-J. and Rapp, M.: Modelling of particle charging in the polar summer mesopause: Part 2 – Application to measurements, J. Atmos. Solar Terr. Phys., 63, 771–780, 2001.
L¨ubken, F.-J., Giebeler, J., Blix, T., Thrane, E., Singer, W., and Bremer, J.: In-situ measurement of the Schmidt number within a PMSE layer, Geophys. Res. Lett., 21, 1651–1654, 1994.
L¨ubken, F.-J., Rapp, M., Blix, T., and Thrane, E.: Microphysical and turbulent measurements of the Schmidt number in the vicin-ity of polar mesosphere summer echoes, Geophys. Res. Lett., 25, 893–896, 1998.
Marti, J. and Mauersberger, K.: A survey and new measurements of ice vapor pressure at temperatures between 170 and 250 K, Geophys. Res. Lett., 20, 363–366, 1993.
Mitchell, J. D., Croskey, C. L., and Goldberg, R. A.: Evidence for charged aerosols and associated meter-scale structure in identi-fied PMSE/NLC regions, Geophys. Res. Lett., 28, 1423–1426, 2001.
Mitchell, J. D., Croskey, C. L., Goldberg, R. A., and Friedrich, M.: Charged particle observations in the polar mesosphere during the MaCWAVE and DROPPS programs, ESA SP-590, 161–166, 2005.
Rapp, M. and L¨ubken, F.-J.: Modelling of particle charging in the polar summer mesopause: Part 1 – General results, J. Atmos. Solar Terr. Phys., 63, 759–770, 2001.
Rapp, M., L¨ubken, F.-J., Hoffman, P., Baumgarten, G., and
Blix, T. A.: PMSE dependence on aerosol charge
num-ber density and aerosol size, J. Geophys. Res., 108, 8441, doi:10.1029/2002JD002650, 2003.
Rapp, M. and L¨ubken, F.-J.: On the nature of PMSE: Electron dif-fusion in the vicinity of charged particles revisited, J. Geophys. Res., 108, 8437, doi:10.1029/2002JD002857, 2003.
Rapp, M., Strelnikov, B., M¨ullemann, A., L¨ubken, F.-J., and Fritts, D. C.: Turbulence measurements and implications for gravity wave dissipation during the MaCWAVE/MIDAS rocket program, Geophys. Res. Lett., L24S07, doi:10.1029/2003GL019325, 2004.
Rapp, M. and L¨ubken, F.-J.: Polar mesospheric summer echoes (PMSE): Review of observations and current understanding, At-mos. Chem. Phys., 4, 2601–2633, 2004.
Sugiyama, T.: Ion-recombination nucleation and growth of ice par-ticles in noctilucent clouds, J. Geophys. Res., 99, 3915–3929, 1994.
Thrane, E. V.: DC-probe measurements in the middle atmosphere, in: Rocket Techniques, Handbook for MAP 19, edited by: Gold-berg, R. A., 138–154, 1986.
Ulwick, J. C., Baker, K. D., Kelley, M. C., Balsley, B. B., and Ecklund, W. L.: Comparison of simultaneous MST radar and electron density probe measurements during STATE, J. Geophys. Res., 6989–7000, 1988.
Wang, L., Fritts, D. C., Williams, B. P., Goldberg, R. A., Schmidlin, F. J., and Blum, U.: Gravity waves in the middle atmosphere during the MaCWAVE winter campaign: Evidence of mountain wave critical level encounters, Ann. Geophys., 24, this issue, 2006.
Williams, B. P, Fritts, D. C., Wang, L., She, C. Y., Vance, J. D., Schmidlin, F. J., Goldberg, R. A., M¨ullemann, A., and L¨ubken, F.-J.: Gravity waves in the Arctic mesosphere during the MaCWAVE/MIDAS summer rocket program, Geophys. Res. Lett., 31, L24S06, doi:10.1029/2004GL020049, 2004.
Williams, B. P, Croskey, C. L., She, C. Y., Mitchell, J. D., and Gold-berg, R. A.: Sporadic sodium and E layers observed during the summer 2002 MaCWAVE/MIDAS rocket campaign, Ann. Geo-phys., 24, this issue, 2006.