HAL Id: hal-00317750
https://hal.archives-ouvertes.fr/hal-00317750
Submitted on 29 Nov 2004
HAL is a multi-disciplinary open access
archive for the deposit and dissemination of
sci-entific research documents, whether they are
pub-lished or not. The documents may come from
teaching and research institutions in France or
abroad, or from public or private research centers.
L’archive ouverte pluridisciplinaire HAL, est
destinée au dépôt et à la diffusion de documents
scientifiques de niveau recherche, publiés ou non,
émanant des établissements d’enseignement et de
recherche français ou étrangers, des laboratoires
publics ou privés.
orographic rainband around Kyushu, Japan in the Baiu
season
Y. Umemoto, M. Teshiba, Y. Shibagaki, H. Hashiguchi, M. D. Yamanaka, S.
Fukao
To cite this version:
Y. Umemoto, M. Teshiba, Y. Shibagaki, H. Hashiguchi, M. D. Yamanaka, et al.. Combined wind
profiler-weather radar observations of orographic rainband around Kyushu, Japan in the Baiu season.
Annales Geophysicae, European Geosciences Union, 2004, 22 (11), pp.3971-3982. �hal-00317750�
© European Geosciences Union 2004
Geophysicae
Combined wind profiler-weather radar observations of orographic
rainband around Kyushu, Japan in the Baiu season
Y. Umemoto1, M. Teshiba1, Y. Shibagaki2, H. Hashiguchi1, M. D. Yamanaka3,4, S. Fukao1, and X-BAIU-99 and X-BAIU-02 observational groups5
1Research Institute for Sustainable Humanosphere, Kyoto University, Uji, Kyoto 611–0011, Japan 2Osaka Electro-Communication University, Neyagawa, Osaka 572–8530, Japan
3Graduate School of Science and Technology, Kobe University, Kobe 657–8501, Japan
4Inst. of Observ. Res. for Global Change, Japan Agency for Marine-Earth Science and Techn., Yokohama 236–0001, Japan 5Meteorological Research Institute, Japan Meteorological Agency, Tsukuba, Ibaraki 305–0052, Japan
Received: 6 January 2004 – Revised: 15 June 2004 – Accepted: 2 July 2004 – Published: 29 November 2004 Part of Special Issue “10th International Workshop on Technical and Scientific Aspects of MST Radar (MST10)”
Abstract. A special observation campaign (X-BAIU),
us-ing various instruments (wind profilers, C-band weather radars, X-band Doppler radars, rawinsondes, etc.), was car-ried out in Kyushu (western Japan) during the Baiu season, from 1998 to 2002. In the X-BAIU-99 and -02 observa-tions, a line-shaped orographic rainband extending northeast-ward from the Koshikijima Islands appeared in the low-level strong wind with warm-moist airs. The weather radar obser-vation indicated that the rainband was maintained for 11 h. The maximum length and width of the rainband observed in 1999 was ∼200 km and ∼20 km, respectively. The rainband observed in 2002 was not so developed compared with the case in 1999. The Froude number averaged from sea level to the top of the Koshikijima Islands (∼600 m) was large (>1), and the lifting condensation level was below the tops of the Koshikijima Islands. Thus, it is suggested that the clouds organizing the rainband are formed by the triggering of the mountains on the airflow passing over them. The vertical profile of horizontal wind in/around the rainband was inves-tigated in the wind profiler observations. In the downdraft region 60 km from the Koshikijima Islands, strong wind and its clockwise rotation with increasing height was observed below 3 km altitude. In addition, a strong wind component perpendicular to the rainband was observed when the rain-band was well developed. These wind behaviors were related to the evolution of the rainband.
Key words. Meteorology and atmospheric dynamics (Mesoscale meteorology; convective processes; precipita-tion)
Correspondence to: Y. Umemoto
(umemoto@rish.kyoto-u.ac.jp)
1 Introduction
The summer monsoon rainfalls are identified as Meiyu in China and Baiu in Japan. A rainfall zone called the Baiu frontal zone stretches from the south of China to the Japan Is-lands during the Baiu season (June–July). In western Japan, the Baiu frontal zone is characterized by the existence of a low-level jet stream, weak temperature gradient, strong mois-ture gradient and nearly saturated neutral stratification (e.g. Matsumoto et al., 1970; Akiyama, 1975; Yoshizumi, 1977; Ninomiya, 1984, 1989, 2000, 2001).
Heavy rainfall frequently occurs over a region from the East China Sea to Kyushu, Japan, in the warm-moist airs flowing from the Pacific subtropical anticyclone to the Baiu frontal zone. The most striking feature of rainfalls in Kyushu is the long-lasting orographic rainfall which concentrates in narrow regions. Ogura et al. (1985) analyzed a concentrated heavy rainfall occurring in the Nagasaki Peninsula, in the westernmost part of Kyushu Island. They showed that a rain-band migrated over the East China Sea, stopped its migration when its tip reached the Nagasaki area, and remained there for 5 h. It was suggested that the rainband was trapped oro-graphically. Yoshizaki et al. (2000) examined both a wide and a narrow rainband, which appeared stationary and was maintained for a long time over Kyushu, by using a non-hydrostatic spectrum model of MRI/NPD-NHM developed by the Japan Meteorological Agency (JMA). The generating and maintaining mechanisms of the wide rainband were clar-ified. On the other hand, the narrow rainband was not sim-ulated because the resolutions of the models were not fine enough. To investigate the mechanisms of such rainfall sys-tems, it is necessary first to perform intense observations.
Wind profiler (WP) observations are well suited to exam-ine detailed wind behavior, including the vertical wind com-ponent associated with mesoscale cloud systems (∼100 km
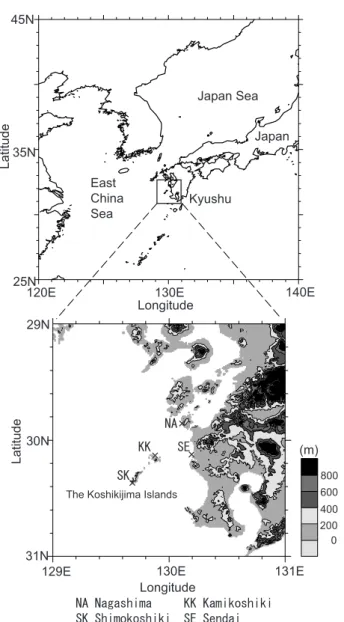
Fig. 1. Topographic map of observation sites.
horizontal extent). Application of the WP technique to the Baiu-frontal atmosphere was initiated by Fukao et al. (1988, 1989), who used a VHF-band profiler (the MU radar). Mesoscale features using the same radar were studied by Watanabe et al. (1994) and Shibagaki et al. (1997, 2000), who observed features in central Japan. Though the char-acteristics of the Baiu front and the associated large-scale cloud system (more than 100 km) were investigated, small scale disturbances (∼100 km) were not.
In this study, L-band (1.3 GHz frequency) and S-band (3 GHz) WPs were operated together with X-band Doppler radars, rawinsondes and other instruments, in a special ob-servation campaign called “X-BAIU” which was conducted over the East China Sea and Kyushu during the Baiu seasons from 1998 to 2002 (Kato et al., 2003). During the special observations, narrow rainbands (referred to as “the Koshiki-jima line”), extending northeastward from the downdraft area of the Koshikijima Islands (see Fig. 1), were observed during
the period on 28–29 June 1999 and 1 July 2002. The main purpose of this paper is to show how combined WP-weather radar observations are an important tool for studies to reveal the mechanism of orographically-affected narrow rainbands such as the Koshikijima line.
A general description of the special observation campaign and the data used in this study follow in Sect. 2. We describe characteristics of the observed narrow rainband and back-ground field in relation to its generation and maintenance process in Sect. 3. In Sect. 4, the generation and develop-ment of the Koshikijima line is discussed, based on the ob-servational results. Section 5 contains the conclusions.
2 Data analysis
The field observations “X-BAIU-99” and “X-BAIU-02” were conducted during the periods 15 June–6 July 1999 and 7 June–8 July 2002, respectively. The observation sites around the Koshikijima line are shown in Fig. 1. The Koshiki-jima Islands are located to the west of Kyushu where the oceanic air flows in directly. It has small low mountains, ranging in the southwest-northeast direction. The mountains are 500–600 m in height, much lower than the central moun-tains of Kyushu. Nagashima (32.1◦N, 130.1◦E), referred to as “NA” in this paper, is located on the leeward side of the Koshikijima line, about 50 km northeast of Kamikoshiki (31.9◦N, 129.9◦E), referred to as “KK”, and its altitude is about 400 m. Sendai (31.9◦N, 130.2◦E), referred to as “SE”, is located about 40 km east of KK. Upper air soundings were made at Shimokoshiki (31.6◦N, 129.9◦E) referred to as SK
and NA during the observation period in 1999 and also made at NA in 2002.
An S-band WP was installed at NA and KK during the observation periods in 1999 and 2002, respectively. L-band WPs were installed at NA and SE during the period in 2002. In 2002, three WPs were installed and wind behaviors at the generating point (KK), downwind side (NA) and surround-ing area (SE) of the Koshikijima line were observed simul-taneously. WPs used in this study are portable phased-array antenna types. WPs can observe clear-air motion which can-not be observed by weather radars. Wind behavior just be-fore and/or after a precipitation event can also be observed. Brief specifications of the S-band WP and L-band WPs are shown in Table 1. Further details of WPs are described in Hashiguchi (2004) and Yamamoto et al. (2002).
The characteristics of precipitating clouds were observed by the operational C-band weather radars operated by JMA, and by two X-band Doppler radars installed at NA and SE in the X-BAIU-99 and X-BAIU-02 observations. Brief spec-ifications of the X-band Doppler radar is shown in Table 2. The X-band Doppler radar at NA did not operate well in the 1999 campaign. The operational radars obtained the hori-zontal distributions of rainbands widely. The dual Doppler radar analysis (cf. Ishihara et al., 1986) is used to calculate horizontal and vertical wind components to study the three-dimensional wind field.
Table 1. Specifications of the S- and L-band WP.
Location KK NA SE
Antenna Phased-array antenna Operating frequency 3050 MHz 1357.5 MHz
(S-band) (L-band) Aperture 0.79 m2 5.9 m2 6.76 m2 Transmitter peak power 500 W 2 kW 600 W Height resolution 50 m
Height range 0.1–5 km 0.1–10 km 0.12–4
Table 2. Specifications of the X-band DR.
Antenna Parabolic antenna Operating frequency 9.41 GHz Diameter of Antenna 2.3 m Transmitter peak power 40 kW Beam width 1.3◦ Pulse repetition frequency 2000 Hz Pulse width 0.45 µs Sampling interval 125 m Velocity-resolution 12.5 m s Sampling range 64 km
Therefore, in this study wind behaviors for several rain-bands can be examined in detail by combining the data of
X-band Doppler radars and WPs.
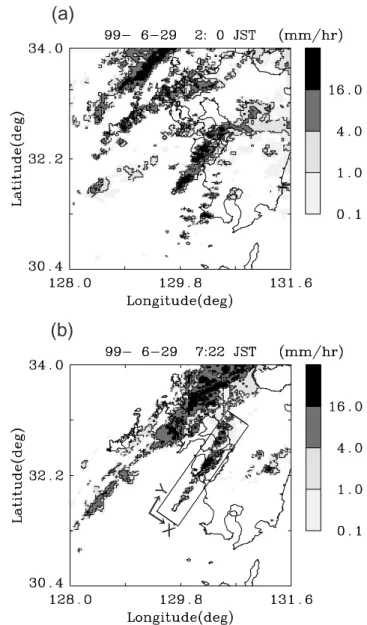
The rainband extending northeastward from the Koshik-ijima Islands was observed from 23:00 JST (JST=UTC+9) on 28 June to 10:00 JST on 29 June 1999, and from 03:00 to 14:00 JST on 1 July 2002 by the JMA operational radars. Figures 2 and 3 show horizontal distributions of precipitation intensity at 2 km altitude at 02:00 JST (Fig. 2a), 07:22 JST (Fig. 2b) on 29 June 1999 and at 12:30 JST on 1 July 2002 (Fig. 3). In this study, we identified three periods, A, B, and C, based on the width and length of the rainband. The period from 23:00 JST on 28 June to 03:00 JST on 29 June 1999, were classified as period A, from 03:00 to 10:00 JST on 29 June 1999 as period B and from 03:00 to 14:00 JST on 1 July 2002 as period C. We define the three cases: for period A, the rainband was most developed; for period B, the rain-band was less strongly developed, for period C, the rainrain-band was developed weakly. In addition to these three periods, pe-riod D, from 14:00 to 16:00 JST on 1 July 2002, after the Koshikijima line had decayed, is shown for comparison.
Fig. 2. Horizontal distributions of precipitation echo intensity at
2 km height observed by JMA operational radars at (a) 02:00 and
(b) 07:22 JST on 29 June 1999 when orographic rainband denoted
as the Koshikijima line was seen.
3 Results
3.1 Characteristics of the Koshikijima line
As shown in Figs. 2 and 3, the Koshikijima line was a narrow rainband of width and length ∼20 km and ∼200 km, respec-tively, and extended to the leeward side of the background wind. The precipitation area corresponding to the Baiu front was also observed on the north of Kyushu.
In 1999, the Koshikijima line was aligned in the north-eastward direction (about 35◦from north), and was observed around 23:00 JST on 29 June. The wide (∼20 km), long (∼200 km) and strong (more than 32 mm/h) precipitation echoes were observed and the Koshikijima line was well de-veloped until 03:00 JST on 29 June (period A).
Fig. 3. Horizontal distributions of precipitation echo intensity at
2 km height observed by JMA operational radars at 12:30 JST on 1 July 2002.
After 03:00 JST, the width of the echoes narrowed (∼10 km), and the rainband merged into the Baiu front go-ing southward around 10:00 JST (period B). The Koshikijima line was not so developed during period B compared with pe-riod A. Though the Baiu front went southward gradually, the Koshikijima line stagnated without changing its position for about 11 h.
In 2002, the Koshikijima line was observed aligned in the northeastward direction (about 40◦from North) from 03:00 to 14:00 JST on 1 July 2002 (period C). The width and length of precipitation intensity were smaller (∼8 and ∼120 km) than those observed in 1999, it was not so developed com-pared to the rainband observed in periods A and B. A rain-band corresponding to the Baiu front was also observed in the north of Kyushu for this case. Though the rainband gradu-ally went southward, the Koshikijima line stagnated without changing its position, as in 1999.
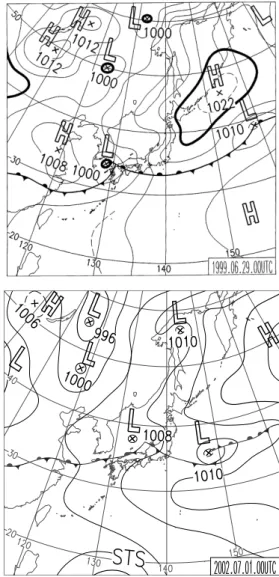
The surface weather charts at 09:00 JST on 29 June 1999 and 1 July 2002 are shown in Fig. 4. In each case, the Baiu front extending east-westward was seen. Along 130◦E, it was located to the north of Kyushu. The southern part of Kyushu was located in the warm sector of a low.
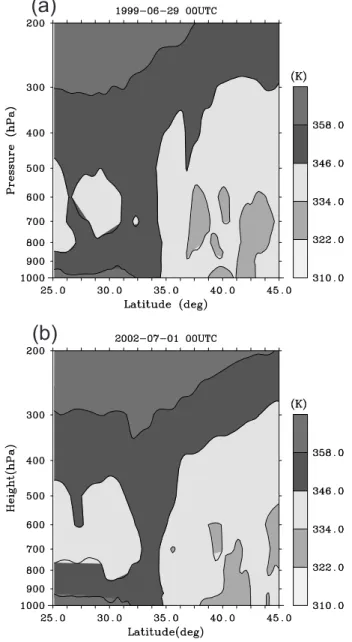
Figure 5 shows the north-south vertical cross sections of equivalent potential temperature θe along 130◦E using
Re-gional objective ANALysis (RANAL) data produced by JMA at 09:00 JST on a) 29 June 1999 and b) 1 July 2002. In each case, the atmosphere was convectively unstable in the south of the Baiu frontal zone (from 32◦–35◦N), and stable in the north of the Baiu frontal zone. High θe was restricted
be-low the 850 hPa level and south of 32◦N. Since the areas of high humidity were also restricted to the same region, the potential temperature depended on the amount of water va-por. The Koshikijima Islands are located around 30◦N, and an convectively unstable and moist atmosphere existed in the
Fig. 4. Surface weather charts at 09:00 JST on 29 June 1999 and on
1 July 2002.
area at lower altitude below 850 hPa level. These synoptic overviews around Kyushu did not change much when the Koshikijima line was observed.
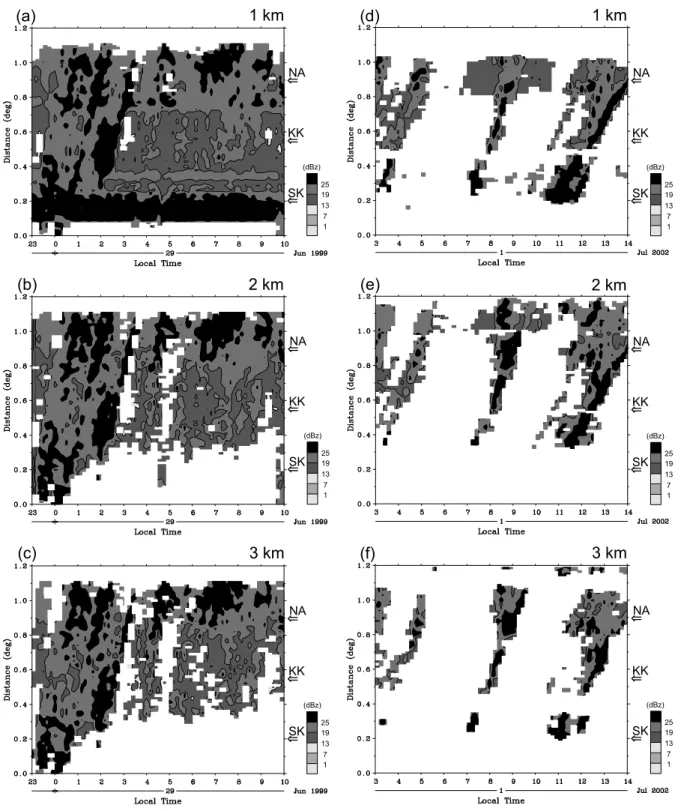
Figure 6 indicates time series of the maximum rainfall in-tensity observed by X-band Doppler radar at SE along the X-axis of the rectangle shown in Fig. 2b) of which X- and Y-axes corresponded to the direction from northwest to south-east and from southwest to northsouth-east, respectively, at 1, 2 and 3 km altitudes. The precipitation echoes generated in the southwest of SK and moving in the direction of NA, one after another, were observed in periods A and B. The echo intensity in period A was stronger than that in period B. In period C the precipitation echoes were generated over the Koshikijima Islands and moved northeastward. Different from the case in periods A and B, precipitating cells were not generated continuously. Horizontal velocity of the radar echo calculated from inclination was 20.0 m/s and changed little in periods A and B. The speed in the case of period C was 12.0 m/s from 07:00 until 08:00 JST, and 8.9 m/s after
Table 3. Atmospheric parameters for each observation location.
Location Date LCL(m) CAPE F r q(g/Kg) RH(%) Before A SK 28 June 1999/22:30 889 1031.3 1.8 16.6 95 A NA 28 June 1999/23:30 1008 377.3 2.6 15.2 83 A NA 29 June 1999/2:30 342 1596.2 2.1 16.6 95 B SK 29 June 1999/4:30 374 1910.2 2.5 17.3 95 B SK 29 June 1999/7:30 642 2057.2 1.3 18.4 97 Before C NA 30 June 2002/20:30 136 346.8 0.5 13.2 71 C NA 1 July 2002/2:30 237 1635.6 1.3 15.8 88 C NA 1 July 2002/8:30 314 1835.6 1.4 15.9 89 C NA 1 July 2002/2:30 171 2531.7 1.1 14.9 81
Fig. 5. North-south vertical cross sections of equivalent potential
temperature along 130◦E.
10:00 JST. In each case, the speed was almost constant and the position of echoes did not differ with altitude.
3.2 Background field generating the Koshikijima line
Parameters calculated using rawinsondes launched at SK and NA are shown in Table 3. We calculated the Froude num-ber (F r) as Fr=U/N h, where U is horizontal wind speed averaged below 600 m altitude, h is the height of the moun-tains of the Koshikijima Islands (600 m), and N is the Brunt-V¨ais¨al¨a frequency. Specific humidity (q) and relative humid-ity (RH) are values at 950 hPa level. While the Koshikijima line was observed (through periods A, B and C), Lifting Con-densation Level (LCL) was below 400 m, which is below the tops of the mountains in the Koshikijima Islands except for the data at 07:30 JST on 29 June 1999 and CAPE (Convec-tive Available Potential Energy) was large enough to develop precipitating clouds. In particular, F r was more than 2 in period A. Throughout periods A, B and C very moist air in which q was more than 15 g/kg existed below 600 m altitude and the layer below 3 km altitude was convectively unstable around the Koshikijima line. Figure 7 is the same as Fig. 6 but observed by JMA operational radars. In period A strong and stationary rainfall was observed and precipitating clouds were generated in the region between 0.0◦and 0.4◦, which corresponds to the southwest of the Koshikijima Islands, and moved northeastward, one after another. On the other hand, precipitating clouds were generated over the Koshikijima Is-lands and precipitating intensity was comparatively weak in periods B and C. We consider that the rainband was gener-ated through condensation and developed more rapidly in pe-riod A compared to that of the other pepe-riods. The stationary rainband which also developed around NA and moved north-eastward was observed in periods A and B, while the rain-band observed in period C was not maintained for a long time and was weakened around the northeast of NA. The length of the rainbands observed in 1999 and 2002 was about 200 km and 120 km, respectively. We consider that the difference in the length of rainbands depends on whether the rainband is able to develop around NA or not.
Fig. 6. Time series of the maximum rainfall intensity of an X-axis in a rectangle, as shown in Fig. 2, observed by X-band radar at SE on
28–29 June 1999 ((a)–(c)) and 1 July 2002 ((d)–(f)). A vertical axis corresponds to Y-axis in Fig. 2. Positions of NA, KK, and SK are indicated by arrows. See corrected section in paper.
3.3 Wind behavior along the Koshikijima line
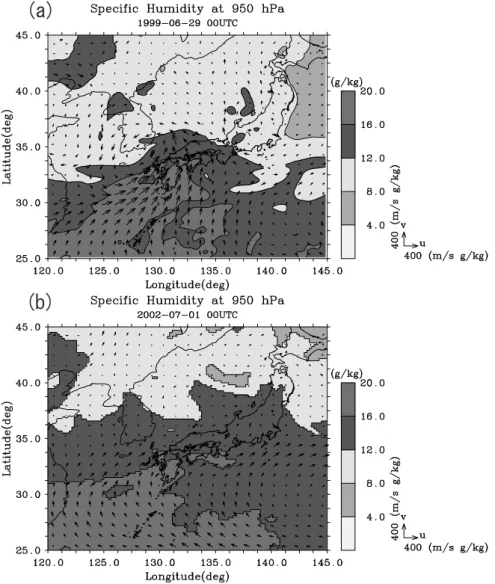
Figure 8 shows horizontal distribution of specific humidity and horizontal flux of water vapor at 950 hPa level calcu-lated from RANAL at 09:00 JST on a) 29 June 1999 and b) 1 July 2002. Though there was little difference in the
quantity of specific humidity southwest of Kyushu, horizon-tal flux of vapor was much stronger in 1999 compared with 2002. That difference was brought about by the wind veloc-ity difference. These synoptic overviews around Kyushu did not change much when the Koshikijima line was observed.
Fig. 7. The same as Fig. 6 but observed by JMA operational radars at 2 km altitude on (a) 29 June 1999 and (b) 1 July 2002.
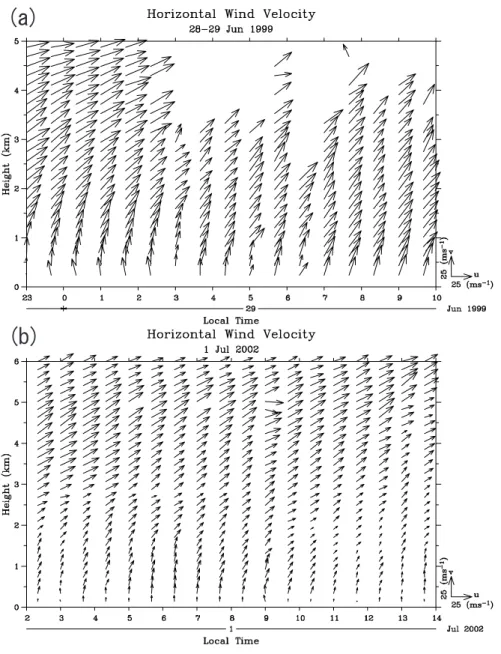
Fig. 9. Time-height cross sections of horizontal wind observed by WP at (a) NA on 28–29 June 1999 and (b) NA on 1 July 2002.
Figure 9 shows horizontal wind observed by WPs installed around the Koshikijima line. From 23:00 JST on 28 June to 10:00 JST on 29 June (Fig. 9a), while the Koshikijima line was observed, the horizontal wind was very strong (more than 25 m/s) and southwesterly wind was dominant from the surface up to 5 km altitude. The horizontal speed of precip-itating clouds described in the previous subsection and wind averaged from the surface to 3 km altitude was in agreement. The wind direction changed clockwise below 3 km altitude. Yoshizaki et al. (2000) also found a similar clockwise rota-tion of wind direcrota-tion with height for the Nagasaki line, on 26 June 1998. On the other hand, wind direction was almost constant from 3 to 5 km.
In 2002, while the Koshikijima line was observed, the southwesterly wind was dominant and the wind speed in-creased with height, and the upward clockwise rotation of
the wind direction was also observed at NA (Fig. 9b). The horizontal speed of precipitating clouds were almost consis-tent with wind averaged from the surface up to 3 km. The wind speed was smaller than that observed in 1999, while its direction was almost consistent with that in 1999 below 3 km altitude. Wind behavior observed by WP at KK was almost similar to that of NA. Compared with the data observed at KK and NA, both wind speed and upward clockwise rotation of horizontal wind were weak at SE.
Figure 10 shows hodographs of horizontal wind observed by WP at NA and SE. Through periods A, B and C a wind component parallel to the rainband was observed below 3 km altitude.
The component became weak when the Koshikijima line decayed, as in period D. That component of wind was espe-cially strong in period A compared with B and C. Comparing
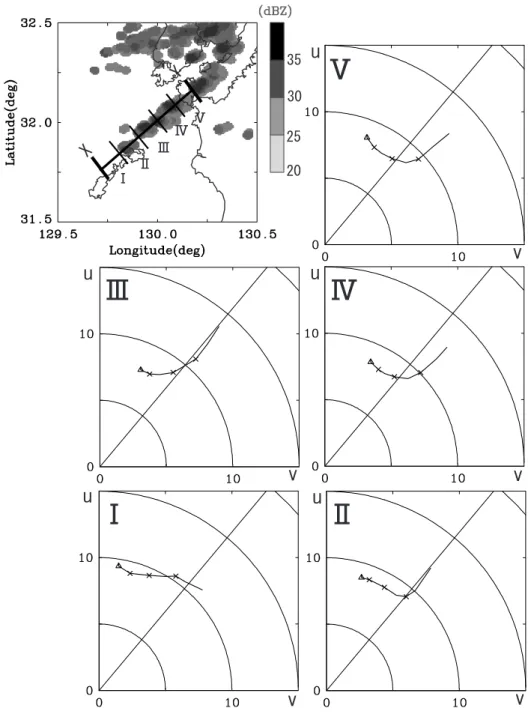
B and C, though the component did not differ much, abso-lute value of the wind velocity did show a marked difference. Therefore, we consider that the perpendicular component of horizontal wind and wind velocity were associated with the development of the rainband. Although it was comparatively weak, the perpendicular component was also observed at SE, as well as inside the rainband. Therefore, we think that this wind behavior existed not as a result of the rainband gener-ation but as the background field itself. We investigated the wind inside the rainband using the X-band Doppler radars. The rainband area was divided into five regions (1–5) on the X–Y line shown in Fig. 11. A mean wind is calculated for each region. Fig. 11 (1–5) show hodographs of horizontal wind calculated for each region. A strong component per-pendicular to the rainband was observed below 3 km altitude at each region similar to wind observed by WPs at NA and KK. The component was especially strong at region 1, over the Koshikijima Islands, and it became weaker at region 3, northeast of the Koshikijima Islands.
4 Discussion
4.1 Generating mechanisms of the Koshikijima line The structure of the narrow rainband was generated and maintained for a long time by the following process. Con-vective cells were generated continuously because of the oro-graphic features of the Koshikijima Islands. The cells were advected to leeward by the lower wind (∼3 km altitude), one after another, and then formed the rainband.
While the Koshikijima line was observed, LCLs were lower than the tops of the mountains in the Koshikijima Is-lands and there was convectively unstable and very moist air in the lower layer of the atmosphere (below 850 hPa level). In addition, the value of the CAPE index was large enough to generate precipitating clouds. Therefore, if there was airflow ascending to the peaks of the Koshikijima Islands, a nec-essary condition for the generation of clouds was satisfied, namely the upslope triggering for the convection, one of the seven mechanisms of orographic precipitation classified by Houze (1993). It is plausible that these clouds were gener-ated mainly as a result of upslope condensation by the oro-graphic effect because Fr was much larger than 1. Following Smolarkiewicz and Rotunno (1989, 1990), the airflow with large F r (>1) among the present cases should rise over the mountains. If the rainband was generated as a result of con-vergence at the leeward side of the Koshikijima Islands, F r should be less than 1. When F r is small, the Brunt-V¨ais¨al¨a frequency becomes large and/or horizontal wind is weak. The larger the Brunt-V¨ais¨al¨a frequency becomes, the more stable the atmosphere becomes, and the flux of water vapor become small when the horizontal wind is weak. Therefore, if F r is small, the rainband is not so developed.
While the Koshikijima line was observed, through peri-ods A, B and C, the direction of the wind changed clock-wise and a strong wind component perpendicular to the
rain-Fig. 10. Hodographs of horizontal wind at NA in periods A, B, C and D (when the Koshikijima line was not observed) and at SE in the period C. The lines L1 and L2 indicate the direction parallel to the rainband in 1999 and 2002, respectively. Triangles (4) in-dicate surface, and crosses (×) are put on the curve at 1 km height intervals.
band was observed below 3 km altitude. On the other hand, the component weakened after the Koshikijima line decayed, in period D. Barnes and Sieckman (1984), Alexander and Young (1992) and LeMone et al. (1998) examined the role of background wind shear in determining the structure of rain-bands over tropical oceans. They concluded that nearly all rainbands occurring in winds with appreciable shear below a low-level wind maximum are oriented nearly normal to the direction of low-level shear (fast-moving squall line), while rainbands where the low-level shear is weak are oriented along the direction of the middle-level shear (slow-moving rainband). The Koshikijima line had strong low-level shear below 3 km altitude, but it was a stationary band. Thus, the classification rules are not applied to the Koshikijima line. We consider that the horizontal wind component parallel to the rainband blew convective cells, and the perpendicular component played the role of supply water vapor to the rain-band. Therefore, the Koshikijima line decayed when the per-pendicular component was weak because the supplying of water vapor became weak.
4.2 Development mechanisms of the Koshikijima line From comparison of the analysis for periods A, B and C the following factors contributed to the development of the Koshikijima line. High flux of water vapor in a lower layer: In periods A and B, high flux of water vapor in a lower layer was observed, though the amount of humidity did not differ much compared with that in period C. In order to generate and develop the rainband, it is necessary not only to have
Fig. 11. Doppler radar at 12:20 JST on 1 July 2002 and hodographs of horizontal wind averaged from 11:00 to 13:00 JST on 1 July at regions
1,2,3,4,5. Triangles (4) indicate surface, and crosses (×) are put on the curve at 1 km height intervals.
highly humid air but also strong wind to convey water vapor to the rainband in the lower layer. The difference of wind speed was also observed by WPs from comparison between periods B and C.
A horizontal wind component perpendicular to the Koshikijima line: When the Koshikijima line was well devel-oped, a strong wind component perpendicular to the rainband was observed. When a wind component perpendicular to the rainband is large, water vapor can be supplied easily and able to develop the rainband well. This wind behavior was also observed inside the rainband and already existed when the Koshikijima line was being generated, though wind can also be strengthened as a result of the generation of the rainband.
Atmosphere with low LCL and large F r: Since the moun-tains existing around NA, the downdraft side of the Koshiki-jima line, are lower than that of the KoshikiKoshiki-jima Islands, the conditions forming and developing precipitating clouds be-come more severe. When F r is much larger than 1 and LCL is below 400 m (the top of NA), the rainband can be devel-oped by upslope condensation not only around the Koshik-ijima Islands but also around NA. When these conditions are realized, precipitating clouds are formed or developed around NA. Then they are blown northeastward and lengthen the rainband.
5 Conclusions
On 28–29 June 1999 and 1 July 2002 during the observation period of the X-BAIU-99 and -02, orographic rainbands, the Koshikijima line, extending northeastward from the Koshik-ijima Islands were observed. We have demonstrated the fol-lowing features of the narrow rainbands.
1. Horizontal distribution of precipitation observed by the
C- and X-band radar: The Koshikijima line observed in 1999 was maintained for 11 h. It was well devel-oped especially until 03:00 JST and was about 200 km in length and 20 km in width for 4 h from the begin-ning. The Koshikijima line observed in 2002 repeated development and decay for 11 h, and the maximum size of the precipitating area was about 120 km in length and 10 km in width. Convective cells were generated around the Koshikijima Islands and advected to leeward by the lower wind, one after another, and then formed the rain-band.
2. Features of lower atmosphere observed by rawinson-des: Convectively unstable stratification was found be-low 3 km height. The Froude number, averaged in a layer from the sea surface to the top of the Koshiki-jima Islands (∼600 m), was large (>1), and the LCL was below the tops of the mountains in the Koshikijima Islands. CAPE was large enough to develop precipitat-ing clouds and there was much water vapor in the lower layer. It is reasonable that upslope airflow in this layer can trigger convections forming the Koshikijima line. 3. Flux of water vapor and specific humidity analysis using
RANAL: Comparing the cases in 1999 and 2002, there was a significant difference in the flux of water vapor and this difference depended on wind speed, since there was not a large difference in specific humidity at the 950 hPa level.
4. Vertical-temporal variations of wind observed by WPs and Doppler radars: While the Koshikijima line ap-pears, the component of the horizontal wind perpendic-ular to the Koshikijima Islands (or the rainband) is large in the height range 1–3 km. This feature was observed almost everywhere inside the rainband. The wind direc-tion in the height range became parallel to the Koshik-ijima Islands after the KoshikKoshik-ijima line decayed. We consider that the horizontal wind component parallel to the rainband blew convective cells, and the perpendicu-lar component played the role of supplying water vapor to the rainband.
We have established a network observation method for orography-affected rainband system formation like the Koshikijima line, using wind profilers and weather radars. Similar methods may be applicable to other regions, and we are now planning on also using a VHF-band wind profiler (the MU radar) in the central part of Japan in the Baiu season
in 2004. There are still many problems for the generating and developing mechanisms of the rainband system with the objective of scientific interests and social necessities like dis-aster prevention.
Acknowledgements. The authors thank M. Yoshizaki and T. Kato
of the Meteorological Research Institute, the Japan Meteorological Agency and X-BAIU observation members for providing the data, useful discussions and for their encouragement. The X-BAIU spe-cial observation was conducted mainly through funding from the Japan Science and Technology Corporation-Core Research for Evo-lutional Science and Technology. The first author (Y. Umemoto) is supported by a grant (16004021) of the Japan Society for the Pro-motion of Science (JSPS) under the Fellowships for Japanese Junior Scientists. The present study was financially supported by Scientific Grants-in Aids (16004021) of the Ministry of Education, Culture, Sports, Science and Technology of Japan. A part of this research was financially supported by Grant-in Aid for University Coopera-tive Research Promotion of Osaka Electro-Communication Univer-sity in 2002. S- and L-band WPs installed at Kamikoshiki and Na-gashima were collaboratively developed by Sumitomo Electric In-dustries, Ltd. and Research Institute for Sustainable Humanosphere (RISH) (former Radio Science Center for Space and Atmosphere (RASC)) of Kyoto University, Japan.
Topical Editor O. Boucher thanks a referee for his help in eval-uating this paper.
References
Akiyama, T.: Southerly transversal moisture flux into the extremely intense rainfall zone in the Baiu season, J. Meteor. Soc. Japan, 53, 304–316, 1975.
Alexander, G. D. and Young, G. S.: The relationship between EMEX mesoscale precipitation feature properties and their en-vironmental characteristics, Mon. Weath. Rev., 120, 554–564, 1992.
Barnes, G. M. and Sieckman, K.: The environment of fast- and slow-moving tropical mesoscale convective cloud lines, Mon. Weath. Rev., 112, 1782–1794, 1984.
Fukao, S., Yamanaka, M. D., Sato, T., Tsuda, T., and Kato, S.: Three-dimensional air motions over the Baiu front observed by a VHF-band Doppler radar: A case study, Mon. Weath. Rev., 116, 281–292, 1988.
Fukao, S., Yamanaka, M. D., Matsumoto, H., Sato, T., Tsuda, T., and Kato, S.: Wind fluctuations near a cold vortex-tropopause funnel system observed by the MU radar, Pure Appl. Geophys., 130, 463–479, 1989.
Hashiguchi, H.: The development and observation by the Radio Sci-ence Center for Space and Atmosphere, Kyoto university: The note of meteorological study, edit by T. Kobayashi, Meteorolog-ical Society Japan, in Japanese, 205, 109–118, 2004.
Houze, R. A. Jr.: Cloud Dynamics, Academic Press, 570, 1993. Ishihara, M., Yanagisawa, Z., and Sakakibara, H.: Structure of a
typhoon rainband observed by two Doppler radars, J. Meteor. Soc. Japan, 64, 923–939, 1986.
Kato, T., Yoshizaki, M., Bessho, K., Inoue, T., Sato, Y., and X-BAIU-01 observation group: Reason for the failure of the simu-lation of heavy rainfall during X-BAIU-01–Importance of a ver-tical profile of water vapor for numerical simulations-, J. Meteor. Soc. Japan, 81, 993–1013, 2003.
LeMone, M. A., Zipser, E. J., and Trier, S. B.: The role of environ-mental shear and thermodynamic conditions in determining the structure and evolution of mesoscale convective systems during TOGA COARE, J. Atmos. Sci., 55, 3493–3518, 1998.
Matsumoto, S., Yoshizumi, S., and Takeuchi, M.: On the structure of the Baiu front and associated intermediate-scale disturbance in the lower atmosphere, J. Meteor. Soc. Japan, 48, 479–491, 1970. Ninomiya, K.: Characteristics of the Baiu front as a predominate subtropical front in the summer Northern Hemisphere, J. Meteor. Soc. Japan, 62, 880–894, 1984.
Ninomiya, K.: Cloud distribution over East Asia during Baiu period in 1979, J. Meteor. Soc. Japan, 67, 639–658, 1989.
Ninomiya, K.: Large- and Meso-α-scale characteristics of Meiyu-Baiu front associated with intense rainfalls in 1–10 July 1991, J. Meteor. Soc. Japan, 78, 141–157, 2000.
Ninomiya, K.: Large γ -shaped cloud zone formed around 6 July 1991 with pole-ward moisture transport from intense rainfall area in Meiyu-Baiu front, J. Meteor. Soc. Japan, 79, 805–813, 2001. Ogura, Y., Asai, T., and Dhohi, K.: A case study of a heavy
precip-itation event along the Baiu front in northern Kyushu, J. Meteor. Soc. Japan, 63, 883–900, 1985.
Shibagaki, Y., Yamanaka, M. D., Hashiguchi, H., Watanabe, A., Uyeda, H., Maekawa, Y., and Fukao, S.: Hierarchical structures of vertical velocity variations near the Baiu front observed by the MU radar, J. Meteor. Soc. Japan, 75, 569–596, 1997.
Shibagaki, Y., Yamanaka, M. D., Shimizu, S., Uyeda, H., Watan-abe, A., Maekawa, Y., and Fukao, S.: Meso-β to γ -scale wind circulations associated with precipitating cloud near Baiu front observed by the MU and meteorological radars, J. Meteor. Soc. Japan, 78, 69–91, 2000.
Smolarkiewicz, P. K. and Rotunno, R.: Low Froude number flow past three-dimensional obstacles. Part I: Baloclinically generated lee vortices. J. Atmos. Sci., 46, 1154–1164, 1989.
Smolarkiewicz, P. K. and Rotunno, R.: Low Froude number flow past three-dimensional obstacles. Part II: Upwind flow reversal zone, J. Atmos. Sci., 47, 1498–1511, 1990.
Watanabe, A., Fukao, S., Yamanaka, M. D., Sumi, A., and Uyeda, H.: A rotor circulation near the Baiu front observed by the MU radar, J. Meteor. Soc. Japan, 72, 91–105, 1994.
Yamamoto, M., Hashiguchi, H., Fukao, S., Shibano, Y., and Imai, K.: Development of a transportable 3-GHz wind profiler for wind and precipitation studies, J. Meteor. Soc. Japan, 80, 273–283, 2002.
Yoshizaki, M., Kato, T., Tanaka, Y., Takayama, H., Shoji, Y., Seko, H., Arao, K., Manabe, K., and Members of X-BAIU-98 obser-vation: Analytical and numerical study of the 26 June 1998 oro-graphic rainband observed in western Kyushu, Japan, J. Meteor. Soc. Japan, 78, 835–856, 2000.
Yoshizumi, S.: On the structure of intermediate-scale disturbances on the Baiu front, J. Meteor. Soc. Japan, 55, 107–120, 1977.