HAL Id: hal-02502687
https://hal.archives-ouvertes.fr/hal-02502687
Submitted on 9 Mar 2020
HAL is a multi-disciplinary open access
archive for the deposit and dissemination of
sci-entific research documents, whether they are
pub-lished or not. The documents may come from
teaching and research institutions in France or
abroad, or from public or private research centers.
L’archive ouverte pluridisciplinaire HAL, est
destinée au dépôt et à la diffusion de documents
scientifiques de niveau recherche, publiés ou non,
émanant des établissements d’enseignement et de
recherche français ou étrangers, des laboratoires
publics ou privés.
Discrete modeling of rock fracturing for various modes
and mechanical properties
Jérôme Duriez, F. Donze, L. Scholtes
To cite this version:
Jérôme Duriez, F. Donze, L. Scholtes. Discrete modeling of rock fracturing for various modes and
mechanical properties. 13th ISRM International Congress of Rock Mechanics, May 2015, Montréal,
Canada. �hal-02502687�
DISCRETE MODELING OF ROCK FRACTURING FOR VARIOUS MODES AND MECHANICAL PROPERTIES
J. Duriez*, F.V. Donzé
Univ. Grenoble Alpes, 3SR, F-38000 Grenoble, France CNRS, 3SR, F-38000 Grenoble, France
Domaine Universitaire, BP 53, 38041 Grenoble Cedex 9, France
(*Corresponding author: [email protected])
L. Scholtès
Université de Lorraine / CNRS / CREGU, GeoRessources,
F-54500 Vandoeuvre-lès-Nancy, France
ABSTRACT
Fracture propagation process in brittle rock is investigated by means of numerical simulations performed with an adapted formulation of the discrete element method. The progressive failure mechanism is simulated through the breaking of the bonds making up the cohesion between the elements constituting the simulated medium. The use of appropriate contact laws associated to a near neighbor interaction feature provide the model the ability to reproduce fundamental characteristics of brittle rock behavior such as, for example, high values of the tensile to compressive strength ratio. Great attention is given to accurately describe the properties of the pre-existing joints or faults in the model. A specific joint model gives the possibility to define a tailor-made behavior of the discontinuity surfaces without suffering from discretization bias.
Compression test simulations are performed on pre-flawed samples and compared to experimental results in order to validate the numerical approach for describing the initiation and propagation of fractures in brittle rock under mode I+II loading. It is shown that the crack mechanical parameters can greatly influence the fracturing pattern, in particular its frictional properties. Overall, the numerical simulations reproduce fairly well the failure patterns that are obtained experimentally.
The discrete model is then used to study mode I+III loading to give an insight into fracturing problems occurring at the scale of the continental crust. The ability of the model to support mechanically the physical modelings performed with wet clay or sandbox is shown. As an example, the model is used to track the development of a twist crack system (wrench fault) through the nucleation and coalescence of microcracks.
KEYWORDS
Discrete Element Method, Mode I+II, Mode I+III, Crack propagation, Closed flaws, Fractures
INTRODUCTION
Mechanical analysis of superficial rock masses considers slightly confined conditions. Under such conditions, rock behaves as a brittle solid. Failure occurs after limited plastic deformation, and results
from catastrophic crack propagation. Cracks appear and propagate from stress concentrators of various kinds: pre-existing fractures, flaws or heterogeneities due to difference in grain mineralogy (inclusions). Thus, it might be necessary to include explicitly such features in mechanical models of rock to precisely describe failure.
In case of complex mixed mode loading, fracture propagation in brittle solids like rocks has been intensively studied using several approaches, either experimentally (Nemat-Nasser & Horii, 1982; Shen & Stephansson, 1995; Park & Bobet, 2009), analytically (Leblond & Frelat, 2014) or numerically (Shen & Stephansson, 1993; Tang, 1997, Bobet & Einstein, 1998). Among the available numerical approaches, DEM has proven to be an efficient numerical tool to describe damage in intact rock (Donzé, Bouchez & Magnier, 1997; Hazzard, Young & Maxwell, 2000; Potyondy & Cundall, 2004; Cho, Martin & Sego, 2007; Huang, Lecampion & Detournay, 2013).
The main objective of this paper is to discuss how DEM might represent pre-existing cracks of different kind, to study fracture propagation correctly. First, the mixed mode I+II loading is considered. The influence of the properties of the pre-existing crack (open or closed nature, frictional properties) is analyzed. Then, the model is used to investigate the mixed mode I+III loading. The relevancy of the DEM model as a complementary tool to physical modeling, or analytical approaches to study mixed loading modes is finally discussed.
NUMERICAL METHOD DEM modeling of rock matrix
The present rock DEM model considers a set of discrete spherical elements interacting through cohesive-frictional brittle bonds. Several similar models have been previously proposed and they have demonstrated the ability of such methods to simulate intact rock (Donzé et al., 1997; Hazzard et al., 2000; Potyondy & Cundall, 2004; Cho et al., 2007; Huang et al., 2013). The present model includes the possibility for near neighbor interaction. Scholtès and Donzé (2013) showed the advantage of such feature to obtain realistic brittleness ratios for various rocks, using spherical discrete elements. Indeed, classical DEM models that consider interactions between spheres in strict geometrical contact enable to simulate brittleness ratios of about 3 or 4, whereas a majority or rocks present ratios over 5 or 10. Here, cohesive-frictional bonds are created between each element pair (A,B) for which equation (1) is verified:
DAB0 ≤ γ (RA + RB) (1)
where DAB0 is the initial distance between the two sphere centers, and RA and RB are the two radii. γ is a
parameter (≥ 1) that allows controlling the mean number of contact per particle, and thus the brittleness ratio (Scholtès & Donzé, 2013). The cohesive-frictional bonds behave according to an elastic fragile relationship. For the elastic domain, constant shear and normal stiffnesses are computed from the radii of the spheres and model parameters. Linear elasticity holds until shear or tensile failure occur (Figure 1). The failure criterions in both normal and shear directions depend on three parameters, a friction angle φ and two stress-like values from which Fsmax and Fnmax are derived.
Figure 1 – Interaction failure criterions of the DEM model
After brittle rupture, frictional interaction occurs between strictly contacting discrete elements. Such interaction presents no tensile strength, and a purely frictional shear resistance that depends on the friction angle φ. In the end, the DEM model of rock matrix includes six parameters, see (Scholtès & Donzé, 2013) for details.
DEM modeling of pre-existing rock discontinuities
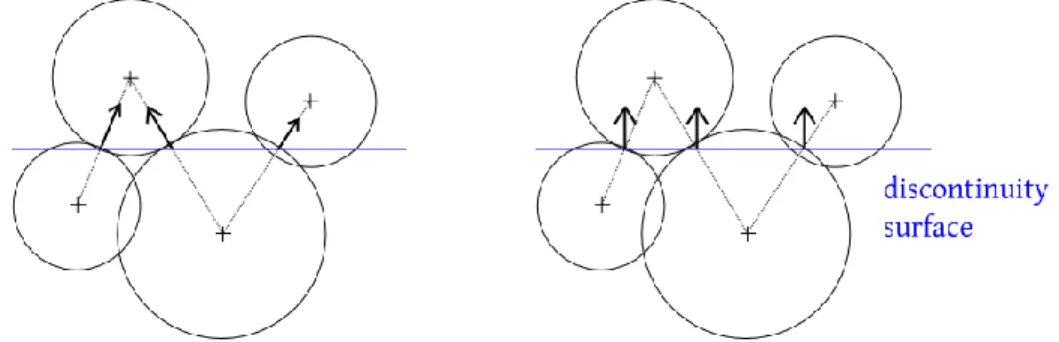
Due to the spherical shape of the discrete elements, planar discontinuity surfaces cannot be described without being dependent of the discretization. For this reason, the present model uses the smooth-joint model (SJM) proposed by Ivars et al. (2011). The SJM is applied to all interactions located across pre-existing discontinuity surfaces, as cracks. The SJM modifies the orientation of the interaction according to the orientation of the pre-existing discontinuity (Figure 2). A frictional elastic-plastic behavior is prescribed along the discontinuity surface, with very small influence of the roughness generated by the spherical elements. The SJM’s behavior is characterized by three parameters: normal and tangential joint stiffnesses and a local joint friction angle ϕ. It is important to note that ϕ corresponds to the resulting macroscopic friction angle of the simulated discontinuity surface, unlike for the matrix, where the internal friction angle of the medium does not correspond to the friction angle φ defined at the bonds scale.
Figure 2 – Interaction between spheres across a pre-existing discontinuity surface, e.g., a crack. For classical DEM (left), or the present model using SJM (right)
NUMERICAL SET UP
First, we consider uniaxial compression of a 3D pre-cracked sample, with a single flaw persistent along the Y direction (Figure 3). Using published experimental results, it is possible to check the relevancy of the model through comparisons. In the present configuration, the sample is strained along Z using rigid frictionless platens.
Figure 3 – Pre-cracked model for mode I+II analysis
Open and closed flaws are considered. Open flaws are straightforward simulated by removing the discrete elements located along the flaw. For closed flaws, most authors only cancel the cohesive feature of flaw interactions, and set up purely frictional interactions at the flaw location (Potyondy & Cundall, 2004; Wang & Mora, 2008). This closed flaw modeling is compared with simulations involving the use of the SJM to emphasize the advantages of this latter model. Using the SJM approach, the influence of the flaw friction angle is then analyzed.
DEM analysis of mode I+III crack propagation
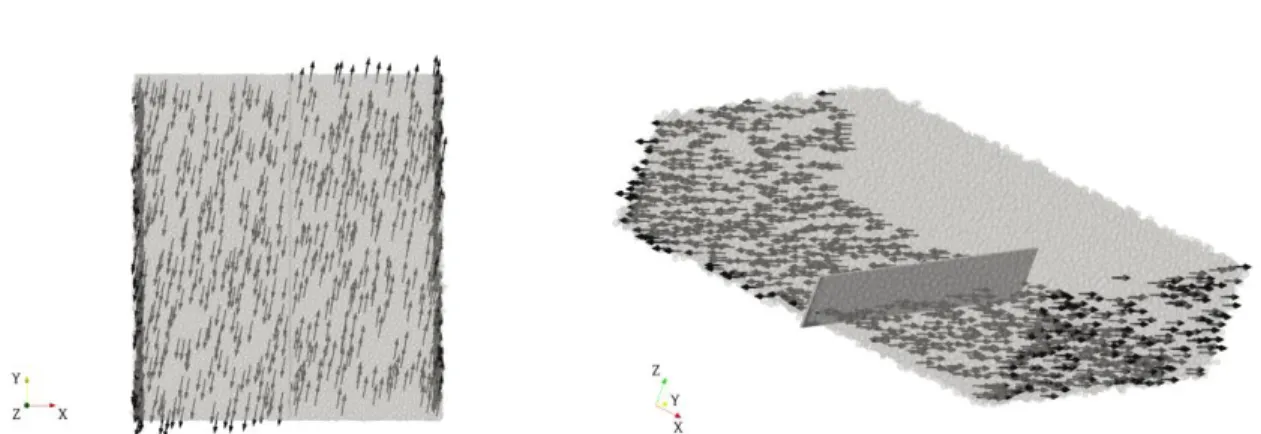
Mode I+III loadings are considered using the regular parallelepipedic sample shown in Figure 4. The sample includes a non-persistent (along Z) parent closed crack. Out-of-plane shear occurs through constant opposite Y-velocities imposed on the bottom and lateral boundaries. Different X-velocities are also imposed to the same boundaries, with an angle α defined in Equation (2):
vx / vy = tan(α) (2)
Pure opening (mode I) corresponds to α=90°.
Figure 4 – Top (left) and general (right) views of the mode I+III model: the velocity field is imposed at the lateral and bottom boundaries. On the right, the dark rectangle corresponds to the parent crack
Propagation of the parent crack through the intact medium is investigated until it reaches the surface (maximum Z-value). Simulated crack patterns are compared with previous published results.
RESULTS & DISCUSSION Mode I+II crack propagation
Open flaws
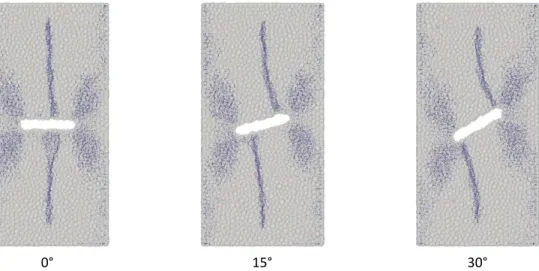
For an open flaw, crack propagation generates classical split cracks that tend to align with the maximum principal stress (Figure 5). Increasing the orientation angle θ (Figure 3) shifts the departure of the fracturing from the crack center to the crack tips, producing typical wing crack patterns. In addition to the wing cracks, diffuse microcracking develops at each tip of the flaw, forming butterfly like patterns which could be associated to the so-called secondary cracks observed in previous studies. All these results have been classically observed in experiments (Nemat-Nasser & Horii, 1982; Park & Bobet, 2009; Wong & Einstein, 2009) and support the relevancy of the model.
Closed flaws
Strengths of samples containing closed flaws with different orientations are measured. Three different discrete element packings were considered: two samples involving 20 000 elements with the same size distribution (mean diameter D) but different spatial distributions and a third sample involving 125 000 particles with a mean diameter D’ ~ D/2. Compressions of each sample were simulated with and without the SJM (the normal reorientation presented in the Figure 2). As depicted in Figure 6, a packing dependency exists when the SJM is not used, whereas a coherent and similar response is obtained when the SJM is used. Moreover, it is possible to follow the evolution of the sample strengths depending on the flaw friction angle for different orientations of the flaw: it can be noted that a minimum strength is obtained for a critical orientation linked to input flaw friction angle, see the Figure 7. The strength is in fact affected only when the flaw inclination is superior to the flaw friction angle, emphasizing the role of the frictional strength of the flaw surface on the overall strength of the sample.
0° 15° 30°
Figure 5 – Open crack propagation patterns for different flaw inclinations. Captured for σ = 21±1 MPa (peak strength is 30±1 MPa)
Figure 6 – Influence of the flaw inclination on strength using the SJM (left) and classical DEM (right), for different samples. The flaw friction angle ϕ is equal to 18°
Figure 7 – Influence of the flaw frictional properties on strength using the SJM for different flaw inclinations
Thus, in presence of closed flaws, the behavior of the model depends on the input mechanical parameters only; as long as these closed flaws are simulated using the SJM. Typical wing crack propagations can be generated as long as the inclination of the flaw is greater than the flaw friction angle. This dependency has been observed experimentally (Park & Bobet, 2009; Shen & Stephansson, 1995) and supports once again the relevancy of the model. For high flaw inclinations however (θ ≥ 60°), wing cracks and secondary cracks can no more be distinguished.
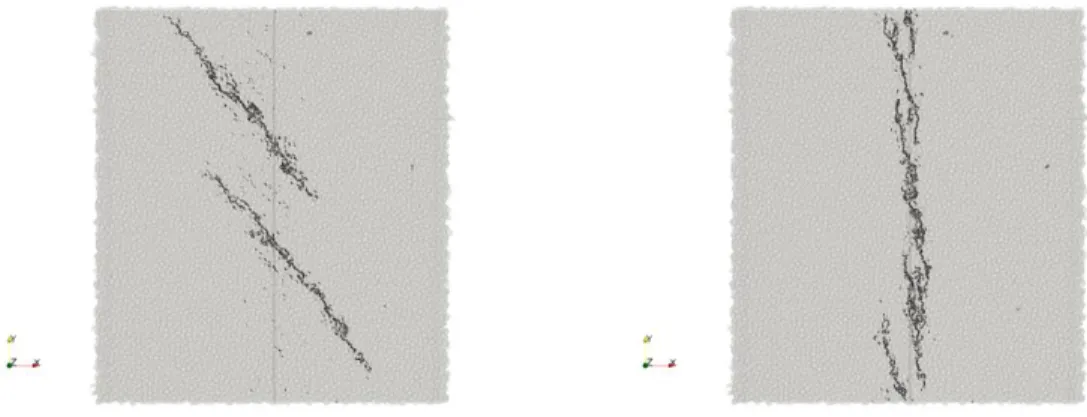
As mentioned previously, the propagation pattern depends on the flaw friction angle (Figure 8). Fracturing is more diffuse for high values of the flaw friction angle (Figure 8 right). Whereas well localized crack zones appears for small values of the flaw friction angle (Figure 8 left).
ϕ=0° ϕ=36°
Figure 8 – Closed crack (inclination angle θ = 45°) propagation patterns with a flaw friction angle ϕ of 0° (left) and 36° (right). At σ = 29.8±0.6 MPa (peak strength is 34 MPa)
These results highlight the need to use the SJM for DEM crack propagation analysis in presence of closed crack. Without the SJM, the flaw friction angle cannot be controlled, and the crack propagation patterns can be far from the expected localized response. This could explain the conclusions drawn by Wang and Mora (2008). These authors stated that wing cracks could not be retrieved through DEM simulations without introducing a contact moment law. However in this work, closed flaws, intended as frictionless, were simulated without the SJM, producing an uncontrolled friction on the flaw surface related to the discrete element roughness. In view of our results shown in the Figure 7, the different strengths of models of Yang and Mora, gathered in Figure 9, suggest that the flaw friction angle they finally obtained belong to [30;45°] interval. Our results (Figure 8) suggest that wing cracks may not appear for such flaw friction angle.
Figure 9 – Strengths of DEM models of Yang and Mora (2009) with closed flaws intended as frictionless
Mode I+III propagation
Crack propagation in mode I+III starts with an array of small en-échelon cracks located above the parent crack, with a shift in its orientation, i.e. twist angle, (in XY plane, see Figure 4) from the parent crack direction. In neighbouring cracks pairs of the array, one crack may prevent the other to propagate;
so that only some cracks of the array propagate along Z (towards the surface of the model) as they increase in length. The final orientation shift and lengths of the surface cracks depend on the loading mode related to α which can be itself related, in the elastic domain, to the stress intensity factor ratio KIII
/ KI (Leblond & Frelat, 2014). The surface crack patterns for α=5° and 60° is shown in Figure 10. The
orientation of the surface patterns for different values of α in [0;90°] are presented in Figure 11. Results obtained with two different models are presented in the same figure, the first one is a small-scale physical experiments performed with wet clay (Smith & Durnay, 1992), and the second one is based on analytical developments (Leblond & Frelat, 2014). A good agreement exists between these three fundamentally different approaches. This supports the relevancy of our DEM for such study.
Figure 10 – Surface crack patterns obtained with the DEM model for α=5° (left, preponderant mode III) and α=60° (right, preponderant mode I)
Figure 11 – Orientation of surface cracks for different loadings and fundamentally different models. Data from (Smith, 1992) come from small-scale physical modelings performed using wet clay, and the other
from (Leblond, 2014) result from an analytical linear elastic fracture mechanics approach (LEFM)
Rock fracture propagation from a pre-existing crack is simulated using DEM. Considering mode I+II loadings the model has proven to be relevant for different flaw properties. For instance, closed flaws can be analyzed mechanically independently of artefacts arising from the model formulation. It has been shown that, in addition to the mechanical properties of the rock matrix that certainly influence failure in brittle rocks, crack propagation is greatly influenced by the flaw mechanical properties of the pre-existing flaw at a first order.
In the case of mode I+III loadings the crack patterns revealed by the model are consistent with different other experimental or analytical approaches. Hence, related to its relative simplicity, the proposed DEM model appears as an efficient, tool to study the geometry of complex mixed loading modes.
AKNOWLEDGEMENTS
The authors thanks ANR GeoSMEC (2012-BS06-0016-03) and its principal investigator, Y. Klinger, for funding and stimulating project.
REFERENCES
Bobet, A., Einstein H.H. (1998). Numerical modeling of fracture coalescence in a model rock material.
International Journal of Fracture,92(3), 221-252.
Cho, N., Martin, C. D., & Sego, D.C. (2007). A clumped particle model for rock. International Journal of
Rock Mechanics and Mining Sciences,44(7), 997-1010.
Donzé, F.V., Bouchez, J. & Magnier S.A. (1997) Modeling fractures in rock blasting. International Journal of
Rock Mechanics and Mining Sciences,34(8), 1153-1163.
Hazzard, J.F., Young, R.P., & Maxwell, S.C. (2000). Micromechanical modeling of cracking and failure in brittle rocks. Journal of Geophyscial Research: Solid Earth, 105(B7), 16683-16697.
Huang, H., Lecampion B., & Detournay, E. (2013). Discrete element modeling of tool-rock interaction I. Rock cutting. International Journal of Numerical and Analytical Methods in Geomechanics,
31(13), 1913-1929.
Ivars, D.M., Pierce, M.E., Darcel, C., Reyes-Montes, J., Potyondy, D.O., Young, R.P., Cundall, P.A. (2011). The synthetic rock mass approach for jointed rock mass modelling.International Journal of Rock
Mechanics and Mining Sciences,48(2), 219-244.
Leblond, J.-B., & Frelat, J. (2014). Development of fracture facets from a crack loaded in mode I+III: Solution and application of a model 2D problem. Journal of the Mechanics and Physics of Solids,
64, 133-153.
Nemat-Nasser, SI, & Horii, H. (1982). Compression-induced nonplanar crack extension with application to splitting, exfoliation, and rockburst. Journal of Geophyscial Research: Solid Earth, 87(B8), 6805-6821
Park, C.H., & Bobet, A. (2009). Crack coalescence in specimens with open and closed flaws: A comparison.
Potyondy, D.O., & Cundall, P.A. (2004). A bonded-particle model for rock. International Journal of Rock
Mechanics and Mining Sciences,41(8), 1329-1364.
Scholtès, L., & Donzé, F.-V. (2013). A DEM model for soft and hard rocks: Role of grain interlocking on strength. Journal of the Mechanics and Physics of Solids, 61(2), 352-369.
Shen, B., & Stephansson, O. (1993). Numerical analysis of mixed mode I and Mode II fracture propagation.
International Journal of Rock Mechanics and Mining Sciences,30(7), 861-867.
Shen, B., & Stephansson, O. (1995). Coalescence of fractures under shear stresses in experiments. Journal
of Geophysical Research, 100, 5975-5990.
Smith, J.V., & Durney, D.W. (1992). Experimental formation of brittle structural assemblages in oblique divergence. Tectonophysics, 216(3-4), 235-253.
Tang, C. (1997). Numerical simulation of progressive rock failure and associated seismicity. International
Journal of Rock Mechanics and Mining Sciences,34(2), 249-261.
Wang, Y., & Mora, P. (2008). Modeling wing crack extension: Implications for the ingredients of discrete element model. Pure and Applied Geophysics, 165(3-4), 609-620
Wong, L.N.Y., & Einstein H.H. (2009). Systematic evaluation of cracking behavior in specimens containing single flaws under uniaxial compression. International Journal of Rock Mechanics and Mining