HAL Id: hal-00317813
https://hal.archives-ouvertes.fr/hal-00317813
Submitted on 27 Jul 2005
HAL is a multi-disciplinary open access
archive for the deposit and dissemination of
sci-entific research documents, whether they are
pub-lished or not. The documents may come from
teaching and research institutions in France or
abroad, or from public or private research centers.
L’archive ouverte pluridisciplinaire HAL, est
destinée au dépôt et à la diffusion de documents
scientifiques de niveau recherche, publiés ou non,
émanant des établissements d’enseignement et de
recherche français ou étrangers, des laboratoires
publics ou privés.
The red sky enigma over Svalbard in December 2002: a
model using polar stratospheric clouds
N. D. Lloyd, D. A. Degenstein, F. Sigernes, E. J. Llewellyn, D. A. Lorentzen
To cite this version:
N. D. Lloyd, D. A. Degenstein, F. Sigernes, E. J. Llewellyn, D. A. Lorentzen. The red sky enigma
over Svalbard in December 2002: a model using polar stratospheric clouds. Annales Geophysicae,
European Geosciences Union, 2005, 23 (5), pp.1603-1610. �hal-00317813�
SRef-ID: 1432-0576/ag/2005-23-1603 © European Geosciences Union 2005
Annales
Geophysicae
The red sky enigma over Svalbard in December 2002: a model using
polar stratospheric clouds
N. D. Lloyd1, D. A. Degenstein1, F. Sigernes2, E. J. Llewellyn1, and D. A. Lorentzen2 1ISAS, University of Saskatchewan, Saskatoon, Canada
2The University Centre in Svalbard (UNIS), N-9171 Longyearbyen, Norway
Received: 10 February 2005 – Revised: 16 March 2005 – Accepted: 17 March 2005 – Published: 27 July 2005 Part of Special Issue “Atmospheric studies by optical methods”
Abstract. An anomalous red glow due to scattered sunlight was observed at Longyearbyen (78◦N, 15◦E) on 6 Decem-ber 2002 from 07:30 UT to 13:30 UT when the solar zenith angle varied between 100.7◦and 104◦. A model for this red
sky event using sunlight scattered in a two stage process by Polar Stratospheric Clouds (PSC) at 25 km is presented and demonstrated to be feasible. The model requires a signifi-cant fraction of the polar vortex, which is cold enough for the formation of ice PSC, to be occupied with PSC with an integrated vertical extinction of approximately 0.037 at 845 nm. Given these conditions, the model is able to pre-dict, within an order of magnitude, the spatial distribution of intensities measured by meridional scanning photometers lo-cated at Longyearbyen across the visible and near infra-red spectrum.
Keywords. Aerosols and particles; Transmission and scat-tering of radiation; Polar Meteorology
1 Introduction
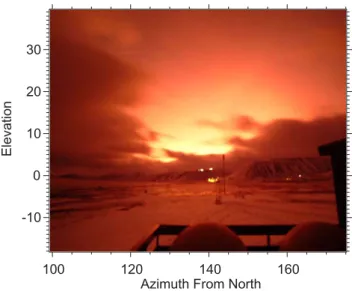
On 6 December 2002 the town of Longyearbyen, Spitsber-gen (78◦N, 15◦E) was bathed in a red glow for several hours which was, according to eye witnesses, comparable in bright-ness to a moonlit night. Normally, the town, which is 12◦ north of the Arctic circle, would be engulfed in darkness. The red glow started at ≈07:30 UT, peaked around 10:00 UT and faded away by ≈13:30 UT. A wide angle photograph of the event at 08:40 UT is shown in Fig. 1. While the event was witnessed by most of the town’s population and caused considerable concern, it was also recorded by a suite of opti-cal instrumentation at the Auroral Station located a few kilo-meters outside Longyearbyen and by the OSIRIS instrument onboard the Odin spacecraft, (Sigernes et al., 2004). This
Correspondence to: N. D. Lloyd
(nick.lloyd@usask.ca)
type of event has never been observed before at the Auro-ral Station during its 25 years of operation nor, to the best of our knowledge, are there are any reports in the literature of such events. Consequently it is of interest to investigate plausible mechanisms for the red sky event. In this article we shall focus on one possible mechanism where sunlight is scattered from below the horizon by an extended region of Polar Stratospheric Clouds (PSC) within the polar vortex.
Before we embark on a detailed description of the scat-tering mechanism it is convenient to review the optical mea-surements of the red sky event as well as other ancillary data that are presented in detail by Sigernes et al. (2004). The Longyearbyen Auroral Station is equipped with two spec-trometers and a 5 channel meridional scanning photometer (MSP) that are designed to measure auroral emissions dur-ing the long polar night. All of the instrumentation was op-erational during the red sky event although the skies over Longyearbyen were partly cloudy. The MSP measured in-tensity at 1◦ steps in elevation at 5 wavelengths (428 nm, 486 nm, 558 nm, 630 nm and 845 nm) along a fixed azimuth, 135◦ from North. The MSP employs a tilting filter mech-anism that allows it to measure not only auroral emissions but also the background continuum at a nearby wavelength. It is this background continuum which is of primary inter-est in this study. The time evolution of the MSP background continuum at 845 nm and 428 nm during the red sky event are shown in Fig. 2 and Fig. 3 respectively, while the correspond-ing solar zenith angles at Longyearbyen are shown in Fig. 4 and the wavelength dependence of the signal is shown in Fig. 5. It is evident that the red sky event was approximately symmetric about solar noon and was considerably weaker at blue wavelengths than at near infra-red wavelengths.
The spectrometers at the Auroral Station clearly identi-fied the red sky as a broad continuum phenomenon rather than a series of discrete emissions. The presence of solar, Fraunhofer, absorption features within the spectrometer data immediately led Sigernes et al. (2004) to conclude unequivo-cally that the red sky must be due to sunlight originating from
1604 N. D. Lloyd: The red sky enigma: a model using PSC
100 120 140 160 Azimuth From North -10 0 10 20 30 Elevation
Fig. 1. Photograph of the red sky event taken at 08:42:41 UT with
a Fujifilm S2Pro (4256×2848 pixels) digital camera using a 14 mm lens, F2.8 aperture, 30 s exposure and 1600 ISO. The field of view of the lens is specified in degrees.
0 20 40 60 80 Elevation 06:00 08:00 10:00 12:00 14:00 0 62500 125000 187500 250000 Rayleighs
Fig. 2. The time evolution in UT of the 845 nm background
con-tinuum data from the Longyearbyen Auroral Station MSP on 6 De-cember 2002. The signal is integrated over a 5 ˚A filter. The MSP scans elevation at a fixed azimuth, 135◦from North.
below the horizon and could not possibly be due to auroral emissions. In addition, the OSIRIS, limb-scanning, spectro-graph onboard the Odin satellite also observed the red glow just west of Novaya Zemlya (74.4◦N, 49.9◦E) but only when scanning altitudes below 30 km. This eliminated any possi-bility that the glow was due to sunlight scattered off high al-titude (≈82 km) mesospheric clouds, high alal-titude chemical releases or any other scattering mechanism above 30 km.
The stratospheric polar vortex, as determined from an ECMWF analysis at a potential temperature of 550 K (≈24.2 km), was well developed on 6 December 2002 and a pool of air, cold enough for the formation of ice PSC, cov-ered an area from Greenland to almost Novaya Zemlya and from all of Spitsbergen to much of northern Scandinavia and Finland, Fig. 6. This structure persisted from 4 to 7 De-cember 2002 over Spitsbergen and 4 to 10 DeDe-cember 2002 above northern Scandinavia and Finland. A lidar system at
0 20 40 60 80 Elevation 06:00 08:00 10:00 12:00 14:00 200 400 600 800 1000 Rayleighs
Fig. 3. The time evolution in UT of the 428 nm background
con-tinuum data from the Longyearbyen Auroral Station MSP on 6 De-cember 2002. The signal is integrated over a 5 ˚A filter. The MSP scans elevation at a fixed azimuth, 135◦from North.
100 102 104 106 108 110 Solar Zenith Angle (degrees) 06:00 08:00 10:00 12:00 14:00
Fig. 4. The variation of solar zenith angle with UT at Longyearbyen
during the red sky event. The lowest solar zenith angle is 100.7◦at 10:48 UT.
the Koldewey Station in Ny ˚Alesund, Spitsbergen (79◦N,
12◦E) was not operational during the red sky event due to overcast conditions but did observe type I PSC the next day, 7 December 2002. It is clear that the conditions from Spits-bergen to northern Scandinavia during the red sky event were favourable for the formation of PSC. Finally, Sigernes et al. (2004) note that while the red sky event was only seen in Longyearbyen on 6 December 2002, followed by 3 days of overcast conditions, there were reports from local inhabitants of a red sky occurrence in the North-East of Svalbard, Kin-nvika (80◦N, 18◦E) on 5, 6 and 7 December 2002.
2 The model
The observational evidence clearly identifies the red sky event as a phenomenon that requires sunlight to be directed from the sunlit side of the Earth into the dark side. However the question of how the light is redirected is less clear. Real-istically, there are only two mechanisms for redirecting light in the atmosphere: the light can either scatter off surfaces
or volumes (clouds and aerosols for example) or the rays of light can be physically bent due to atmospheric refraction. The difficulty in any mechanism is making it work for the large solar zenith angles present during the red sky event. For example, the photograph in Fig. 1 was taken when the sun was 13◦ below the horizon. It is difficult to reconcile this large solar depression angle with the deflection of light rays due to atmospheric refraction. Atmospheric mirages are quite common in Arctic regions and good examples typically produce deflections of 1◦or perhaps 2◦. It is not evident how this size of deflection, which is basically adjusting the appar-ent solar zenith angle by 1◦or 2◦could explain the red sky event. Consequently, any explanation for the red sky event based solely upon atmospheric refraction would require re-markable conditions to have existed in the troposphere so it could have produced significantly larger deflections. While this would be useful for explaining the rarity of the event there is no observational basis for this assumption and is not pursued any further in this work.
Mechanisms that scatter light off surfaces or volumes are able to redirect light over large angles as long as the alti-tude of the scatterer is sufficiently high. Initial speculation on the red sky event considered Polar Mesospheric Clouds at 82 km as a scattering source even though they are not nor-mally thought to exist in the wintertime mesosphere. The main attraction of these clouds, at least from a radiative trans-fer point of view, is that they are so high that sunlight can be redirected around the Earth in a single scatter. However, the idea had to be dismissed once the OSIRIS satellite data showed there was no red sky signal above 30 km.
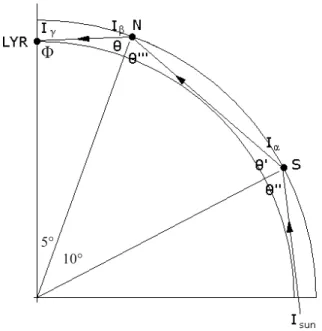
On the other hand, there was considerable evidence for the existence of PSC during the red sky event: the polar vor-tex was well formed, OSIRIS observed red sky signal in the stratosphere and lidars observed PSC on surrounding days. However, PSC which typically occur in the height range 20– 30 km, can scatter light over substantial angles but would not be high enough to scatter sunlight directly from the sun to Longyearbyen during the event. Instead any explanation of the red sky event using PSC must involve a multiple stage, scattering process. It is this multiple scattering process that we model in this work. An example of a two scatter mech-anism is illustrated in Fig. 7. Briefly, a PSC at 25 km can see approximately 5◦along a great circle to the edge, or
tan-gent point, of the solid Earth. Similarly, a PSC at 25 km can see another PSC located up to 10◦away. In this manner a
two scatter process can direct light around solar depression angles as large as 15◦. The real question is not whether the mechanism can work at all but whether the PSC are able to deflect sufficient light around the Earth to Longyearbyen and produce the observed spatial distribution of radiation. In the following sections we shall model the signals observed by the MSP at Longyearbyen Auroral Station and show that two stage scattering of sunlight by an extended area of PSC is a feasible mechanism for the red sky phenomenon.
MSP Variation with Wavelength, 10:00 UT
400 500 600 700 800 900 Wavelength (nm) 0 5.0·104 1.0·105 1.5·105 2.0·105 2.5·105 Rayleighs Measured Modelled
Fig. 5. The variation of the red sky signal with wavelength
as measured by the MSP (triangles). Although the spectrum is coarsely sampled by the MSP (428 nm, 486 nm, 558 nm, 630 nm and 845 nm) it is clear the red wavelengths(>600 nm) dominate over the shorter wavelengths. The plot is taken at 10:00 UT at an elevation of 10◦. The corresponding model output is also shown for comparison (stars). -30 -15 0 15 30 45 60 75 65 70 75 80 85
Fig. 6. An illustration of the observing geometry used in our model
for the red sky event. The circle is the local horizon for Longyear-byen (78◦N, 15◦E) and the line through the circle indicates the azimuth of the Meridional Scanning Photometers. The dash-dot-dash outline that extends from Greenland to Novaya Zemlya and from northern Scandinavia and Finland to above Spitsbergen is the region of air, at potential temperature 550 K, cold enough for the formation of ice PSC. The array of small rectangular boxes defines the location of the 243 southern PSC used in the model. The upper northern edge of the boxes corresponds to the sun’s shadow height at 25 km altitude. Any PSC north of this boundary, at 25 km alti-tude, cannot be directly illuminated by the sun.
2.1 Model geometry
To model the red sky phenomenon we have assumed that the entire region of the polar vortex that is cold enough for the formation of ice PSC, is covered in a uniform blanket of PSC located at 25 km altitude. This area is determined in Sigernes et al. (2004) from an ECMWF analysis at a
1606 N. D. Lloyd: The red sky enigma: a model using PSC
5° 10°
Φ
Fig. 7. Schematic showing the path taken by one ray in the model.
Sunlight is scattered from the southern PSC (S) towards the north-ern PSC (N). The light is scattered at the northnorth-ern PSC into the field of view of instrumentation at Longyearbyen (LYR). The an-gles, 2, 20, 200, 2000 and 8 indicate the scattering angles used in Eqs. (1), (2) and (3). The 5◦and 10◦indicate the maximum angu-lar distance a given cloud can be from the Earth’s tangent point and another PSC respectively.
potential temperature of 550 K. The geometry is illustrated in Fig. 6. Only two parts of the cold polar vortex region partic-ipate in the radiative transfer calculation. The first region is the circular, northern region centered on Longyearbyen cor-responding to the instrumentation’s field of view. This north-ern region, which is never in direct sunlight, acts as the final scattering surface and stretches from horizon to horizon over Longyearbyen. The second region is the southern section of the cold polar vortex at 25 km that is directly illuminated by sunlight during the event. These southern PSC act as the first scattering surface, directing sunlight towards the north-ern PSC. For the purposes of computation we have broken the southern region into an array of 243 smaller PSC each with identical optical properties.
2.2 Radiative transfer
The model computes the total radiance observed at Longyearbyen by summing the contributions from each of the 243 southern PSC. The contribution for each southern cloud is split into three components. First there is the propa-gation of light from the sun through a spherical atmosphere to the southern PSC. Second, sunlight scatters from the south-ern PSC and propagates to the northsouth-ern PSC. Finally there is scattering from the northern PSC followed by propagation to Longyearbyen. The model accounts for Rayleigh extinc-tion and ozone absorpextinc-tion and employs a spherical shell ge-ometry for all rays. All rays are assumed to be straight and
no attempt is made to model the bending of rays by atmo-spheric refraction. Nor is any attempt made to model extinc-tion due to tropospheric clouds. The dry air Rayleigh cross-sections are calculated using the formulae given in Bates (1974), Chappuis ozone cross-sections are from Bogumil et al. (2000), the neutral density is calculated using the ex-tended MSIS95 code (Hedin, 1995) and a typical northern winter ozone profile is taken from the UGAMP database (Li et al., 1983).
Determining the exact scattering phase matrix of a PSC is complex as the particles are not usually spherical and the radii and chemical composition can change with time. Rather than attempt to model such complex behavior we have simply calculated a phase matrix using a spherical Mie code (Wiscombe, 1980) with a static, log-normal, strato-spheric particle distribution (mode radius=0.17µ, standard deviation=0.44µ, refractive index of H2SO4). While we do
not claim this is a particularly accurate description of PSC, it is adequate for our purposes as we only want to ensure our PSC model incorporates a sensible forward scattering char-acteristic. We have not made any attempt to model the PSC scattering cross-section from first principles but simply enter the value as a free parameter derived from the cloud’s in-tegrated vertical extinction, ρ. We have implicitly assumed that the PSC are both physically and optically thin and that each southern PSC can be modelled as a single representative point location multiplied by its geographical area, A.
A summary of the three stages of propagation is given by the following three equations while the corresponding schematic is shown in Fig. 7. First we have propagation from the sun to each of the southern PSC (α) and scattering to-wards the northern PSC (β)
Iα(θ0) = ISun(θ00)e−τ (α,Sun)ρ
P (θ0, θ00)
4π cos(θ0) (1)
this is followed by propagation to the northern PSC and scat-tering towards Longyearbyen,
Iβ(θ ) = Aρ L2Iα(θ 0 )e−τ (β,α)P (θ 000, θ0)cos(θ0) 4π (2)
It should be noted that the decrease in solid angle due to the inclination of the area of the southern PSC to the ray travel-ling to the northern PSC is cancelled by the increased path length of this ray through the southern PSC. Finally there is propagation from the northern PSC to Longyearbyen (γ ).
Iγ(φ) =
Iβ(θ )
cos θe
−τ (Lyr,β) (3)
where I is the radiance at a given location in a specific di-rection, θ , θ0, θ00, θ000 and φ are the directions of the rays at the various locations (see Fig. 7), A is the geographic area of each southern cloud, L is the distance of each southern cloud from the northern cloud, ρ is the integrated vertical ex-tinction of the cloud, P (x0, x)is the scattering phase matrix from incoming angle x to outgoing angle x0 and τ (a, b) is the optical depth from point a to point b given by
τ(a, b) = X
species
Z b a
in which nk(s)is the number density of species k at location
sand σk(s)is the cross-section of species k at location s.
The model completely ignores multiple scattering terms. Neglecting multiple Rayleigh scattering from the bulk at-mosphere is entirely reasonable since we are attempting to model conditions that are normally dark and ignoring multi-ple scatter within the PSC is reasonable, to first order, since the clouds are assumed to be optically thin.
3 Model results
The model was built to create snapshots of the entire southern sky seen from the Longyearbyen Auroral Station at 10 min intervals from 06:00 UT to 14:00 UT. Each snapshot was generated at a resolution of 1.0◦ in azimuth, 1.0◦ in
eleva-tion and at wavelengths ranging from 400 nm to 900 nm in 50 nm intervals as well as at the specific wavelengths of the 5 MSP channels. The model outputs intensity which is a func-tion of 4 independent variables: azimuth, elevafunc-tion, time and wavelength. It is not practical to show the entire span of all 4 dimensions of model output in the limited space available here. Instead we show a selection of slices through the data space that highlight important characteristics of the modelled radiation field.
The deep red colour of the phenomenon is readily ex-plained by the wavelength dependence of the optical depth of the sun from Longyearbyen. A typical example is shown in Fig. 8. All wavelengths shorter than 650 nm suffer consid-erable losses along their trajectory due to Rayleigh extinction and ozone absorption.
The modelled intensity at Longyearbyen is proportional to ρ2, the square of the PSC’s integrated vertical extinction. Since ρ is a free parameter of the model we found by in-spection that a value of ρ equal to 0.037 provided reason-able agreement between the observed and modelled signals at 845 nm and 10◦ elevation. The resultant comparison is shown in Fig. 9. It is apparent that the model captures the overall essence of the red sky phenomenon. The modelled and measured signals start and finish at the same time and have the same basic shape. However the observed radiances at this elevation and wavelength are slightly wider and flatter than the modelled results. We attribute these differences in shape to minor differences between the actual physical con-ditions during the event and the simple assumptions made in the model.
Normally the PSC integrated vertical extinction, ρ, is a function of wavelength but for simplicity we have assumed it is constant at all wavelengths (ρ=0.037). The resultant mod-elled variation of signal with wavelength at 10:00 UT and 10◦ elevation is shown in Fig. 5. Again the model and measure-ments are in good overall agreement although the model does underestimate the signal at 558 nm and 630 nm. Since both of these wavelengths are within the ozone Chappuis band it is possible that part of the discrepancy may be due to an overes-timate of high latitude ozone in the radiative transfer model.
400 500 600 700 800 900 Wavelength nm 5 10 15 20 Optical depth
Fig. 8. Typical wavelength dependence of the optical depth to
Longyearbyen from the sun. Only wavelengths longer than 690 nm have an optical depth less than 2 explaining the deep red colour of the phenomenon.
Measured MSP 846nm and modelled MSP
0 5.0·104 1.0·105 1.5·105 2.0·105 2.5·105 Rayleighs 06:00 08:00 10:00 12:00 14:00
Fig. 9. Comparison between the UT variation of the observed MSP
data (dots) at 845 nm and the modelled signal (solid line) using an integrated vertical extinction of 0.037. The data are taken from an elevation of 10 deg.
The modelled signal at 08:40 UT and 700 nm as a function of azimuth and elevation is shown in Fig. 10. This output may be compared with the wide angle photograph shown in Fig. 1. We have made the assumption that 700 nm is repre-sentative of the dominant red colour in the wide angle photo-graph. Unfortunately, a visual comparison is the best we can achieve as the camera, which was never intended for quan-titative photometric work, is not well calibrated. It is clear that the model successfully predicts a bright source near the horizon in the south east with diffuse radiation extending in elevation towards the zenith, which is remarkably similar to the wide angle photograph. However, a notable difference is that the brightness in the model peaks around 150◦azimuth while the brightness in the photograph peaks around 135◦
1608 N. D. Lloyd: The red sky enigma: a model using PSC
Synthetic Camera Image, 700 nm, 08:40 UTC
50 100 150 200 250 300
Azimuth From North 0 20 40 60 80 Elevation from Horizon 0. 40000. 80000. 120000. 160000. 200000. Rayleighs
Fig. 10. A snapshot of the modelled sky intensities at 700 nm at
08:40 UT. This figure is a wide angle snapshot comparable with the photograph shown in Fig. 1.
0 20 40 60 80 Elevation 06:00 08:00 10:00 12:00 14:00 0 62500 125000 187500 250000 Rayleighs
Fig. 11. The modelled UT, time evolution of the MSP 845 nm
back-ground continuum data on 6 December 2002. This figure models the observations presented in Fig. 2 and is plotted on an identical colour scale.
azimuth. We believe this difference is not significant in de-ciding whether PSC are capable of directing light around the Earth to Longyearbyen but instead indicates the inevitable differences between our model and the real world. For exam-ple, large scale, spatial structure in the PSC optical thickness or shadowing from tropospheric clouds are both mechanisms that would generate discrepancies between the model output and observations.
The most quantitative, photometric test of the model is a comparison with MSP observations. The modelled, time de-pendent, MSP, 845 nm background signal is shown in Fig. 11 and the corresponding modelled 428 nm signal in Fig. 12. The figures are directly comparable with the MSP measure-ments shown in Figs. 2 and 3, respectively. Note that the 845 nm comparison is shown on identical colour scales while the 428 nm comparison has colour scales in a ratio of approx-imately 4:1.
Overall the agreement between the measured and mod-elled 845 nm signal is remarkably good. The model clearly predicts the start and end of the event as well as the overall distribution of light in elevation. Although there are
differ-0 20 40 60 80 Elevation 06:00 08:00 10:00 12:00 14:00 0 62 125 187 250 Rayleighs
Fig. 12. The modelled UT, time evolution of the MSP 428 nm
back-ground continuum data on 6 December 2002. This figure models the observations presented in Fig. 3 but the colour scales are in an approximate ratio of 4:1. The required difference in colour scales is attributed to the wavelength dependence of the PSC integrated vertical extinction.
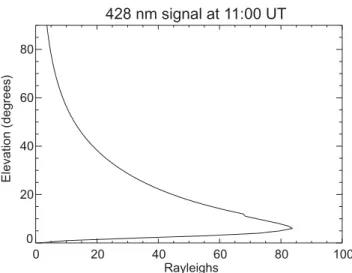
ences between the model and measured results again we be-lieve these are due to minor details rather than a fundamental flaw in the PSC scattering mechanism. For example, much of the fine structure seen in the 845 nm data at elevations greater than 40◦may be due to the passage of patchy tropospheric cloud over Longyearbyen that reflect light coming from the snow covered ground. Notable differences also exist at ele-vations below 5◦. While the measured 845 nm data exhibit a peak in signal several degrees from the horizon, the modelled signal rises monotonically as it approaches the horizon. Un-doubtedly the mountainous, local terrain as well as the pres-ence of patchy, tropospheric clouds are playing some role in this discrepancy. However, it is also possible to produce a peak in the modelled signal at low elevations by modifying the geographic distribution of PSC in the southern region. In essence, low elevation rays in the northern PSC region have long path lengths through the lower troposphere and suffer considerable extinction. This extinction can be off-set if there are sufficient PSC in the southern region that are sufficiently close to the scattering point in the northern PSC region that they can direct enough light towards the northern point. Removing these nearby PSC points in the southern re-gion severely impacts the signal at low elevations and a peak can be obtained. The effect is evident in the 428 nm modelled output, Fig. 13, where a peak in signal is seen at low eleva-tions. At this shorter wavelength all ray paths have much greater Rayleigh extinction and the PSC in the northern ex-tents of the southern region cannot direct sufficient sunlight towards the low elevation points in the northern PSC region to overcome the subsequent extinction.
A visual comparison between the 428 nm modelled MSP signal, Fig. 12, and the measurements, Fig. 2, is also remark-ably good. There is a factor of approximately 4 between the modelled and measured results which we interpret as a dif-ference due to the wavelength dependence of the PSC in-tegrated vertical extinction, ρ. Since the modelled inten-sity is proportional to the square of ρ we can reconcile the
modelled intensities at 428 nm with the measured intensities by a factor of 2 increase in the PSC scattering cross-section at 428 nm over that at 845 nm. A nominal factor of 2, corre-sponding to an ˚Angstrom exponent of 1.0, seems reasonable for a typical PSC.
4 Discussion
Our simple radiative transfer model does seem to capture the major features of the red sky phenomenon and is able to predict the major features of the observed intensity as a function of time, elevation and wavelength. The redness of the red sky is perhaps the most visually striking aspect of the phenomenon yet this feature is simply due to the strong wavelength dependence of the Rayleigh and ozone cross-sections. The resultant extinction, from the long atmospheric path lengths, naturally produces red spectra.
A more impressive feature of the model is that it clearly demonstrates that a large area of PSC occupying the cold polar vortex is not only capable of pumping sufficient sun-light around the Earth but will produce a distribution of inten-sity at Longyearbyen very similar to that actually observed. There are minor differences between the modelled and mea-sured spatial distributions of light but this is not surprising as the model has very few degrees of freedom and, for the most part, is constrained by geophysical conditions. The PSC are assumed (constrained) to uniformly occupy the po-lar vortex derived from the ECMWF analysis while the light rays are constrained by the positions of the sun, polar vor-tex and Longyearbyen. The only true, free parameter is the integrated vertical extinction, ρ and it is unreasonable to ex-pect this one parameter to capture the rich diversity of at-mospheric conditions that probably existed across the entire polar vortex region during the event.
As noted above, there are indications within the model comparison that the PSC structure was not completely uni-form across the polar vortex. However, the model is only sensitive to structure in the brightness reaching Longyear-byen and these intensity variations can be achieved by ei-ther modulating the cloud’s integrated optical thickness, ρ, or by modulating the extinction along the ray paths with tro-pospheric clouds. For example, examination of the AVHRR 12µ channel images at 10:08 UT and 11:14 UT show tropo-spheric clouds above the Kola peninsula (67◦N, 37◦E) ex-tending almost to Novaya Zemlya. It is apparent this bank of cloud will play some undetermined role in modulating the brightness of PSC that exist in the eastern regions of the polar vortex.
Given the simplicity of the model it is not clear how the mechanism could fail once the model’s conditions are met. Ironically, this creates the paradoxical situation where the rarity of the red sky event, which has only been observed once in the last 25 years, contradicts the apparently simple model requirement of extended PSC occurrence in the polar vortex regions. 428 nm signal at 11:00 UT 0 20 40 60 80 100 Rayleighs 0 20 40 60 80 Elevation (degrees)
Fig. 13. Variation of the modelled MSP signal at 428 nm with
ele-vation at 11:00 UT. The peak at lower eleele-vations occurs because the corresponding rays have longer paths in the troposphere and suffer greater extinction.
Meeting the model conditions may not be quite as simple as it first seems as the red sky event requires PSC with an in-tegrated vertical extinction of the order of 0.037 at 845 nm to be distributed over a considerable fraction of the polar vor-tex. This relatively large vertical extinction would almost certainly require the presence of type II, ice PSC as other types of PSC have much weaker extinction, (Enell et al., 1999; Reichardt et al., 2004).
M¨uller et al. (2001) used multi-year lidar measurements from Ny ˚Alesund, Spitsbergen and Sodankyl¨a, Finland to show that there is a distinct, non-uniform occurrence of PSC within the polar vortex. In particular, while type II PSC were often observed over Finland they were only observed once over Spitsbergen during the entire multi-year program. The discrepancy between the two stations was attributed to their nominal position within the polar vortex: Sodankyl¨a is near the edge of the vortex while Ny ˚Alesund is normally close to the center. Hence the rarity of the red sky event, as described by this model, would be associated with a freak occurrence of type II PSC over Spitsbergen in the center of the polar vor-tex as well as in the southern regions near the edges of the vortex. There were no lidar measurements on Spitsbergen on the day of the red sky event that can validate or disprove this hypothesis but the strong stratospheric scattering observed by OSIRIS just west of Novaya Zemlya is compelling. Li-dar measurements from Ny ˚Alesund on the day after the red sky event, 7 December 2002, did not detect any type II PSC but unfortunately there was also no red sky event there ei-ther. Finally, optically thinner, type I PSC are prevalent over Spitsbergen and we can offer no reason why correspondingly weaker red sky events have not been observed before.
1610 N. D. Lloyd: The red sky enigma: a model using PSC 5 Conclusions
We have demonstrated that the red sky event observed at Longyearbyen on 6 December 2002 can be modelled by the scattering of sunlight by PSC if a large area of the polar vor-tex is occupied with PSC, such as type II ice PSC, that have a relatively large integrated vertical extinction of the order of 0.037 at 845 nm. Once this condition is met then the model is able to replicate the observed spatial distribution of inten-sities at several wavelengths within an order of magnitude. The model itself has no special attribute that can directly ac-count for the rarity of the red sky event but we speculate that red sky events are rare because it is difficult to establish type II PSC over Spitsbergen.
Acknowledgements. We would like to thank the two referees and
editorial staff for making many useful suggestions that significantly improved the original document. This work was supported by the Canadian Space Agency and the National Sciences and Engineering Research Council (Canada). The Auroral Station in Adventdalen is owned by the University of Tromsø and operated by The University Centre on Svalbard (UNIS). We deeply appreciate the support of the Optical group at the Geophysical Institute, University of Alaska, who own the MSP instruments used in this study.
Topical Editor U.-P. Hoppe thanks two referees for their help in evaluating this paper.
References
Sigernes, F., Lloyd, N., Lorentzen, D. A., Neuber, R., Hoppe, U. P., Degenstein, D., Shumilov, N., Moen, J., Gjessing, Y., Havnes, O., Skartveit, A., Raustein, E., Ørbæk, J. B., and Deehr, C. S.: The Red-sky enigma over Svalbard in December 2002: Observa-tions, Ann. Geophys., in press, 2005.
Bates, D. R.: Rayleigh Scattering by Air. Planet. Space. Sci., 32, 6, 785–790, 1984.
Bogumil, K., Orphal, J., and Burrows, J. P.: Temperature depen-dent absorption cross sections of O3, NO2, and other atmo-spheric trace gases measured with the SCIAMACHY spectrome-ter”, Proc. ERS - Envisat Symposium. Looking down at our Earth in the New Millennium, Gothenburg, 16–20 October 2000. Hedin, A. E.: Extension of the MSIS Thermosphere Model into
the Middle and Lower Atmosphere, J. Geophys. Res., 96, 1159– 1172, 1991.
Li, D. and Shine, K. P.: A 4-D Ozone Climatology for UGAMP Models, UGAMP Internal Report No. 35, April 1995.
Wiscombe W. J.: Improved Mie scattering algorithms, Appl Opt., 19, 1505–1509, 1980.
M¨uller, M., Neuber, R., Beyerle, G., Kyr¨o, E., Kivi, R., and W¨oste, L.: Non-uniform PSC occurrence with the Arctic polar vortex. Geophys. Res. Lett., 28, 4175–4178, 2001.
Enell, C. F., Steen, ˚A., Wagner, T., Frieß, U., Pfeilsticker, K., Platt, U., and Fricke, K. H.: Occurrence of polar stratospheric clouds at Kiruna., Ann. Geophys., 17, 1457–1462, 1999,
SRef-ID: 1432-0576/ag/1999-17-1457.
Reichardt, J., D¨ornbrack, A., Reichardt, S., Yang, P., and McGee, T. J.: Mountain wave PSC dynamics and microphysics from ground-based lidar measurements and meteorological modeling, Atmos. Chem. Phys., 4, 1149–1165, 2004,