First International Conference on Bio-based Building Materials
June 22nd - 24th 2015
Clermont-Ferrand, France
122
INFLUENCE OF SIMULATED DESUPHURISED WASTE ON THE PORE SIZE
DISTRIBUTION OF CEMENT PASTES AT 28 DAYS OF CURING
JM. Khatib 1*, L. Wright2, PS. Mangat3, M. Sonebi4
1 Faculty of Science and Engineering, University of Wolverhampton, Wulfruna Street,
Wolverhampton, UK
2 Pick Everard, Halford House, Charles Street, Leicester, UK
3 Centre for Infrastructure Management, MERI, Sheffield Hallam University, Howard Street,
Sheffield, UK
4 Queen’s University Belfast, School of Planning, Architecture and Civil Engineering, Belfast, UK
*Corresponding author; e-mail: j.m.khatib@wlv.ac.uk
Abstract
This paper presents some results on pore size distribution of cement paste incorporating simulated desulphurised waste (SDW) at 28 days of curing. The SDW was used in this work due to the wide variability in chemical composition of actual desulphurised waste. The SDW is a mixture (by weight) of 85% of fly ash and 15% gypsum. The cement was replaced (by weight) with 0, 10, 30 and 70% SDW. The water to binder ratio was 0.5. The binder consists of cement and SDW. After the predetermined curing period of 28 days, representative samples were taken, dried and tested for the total pore volume and pore size distribution using the mercury intrusion porosimetry technique. The intruded pore volume increases as the amount of SDW in the paste increases. Also the threshold diameter of pastes containing higher amounts of SDW increases indicating a coarser pore structure. Generally the percentage of small pores decreases with increasing amounts of SDW.
Keywords:
Desulphurised waste, FGD waste, porosity, pore size distribution, waste
1 INTRODUCTION
Over the past few years, there has been increasing pressure on governments to consider the effects of industry on the environment. An example of this is the evolution of the new Environment Agency set up in the UK that deals with environmental issues within England and Wales [Environmental Agency 2014]. The power industry in many parts of the world uses fossil fuel such as coal in order to produce energy. This causes the emission of not only carbon dioxide but sulphur and nitrogen gases. Many countries throughout the world have adopted the principle of clean coal technology. This has led to the installation of desulphurisation systems to existing and new coal power plants in order to reduce or eliminate the amount of sulphur gases emitted into the atmosphere. Desulphurised systems generally introduce alkali such as limestone to the sulphur gasses. Upon reaction, a solid desulphurised waste is produced. Generally, there are three different categories of desulphurisation processes. These are wet, semi dry and dry processes. Therefore, the composition of the desulphurised waste produced depends upon the process used. That is why the desulphurised wastes generated vary in their
chemical compositions. They can vary from pure calcium sulphate (i.e. Gypsum) to a combination of fly ash and calcium sulphite hemihydrate or calcium sulphate dehydrate [Khatib et al 2008; Khatib et 2014]. Details about the variability in chemical compositions of desulphurised waste are given elsewhere [Mangat et al 2006]. Apart from the pure gypsum produced from the wet process, the rest of the waste is generally sent to landfill. In order to reduce some of the environmental problem associated with its disposal, using desulphurised waste in construction applications can be advantageous.
At present, there is a wealth of knowledge on the use of traditional mineral admixtures. However, because of their variability, knowledge behind the performance of other mineral waste such as desulphurised wastes in cement-based materials is limited. Concerted efforts have been made to implement these types of waste in construction and engineering applications, such as concrete, lightweight aggregates and lightweight blocks [Mangat et al 2006; Khatib el al 2007]. The limited utilisation of desulphurised waste from dry and semi-dry processes are mainly due to the wide variation in chemical, physical and mineralogical properties of
ICBBM 2015
123 the waste. In addition, desulphurised wastes also contain large quantities of sulphate. In plain cements, this can cause significant retardation of the hydration process through suppressing the reaction of clinker minerals such as tricalcium aluminate (C3A), in
addition to changing the types of hydration products formed, which can affect long-term strength Wild et al 1995.
The use of mineral admixtures such as fly ash and slag on the porosity and pore size distribution of cement based applications is well established [Jian & Guan 1999; Singh & Garg 1996; Wee et al 1995; Cook & Hover 1999]. However, there is not much information on the use of desulphurised waste produced from the dry and the semi dry process in concrete as partial replacement of cement. This work is a part of wide range investigation on the use of desulphurised waste in construction applications This paper reports some results on intruded pore volume and pore size distribution of cement pastes containing varying amounts of desulphurised waste as partial substitution of cement. Due to the variability of the desulphurised waste, it was decided to use synthetic desulphurised waste consisting of 85% fly ash and 15% gypsum (by weight). This was referred to as simulated desulphurised waste (SDW). In aa previous study, the SDW was found to have similar properties to actual desulphurised waste. The cement in the paste was replaced with 0%, 10%, 30% and 70% SDW. All pastes were cured for 28 days. After that, samples were tested for porosity and pore size distribution using the mercury intrusion porosimetry technique.
2 EXPERIMENTAL
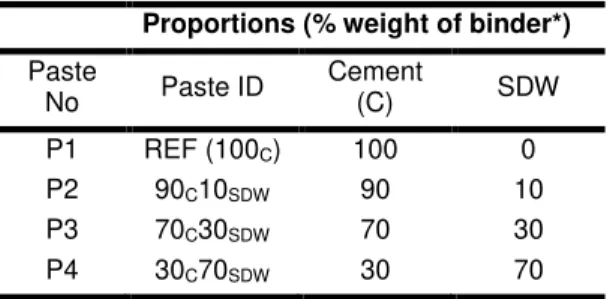
The materials used in the preparation of pastes were Portland cement (C) 42.5N, fly ash (FA), gypsum (G) and water. The oxide compositions of C, FA and G are presented in Table 1. Four pastes were prepared containing different amounts of SDW to partially replace the cement Table 2). Paste P1 represents the reference paste containing 100% C and no SDW. In pastes P2, P3 and P4, the cement was replaced with 10%, 30% and 70% SDW. As stated in the introduction that the SDW was a mixture of 85% fly ash and 15% gypsum (by weight). The water/binder was kept constant at 0.5. The binder consists of cement and SDW. Further details about the materials are given elsewhere [Khatib et al 2013; Mangat et al 2006]
The paste samples consisted of cubes of 50mm in size. All samples were placed in a mist curing room at 20ºC±1ºC and 95%±5% relative humidity for 24 hours. After that demoulding took place and cubes were placed in water at 20ºC until testing. At 28 days, the cubes were tested for compressive strength and samples were taken from the middle of crushed cube. A suitable sample size used for the analysis was between 0.9 and 1.2g. The samples were dried in an oven at 70°C until a constant weight was achieved. This usually took approximately 48 hours. After drying, the samples were placed in an airtight bottle until testing. Mercury intrusion porosimetry was then used to determine the intruded pore volume and pore size distribution. Further information on the testing technique is found in a previous investigation [Mangat & Khatib 1992; Khatib & Wild 1996; Khatib & Mangat 2003; Khatib 2014]].
3 RESULTS AND DISCUSSION
Figure 1 to Figure 4 show the cumulative pore volume curves and pore size distribution (PSD) curves for pastes containing 0%, 10%, 30% and 70% simulated desulphurised waste (SDW) respectively. The grey bars in the figures indicate the amount of small pores (i.e. pores whose diameters are below 0.1 µm).
The total intruded pore volume (i.e. the porosity of the paste) of pastes was 179, 188, 246 and 325 mm3/g for pastes containing 0%, 10%, 30% and 70% SDW respectively. This indicates that there is an increase in total pore volume in the presence of SDW and this increase is systematic in that as the percentage of SDW increases the intruded pore volume increases. The percentage increase (relative the reference paste P1-i.e. 0%SDW) in the intruded pore volume was 5%, 37% and 82% for paste containing 10%, 30% and 70% SDW respectively. With regards to the pore size distribution curve represented by the bars (i.e. histogram), it can be seen that for the reference paste P1 (0%SDW), there exists on peak on the curve as can be seen in Figure 1 around 0.2µm in diameter. At 10% SDW (Paste P2) shown in Figure 2, the distribution is somewhat similar to the reference paste. However at 30% and 70% SDW (Figures 3 and 4), the shape of the distribution curve is different in that it can be observed the emergence of a secondary peak. The pore size distribution histograms can be interpreted in terms of the threshold diameters and the percentage of small pores. The threshold diameter is the diameter before which the pore volume rises sharply. Further details about the determination of threshold diameter are discussed elsewhere [Khatib & Wild 1996]. A larger threshold diameter is indicative of coarser pore sizes or larger pore structure. It can be see that as the percentage of SDW increases, the threshold diameter tends to increase. For example the threshold diameter for the reference paste P1 (Figure 1), the threshold diameter is around 0.2 µm. However, at 30% and 70% SDW, the threshold diameters are 0.8 and 1.0 µm respectively.
Another way of discussing the pore size distribution is by the amount of small pores in the pastes. It is assumed that small pores are pores whose diameter is less than 0.1 µm. As mentioned earlier that the grey bars are the small pores. The area of the grey part of the curve decreases as the percentage of simulated desulphurised waste (SDW) increases. This is an indicative of coarser pore size in the presence of SDW. The higher the content of SDW the coarser the sizes of pores. The simulated desulphurised waste presented in the work is a combination of large proportion fly ash and small proportion of gypsum. The change in behaviour in pore size distribution is therefore due to the presence of fly ash and gypsum. Replacing cement with fly ash may lead to decreased porosity and increased pore refinement [Manmohan and Mehta 1981]. This may be caused by the pozzolanic properties of the fly ash, i.e. delayed hydration. The CH released during cement hydration increases the pH of the pore solution, which then reacts with the silica and alumina components of the fly ash to form additional C-S-H and C-A-H. These products fill the open capillary pores, which result in an improvement in the pore structure [Uchikawa 1986]. In the present
ICBBM 2015
124 investigation, pastes P2, P3 and P4 contain fly ash
as well as gypsum and the presence of gypsum may have reduced the pozzolanic activities leading to coarser pore structure and higher porosity. Tab. 1: Chemical composition of binder
Major oxide (weight)
Material CaO Fe2O3 Al2O3 SiO2 MgO K2O Na2O SO3
Cement (C) 64.80 2.80 4.49 21.10 1.03 0.65 0.15 3.12 Fly ash (FA) 6.74 4.62 31.74 48.91 1.51 1.20 0.60 1.75 Gypsum (G) 35.55 0.07 0.21 0.38 0.02 0.02 0.01 49.20
Tab. 2 : Mix proportions of mixes Proportions (% weight of binder*) Paste No Paste ID Cement (C) SDW P1 REF (100C) 100 0 P2 90C10SDW 90 10 P3 70C30SDW 70 30 P4 30C70SDW 30 70
Cajella [1986] reported that the reactivity of fly ash could be improved by adding sulphate to increase the reactivity of the fly ash or the formation of sulphate containing C-A-S-H products that form around the fly as particles. However at 28 days this was not evident in the present study where different amounts of gypsum were included in pastes M3-M8. Excessive gypsum replacement can result in a retardation of the hydration process as the ettringite formed on the fly ash particles increases, which temporally retards the reaction with lime [Singh & Garg 1996; Wild et al 1990]. This did appear to be the case, especially in the mix containing just gypsum as replacement. 0 100 200 300 400 0 5 10 15 20 25 30 100.00 10.00 1.00 0.10 0.01 C P V ( m m ³/ g ) R P V ( % )
Pore Diameter (micron)
REF (100C) - 28 Days
Fig. 1: Pore size distribution of the reference paste (P1). 0 100 200 300 400 0 5 10 15 20 25 30 100.00 10.00 1.00 0.10 0.01 C P V ( m m ³/ g ) R P V ( % )
Pore Diameter (micron)
90C10SDW- 28 Day
Fig. 2: Pore size distribution of paste M2 containing a blend of 90%C and 10%SDW. 0 100 200 300 400 0 5 10 15 20 25 30 100.00 10.00 1.00 0.10 0.01 C P V ( m m ³/ g ) R P V ( % )
Pore Diameter (micron)
70C30SDW- 28 Day
Fig. 3: Pore size distribution of paste P3 containing a blend of 70%C and 30%SDW 0 100 200 300 400 0 5 10 15 20 25 30 100.00 10.00 1.00 0.10 0.01 C P V ( m m ³/ g ) R P V ( % )
Pore Diameter (micron)
30C70SDW- 28 Day
Fig. 4: Pore size distribution of paste P4 containing a blend of 30%C and 70%SDW.
ICBBM 2015
125
4 CONCLUSIONS
Replacing cement with different simulated desulphurised waste (SDW) increased the total intruded pore volume of cement pastes at 28 days of curing. Increasing the gypsum content in the SDW generally increased the total intruded pore volume, increased the threshold diameter (TD) and decreased the percentage of small pores of pastes indicating a decrease in pore refinement compared to the reference paste.
5 REFERENCES
[Calleja J 1986] Calleja J. Future trends in the research of the structure, properties and behaviour of blended cements, 8th International Congress on the Chemistry of Cement, Vol.1, pp.233-248, Rio de Janeiro, Brazil.
[Cook RA 1999] Cook RA , Hover KC, Mercury porosimetry of hardened cement pastes, Cement and concrete research, 29, pp. 933-943.
Environmental Agency (2014), https://www.gov.uk/government/organisations/enviro nment-agency
[Jiang L 1999] Jiang L , Guan Y, Pore structure and its effect on strength of high volume fly ash paste, Cement and Concrete Research, 29, pp.631-633. [Khatib, JM 1996] Khatib JM, Wild, S, Pore Size Distribution of Metakaolin Paste”, Cement and Concrete Research Journal. Vol.26, pp. 1545-1553. [Khatib JM 2003] Khatib JM, Mangat, PS, Porosity of cement paste cured at 45C as a function of location relative to casting position, Journal of Cement and Concrete Composites, Vol 24, pp. 97-108.
[Khatib, JM 2007] Khatib JM, Mangat PS and Wright, L, Using Flue Gas Desulphurisation (FGD) Waste in Mortar, Proceedings of the International Conference: Concrete Platform 2007, 19-20 April, Queen’s University Belfast, pp. 395-404.
.[Khatib, JM 2008] Khatib JM, Mangat, PS and Wright, L, Sulphate Resistance of Blended Binders Containing FGD Waste, Construction Materials Journal - Proceedings of the Institution of Civil Engineers (ICE), Vol 161, Issue CM3, pp. 119-128. [Khatib JM 2013] Khatib JM, Mangat PS and Wright L, Early Age Porosity and Pore Size Distribution of Cement paste with Flue Gas Desulphurisation (FGD) Waste, Journal of Civil Engineering and Management, Vol 19, No 5, pp 622-627
[Khatib J 2014], Khatib JM, Effect of Initial Curing on Absorption and Pore Size Distribution of Paste and
Concrete Containing Slag, Korean Society of Civil Engineers (KSCE) Journal , Vol 18, Issue 1, pp 264-272
[Khatib JM 2014] Khatib JM, Mangat PS and Wright, Pore Size Distribution of Cement pastes Containing Fly Ash-Gypsum Blends Cured for 7 Days, Korean Society of Civil Engineering (KSCE) Journal, Vol 18, No 4, pp. 1091-1096.
[Mangat PS 1992] Mangat PS, Khatib JM, Influence of initial curing on pore structure and porosity of blended cement concretes, American concrete institute, SP 132-45, Proceedings of the 4th international conference on Flay ash, Slag and natural pozzolanas in concrete, pp. 813-833. [Mangat PS 2006] Mangat PS, Khatib, JM and Wright L., Optimum Utilisation of Flue Gas Desulphurisation (FGD) Waste in Blended Binder for Concrete, Construction Materials Journal - Proceedings of the Institution of Civil Engineers. Vol 1, No. 2, pp. 60-68.
[Manmohan D 1981] Manmohan D, Mehta PK, Influence of pozzolanic, slag, and admixtures on pore size distribution and permeability of hardened cement pastes, Cement, Concrete and Aggregates, Vol.3, pp.63-67.
[Singh M 1996] Singh M, Garg M, Relationship between mechanical properties and porosity of water-resistant gypsum binder, Cement and Concrete Research, 26, 3, pp. 449-456
[Singh M 1996] Singh M, Garg, Relationship between mechanical properties and porosity of water-resistant gypsum binder, Cement and Concrete Research, 26, 3, pp. 449-456.
[Uchikawa H 1986], Uchikawa H , Effect of blending components on the hydration and structure formation, 8th International Congress on the Chemistry of Cement, Vol.1, pp. 249-280.
[Wee TH 1995] Wee TH, Matsunaga Y, Watanabe Y, Sakai E, Microstructure and strength properties of high strength concretes containing various mineral admixtures, Cement and Concrete Research, 25, 4, pp. 715-720.
[Wild S 1995] Wild S, Hadi, Khatib J, The influence of gypsum content on the porosity and pore-size distribution of cured PFA-lime mixes, Advances in Cement Research, 7, pp. 47-45.
[Wild S 1990] Wild S, Hadi, Ward GL, The influence of gypsum content on microstructural development, strength and expansion of cured PFA-Lime mixes, Advances in Cement Research, 3, pp.153-166.