First International Conference on Bio-based Building Materials
June 22nd - 24th 2015 Clermont-Ferrand, France
CHARACTERIZATION OF HEMP AGGREGATES – COMPARISON OF SEVERAL
SIZE ANALYSIS
S. Liandrat1*, M. Trauchessec1, L. Blachère1, S. Amziane2 1 Cerema, Direction Territoriale Centre-Est, France 2
Université Blaise Pascal, Institut Pascal, BP 20206, Clermont-Ferrand, France *Corresponding author; e-mail: sebastien.liandrat@cerema.fr
Abstract
Bio-based concretes are mixes of vegetal aggregates with a mineral binder. These new materials are used for buildings as coating, wall or roofing. They provide good properties to the constructions in terms of hygrometry, acoustic, thermic and lightness. Bio-based aggregates used in these new materials are very different from classical mineral aggregates used in concrete. Their intrinsic characteristics have strong impacts on bio-based concrete properties. There are no official standard methods to describe bio-based aggregates and so it appears as an important issue to develop this field. This study is focused on hemp aggregates, which is a material commonly used in bio-based concrete. It is about how to evaluate the size of these non-mineral particles. Mineral aggregates size is defined with a single measurement because they are assimilated as a sphere, with eventually a shape coefficient to characterize flattening. Bio-sourced aggregates have a more parallelepiped shape. Two methods already exist to characterize them and are frequently used: sieving and image analysis. This study proposes a new method based on the use of a videogranulometer device. This device is based on shadowgraph principle and makes a continuous measurement on particles. It enables to obtain the width and length of each particle simultaneously, as image analysis method, with a better efficiency. This article details the elaboration of this method of evaluation of aggregate size properties: the choices of the parameters and the adaptation of the device. Compared results between the three methods, the two usual ones and the videogranulometer one, show a good correlation between the videogranulometer method and the classic ones. As a conclusion, the method developed here has the best amount of analyzed aggregates time necessary ratio and describes as well each particle, offering a great representativeness of a hemp stock.
Keywords:
Hemp shiv, granular distribution, image analysis, air-jet sieving, videogranulometer, classical sieving
1 INTRODUCTION
The construction field has recently started to evolve with the development of new materials bringing new properties to buildings. An example of these new materials is bio-based which provide interesting performance in acoustic, thermal insulation, humidity control and also lightness.
This study is part of the research operation carried by Cerema and Ifsttar entitled Matériaux Bio-sourcés Naturels pour une construction durable (Natural bio-based materials for sustainable construction). This study deals specifically with hemp concrete, which consists in a mineral hydraulic binder (cement and/or lime) and vegetal aggregates (hemp).
Nowadays, “standard” concrete composed of mineral aggregates has a full normative reference frame, especially for the use of ingredients. Each of them
(aggregates, binder) has to tie in with physical and mechanical characteristics. The gravel making up the mixtures thus systematically undergo a range of tests to evaluate the particle size (sieve analysis), the amount of fines, the cleanliness and the shape (flattening and flow tests).
The hemp concrete does not have such a normative reference but a series of professional rules. These rules stipulate good practices in terms of constituent properties, mixing or implementation techniques. The aim of this study is to compare several methods which enable to evaluate properties of a component in particular: hemp aggregate, also called the hurd or shiv. The focus is on the size particle characterization that is to say width and length, which give information about elongation and shape of the particles.
Four methods are studied : two are commonly used and described in the professional guides [Construire en chanvre 2012] and two are new and was developed
during the study at the Département Laboratoire de Clermont-Ferrand from Cerema (Centre d’Étude et d’Expertise sur les Risques, l’Environnement, la Mobilité et l’Aménagement). The four methods are: • “Classical” sieving in vibrating enclosure • “Alpine” sieving (or air jet sieving) • Image analysis from scanning of particles
• Videogranulometer (VDG), equipment using image analysis and shadowgraph
For each method, principle, parameters and main results are detailed. Then all the methods are compared according to several standards.
2 GENERALITIES
In order to compare the four methods of size particle characterization, three hemp origins were used for each method. Moreover, every test was repeated five times on different samples.
2.1 First characterization
The three samples were visually different, especially concerning the average size of particles: their width and their length. The quantity of fiber was also different.
Some density tests was made on the three samples, results are detailed in table 1.
Tab. 1: Density of the three sample of hemp
2.2 Fibers removing
For each of the three origins, a step of fiber removing is realized during industrial process of hurds production. However, fibers can still remain in the mix. It was so chosen to remove heap of fibers manually and not to measure them. Indeed they may have been considered as a giant one particle instead of several smaller and so the result would have been wrong.
Fig. 1: example of a heap of fibers
2.3 Sampling
As said above, for each of the three origins, five samples have been prepared in order to test every one of the four compared methods.
Each sample has been prepared identically. Firstly the sample to be reduced is placed in oven at 50°C in order obtain a dry material. Moreover, with this operation, all the samples are at the same hydric condition when the testing is done.
The operation of reduction is done by successive divisions until the desired mass is obtained; the process is shown on figure 2. A reduction using a lane divider has been tested and refused: the hurds remained too often stuck.
Fig.2: Sampling by successive divisions
3 METHOD OF “CLASSICAL” SIEVING 3.1 Principle
This method is called “classical” sieving unlike the next “alpine” sieving method. It is based on sieves which are usually used to characterize size of mineral aggregates, for example in the standard NF EN 933-1 – Determination of particle size distribution – Sieving method. Hemp concrete artisans use “classical” sieving according to professional rules to obtain the size curve and the dust rate of a sample.
3.2 Procedure
The Département Laboratoire de Clermont-Ferrand applied this method following a procedure similar to the professional ones. The sieves used had a 315 mm diameter and metallic woven meshes (the list of the mesh openings used is detailed in the table below). They were in accordance with fascicle FD P 18-663 and Cofrac (French Accreditation Committee).
The stirring process was realized thanks to an electric vibrating enclosure. The duration was chosen to be 20 minutes, according to literature and professional rules. Moreover, the impact of the operator is removed. The test mass was chosen as 100g, consistent with the sieves diameter to avoid their congestion and also in accordance with literature and professional rules.
Tab. 2: Summary of main test parameters
4 METHOD OF “ALPINE” SIEVING (AIR JET SIEVING)
4.1 Principle
This method is adapted from the one described in the standard NF EN 933-10 – Assessment of fines – Grading of filler aggregates (air jet sieving). The principle of this method is to stir the particles instead of the sieve (as in classical sieving). Particle stirring is done applying a depression at the bottom of the apparatus. Only one sieve at each time can be used which make this method slower.
4.2 Procedure
The apparatus used for this method was an Hosokawa Alpine Aktiengesellshaft 200 LS-N linked with a vacuum cleaner. The sieves used had a 200 mm diameter and metallic woven meshes (the list of the mesh openings used is detailed in the table below). The depression was set at 3,0 +/- 0,5 kPa, as it’s given in the standard. The first experiments enabled to set the duration of the test at 20 minutes. Several durations have been tested (10, 20 and 30 minutes) with several hemp origins and all the sieves. It was
Origin A B C
Density 0.092 0.101 0.112
Test mass 100 grams
Sieving time 20 minutes (for a column) Mesh opening (mm) 0.5 – 1 – 1.6 – 2 – 3.15 – 4 -8
checked that the evolution mass was less than 1% within one minute at the end of the test (as explained in the standards). Several test masses were tested and 15g was chosen in accordance with sieve capacity.
Fig. 3: example of air jet sieving apparatus Tab. 3: Summary of main test parameters
5 METHOD OF IMAGE ANALYSIS 5.1 Principle
This method is based on digitization of particles spread over a single-colored area [C. Igathinathane 2009]. The resulting image is analyzed by software. It recognizes the particles and assimilates them to ellipses or a rectangle thanks to a chosen algorithm. These ellipses or rectangles enable to obtain surface, width and length for each particle.
5.2 Procedure
The tests realized at Département Laboratoire de Clermont-Ferrand were done on 4 grams of particles (two images corresponding at 2 grams each). After a sieving at 1 mm, the particles were spread on a black A4 sheet. Then they were digitized with a scanner with 600 pixels per inch (ppi). The software used was ImageJ and the algorithm applied was:
• Conversion in grey level in 8 bits
• Thresholding of particles: only surfaces superior to 562.5 square pixel, which correspond to 1 mm² are taken into account
• Detection of particles with elliptic method or minimal Féret diameter method
The volume of the particles was obtained from length and width with the hypothesis of thickness to width ratio to be constant. The hypothesis of a constant density has been also applied to convert volume curves to mass curves.
Tab. 4: Summary of main test parameters
The minimal Féret diameter method is the one which showed the best correlation with all the other methods. Indeed, its curve was systematically closer to the three other curves in comparison with the elliptic method. It is why, further in this study, only the curves corresponding to the minimal Féret diameter method will be shown.
6 METHOD OF VIDEOGRANULOMETER
(VDG) 6.1 Principle
This method is based on the use of the apparatus videogranulometer also called VDG 40.2 [Y. Descantes 2003]. The measurements are made during the fall of the particles by analyzing their shadows. The supply of particles can be made continuously thanks to the loading hopper. Then the particles are isolated from each other on a stirring lane and fall in front of a light source. A CCD camera detects the shadows induced by this light.
1 Loading hopper 6 Sample collecting tub
2 Stirring lane 7 Electronic rack
3 Separating drum 8 CCD camera
4 Object plane 9 Image plane
5 Light source
Fig. 4: schema of the VDG 40
The results are analyzed by dedicated software which assimilates the shadows of each particle to an ellipse. The software then gives volume curves for width and length by assimilating particles to ellipsoids. With the same hypothesis than before about density, it is so possible to obtain mass curves.
6.2 Procedure
Usually used for mineral aggregates, this apparatus had been lightly modified to measure bio-based particles. Indeed, the stirring lane was not enough efficient to isolate all the particles. A device was attached to the stirring lane in order to encourage particles separation.
The VDG 40.2 can only measure particles which size is superior to 1 mm. Hemp particles were so sieved at 1 mm before the test. Even if a study about the impact of temperature on the test didn’t show anything, it was
Test mass 15 grams
Sieving time 20 minutes (for one sieve) Mesh opening (mm) 0.125 – 0.5 – 1 – 2 – 4
Test mass 4 grams
Digitization Scan 600 ppi - ImageJ Particle detection
methods
Elliptic method / Minimal Féret diameter method
chosen to keep it between 18°C and 26°C during the tests (and as constant as possible during one single test). This method makes a continuous measurement, it was chosen arbitrary a mass test of 100 grams.
Tab. 5: Summary of main test parameters
7 MAIN RESULTS
7.1 Comparison of sieving methods with image analysis and VDG
The results obtained with the two sieving methods cannot be compared with image analysis and VDG without an arrangement of the data. The particles have a flat and elongated shape and pass through square meshes. Therefore, they will naturally position themselves in the diagonal of the meshes. For a particle passing through a sieve with a mesh opening of d, it is necessary to consider it with a width inferior
to x d. This adaptation is illustrated in figure 5.
The curves presented in figures 6, 7 and 8 show the results before and after the adaptation (mentioned with “* root 2”).
Fig. 5: schema of a particle passing through a square mesh of a sieve [V. Picandet 2012]
7.2 Comparative size curves between all the methods
The next three charts show the comparison of the results obtained with the four methods :
• At left: two curves corresponding to the sieving methods before adaptation of the results
• At the middle: the four curves corresponding to the comparison of the four methods for the measurement of particles width
• At right: the curves corresponding to the comparison of image analysis and VDG methods for the measurement of particles length
On each chart, the two leftmost curves correspond to the sieving methods before the adaptation of their results. The four curves at the middle show the comparison of the four methods described in this study. An excellent correlation appears for the three hemp origins tested. Some areas of the graphic show a significant difference between the sieving methods with the other ones. However, these differences are mainly due to a lack of points for the sieving methods (due to a lack of sieve, especially for the air jet sieving). In the literature, a good correlation is
observed between image analysis and classical sieving method (after adaptation of the results). This result is observed in this study too and a similar correlation appears between the VDG and classical sieving method.
Fig. 6: Size curve for hemp of origin A
Fig. 7: Size curve for hemp of origin B
Fig. 8: Size curve for hemp of origin C
Fig. 9: Chart of standard deviations
Test mass 100 grams
7.3 Comparative chart of standard deviations The figure 9 shows the values of standard deviation obtained for each method depending on size. For the sieving methods, the values correspond to the sieves used. All the methods show values of standard deviation low enough to be considered as representativeness for a size test. Indeed, these values are consistent with the tolerance of the standard NF EN 18-545 for the results of sieving
method (standard NF EN 933-1). The videogranulometer method shows particularly low values of standard deviation, inferior to 1%. This excellent repeatability is a very good point for this method.
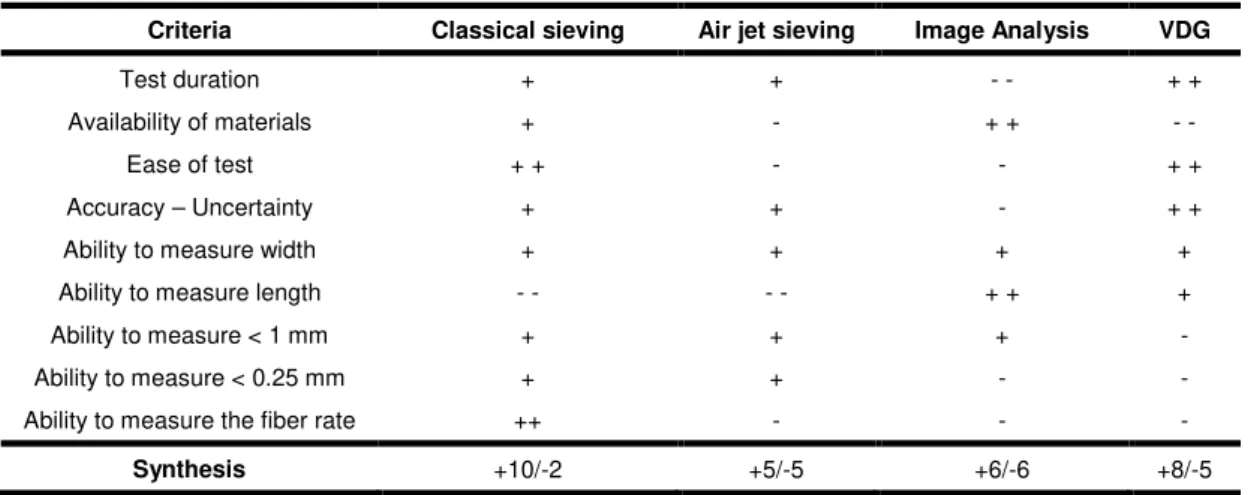
7.4 Summary of comparisons between methods The table 5 shows the strengths and weaknesses for each methods described in this study.
Tab. 5: Summary of strengths and weaknesses
Criteria Classical sieving Air jet sieving Image Analysis VDG
Test duration + + - - + +
Availability of materials + - + + - -
Ease of test + + - - + +
Accuracy – Uncertainty + + - + +
Ability to measure width + + + +
Ability to measure length - - - - + + +
Ability to measure < 1 mm + + + -
Ability to measure < 0.25 mm + + - -
Ability to measure the fiber rate ++ - - -
Synthesis +10/-2 +5/-5 +6/-6 +8/-5
8 CONCLUSIONS
Four different tests were carried out on bio-based particles in this study. Two methods are usually used and two were worked out by the Département Laboratoire de Clermont-Ferrand. The first conclusion is that each of these methods is relevant in regards of the size curves comparison and the standard deviation percentages.
The classical sieving method appears as the most balanced one, its only weakness is its inability to measure length of particles. The air jet sieving method does not provide advantage but can be interesting to get a measure with a single sieve (for example for the passing particle through 0.250 mm or 1 mm).
The videogranulometer appears ideal for recurrent measurements of width and length of particles thanks to its fastness and its high accuracy. However it needs a complementary method for particles passing through 1 mm (for example a sieving method).
The image analysis remains useful for punctual tests. Its low accuracy can be compensated by multiplying the number of successive tests. However, this method is tedious and can only be applied only on very small sample masses. For this method, even more than for the others, the sampling appears crucial.
In conclusion, the best way to completely characterize the size of a sample appears to be a combination of videogranulometer and a sieving method:
• Particles which size is inferior to 1 mm (and 0.125 mm) can be quantified which is very important for the French professional rules
• Particles which size is superior to 1 mm can be totally characterized with their width and length and so shape
• These two methods are applied on a representative enough amount of particles. So the results are relevant enough to characterize any quantity of sample
• The fiber rate can be characterized only by classical sieving method
9 REFERENCES
S. Amziane ; L. Arnaud ; Les bétons de granulats d’origine végétale - application au béton de chanvre. Editions Lavoisier, pages 45-93.
C. Igathinathane ; L.O. Pordesimo ; E.P. Columbus ; W.D. Batchelor ; S. Sokhansanj ; Shape identification and particle soze distribution from basic shape parameters using imageJ ; Computers and Electronics in Agriculture, n°63, p. 168-182.
Y. Hustache ; L. Arnaud ; Synthèse des connaissances sur les bétons et mortiers de chanvre. Construire en chanvre.
V. Picandet ; P. Tronet ; C. Baley ; Caractérisation granulométrique des chènevottes. XXXe rencontre AUGC-IBPSA.
Construire en chanvre ; Règles profesionnelle d’exécution. SEBTP.
Y. Descantes ; J-B. Ducassou ; G. Blot ; Vidéogranulomètre VDG 40 : Synthèse des recherches passes et perspectives (Études et recherches des Laboratoires des ponts et chaussées). Laboratoire Central des Ponts et Chaussées.


![Fig. 5: schema of a particle passing through a square mesh of a sieve [V. Picandet 2012]](https://thumb-eu.123doks.com/thumbv2/123doknet/14749225.579282/4.892.108.441.525.723/fig-schema-particle-passing-square-mesh-sieve-picandet.webp)