EcoGRAFI
2nd International Conference on Bio-based Building Materials & 1st Conference on ECOlogical valorisation of GRAnular and FIbrous materials June 21th - 23th 2017 Clermont-Ferrand, France
MULTI-OBJECTIVE OPTIMIZATION OF BIO-BASED THERMAL INSULATION
MATERIALS IN BUILDING MODELING
Alba Torres1, Mariana Palumbo2, Laureano Jiménez1, Assed Naked Haddad4, Dieter Boer3*. 1 Departament d’Enginyeria Química, Universitat Rovira i Virgili, Tarragona, Spain
2 Dept. de Engenharia Civil Universidade Federal Fluminense, RJ, Brasil 3 Departament d’Enginyeria Mecànica, Universitat Rovira i Virgili, Tarragona, Spain 4 Dept. de Construção Civil, Escola Politécnica da Universidade Federal do RJ, RJ, Brasil
*Corresponding author; e-mail: [email protected]
Abstract
Energy efficiency in buildings is a key objective of nowadays policies. To achieve this goal, three main strategies can be implemented: modify users’ behavior, implement passive measures and implement active measures. Those strategies and the reduction of the energy consumption during the use phase imply both, an initial investment and an environmental impact. The equilibrium between them and their efficiency benefits should be evaluated in advance to any intervention. The present work implements a passive measure, an insulation layer in the building envelope, as example. Mathematical programming and multi-objective optimization methodology is used on a building-like cubicle, which energy consumption has been evaluated combining EneryPlus and JEPlus software. Polyurethane and seven commercial and experimental bio-based thermal insulation materials are compared. The cost and the environmental impact associated to each solution have been quantified using the life cycle assessment methodology. The results show that bio-based materials can reduce the cost and the environmental impact compared to conventional insulating materials. In our study, hemp offered the most balanced solution, achieving a reduction of 14% and 36% in cost and environmental impact respectively for the climate in Lleida.
Keywords:
Multi-objective optimization, life cycle assessment (LCA), bio-based building materials, corn pith, thermal insulation, condensation
1 INTRODUCTION
Intervention in existing buildings is one of the important ways to achieve the challenges to reduce the GHG emissions by 80% of their emissions levels of 1990 for 2050.
Buildings insulation has proven to reduce the energy consumption of buildings, reducing the cost and the environmental impact associated to the energy generation and consumption during the life-span of the building. Nevertheless, it should not be forgotten that this implementation has also a cost and an environmental impact associated to the installation, dismantling and disposal of this materials [1,2]. Nowadays, scientific community is getting interest in innovative solutions to improve the insulation materials, which vary from improving the thermal properties [3] to the reduction of the environmental impact of the materials [4]. This approach focuses on the last aspect, as the performance of seven bio-based materials is analysed. Despite natural materials present a reduction of the environmental impact; their economic cost might compromise them as feasible
solutions. For that reason, and to reduce the polemics associated, an optimization of those materials compared with conventional ones is performed. Optimization algorithms represent a useful tool to find optimal solutions. Different methodologies have been used to optimize specially the energy consumption and the cost [5–7]. In our study, seven bio-based materials are evaluated with a Pareto based multi-objective optimization.
2 METHODOLOGY
2.1 Cubicle description
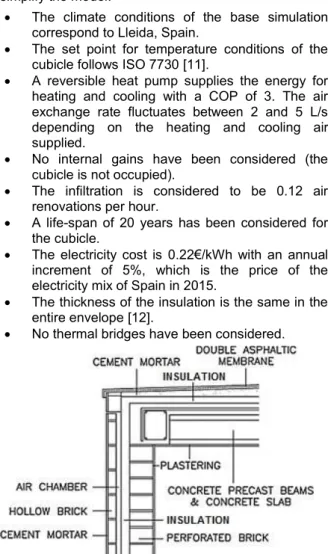
The model corresponds to an experimental cubicle built in Lleida, with a volume of 2.44 × 2.55 × 2.44m, and one window in the south façade of 0.8 × 1.2m. The construction profile is shown in Fig. 1.
This cubicle was built in SketchUp [8] and OpenStudio plug-in [9], and was simulated with EnergyPlus [10] as the calculation engine. The thermal performance of the building was evaluated with the Conduction Transfer Function (CFT).
The following hypotheses have been applied to simplify the model:
• The climate conditions of the base simulation correspond to Lleida, Spain.
• The set point for temperature conditions of the cubicle follows ISO 7730 [11].
• A reversible heat pump supplies the energy for heating and cooling with a COP of 3. The air exchange rate fluctuates between 2 and 5 L/s depending on the heating and cooling air supplied.
• No internal gains have been considered (the cubicle is not occupied).
• The infiltration is considered to be 0.12 air renovations per hour.
• A life-span of 20 years has been considered for the cubicle.
• The electricity cost is 0.22€/kWh with an annual increment of 5%, which is the price of the electricity mix of Spain in 2015.
• The thickness of the insulation is the same in the entire envelope [12].
• No thermal bridges have been considered.
Fig. 1: Envelope components of the sections of wall and roof
The construction material properties have been taken from the Spanish Building Code (CTE) [13] or ITEC [14]. For materials which are not included in the databases, the properties were retrieved from commercial products [15–17]or were determined experimentally [18].
2.2 Model variations
To evaluate the performance of these materials, two different envelope configurations have been considered: insulation inside the air gap or at the interior of the surface of the wall. Furthermore, those envelopes have been studied in three different climate conditions, continental (Lleida, Spain), humid tropic (Porto Velho, Brazil) and dry tropic (Ouagadougou, Burkina Faso), in order to verify their performance in different climate conditions.
The set points of each climate condition have been fixed following the ISO 7730. For a continental climate, two different pairs of lower and upper set points were used, 20-24ºC and 22-26ºC for winter and summer, respectively. On the other hand, both tropic climates have a unique set point for the whole year, 22-26ºC. 2.3 Model functions
Cost assessment
To determine the economic indicator, the total cost has been calculated including the cost of the construction (Costcub (€)), which includes the materials and the
insulating material of the solutions, and the electricity for heating and cooling the cubicle for 20 years (Costelect). 𝐶𝑜𝑠𝑡𝐶𝑢𝑏= ∑ 𝑃𝑟𝑖𝑐𝑒𝑚𝑎𝑡·𝑛· 𝑚𝑚𝑎𝑡·𝑛 𝑛 + 𝑃𝑟𝑖𝑐𝑒𝑖𝑛𝑠· 𝑚𝑖𝑛𝑠 𝐶𝑜𝑠𝑡𝑒𝑙𝑒𝑐𝑡= ∑ 𝑃𝑟𝑖𝑐𝑒𝑒𝑙𝑒𝑐𝑡 𝑚 · 𝑘𝑊ℎ𝑒𝑙𝑒𝑐𝑡· (1 + 𝑖)𝑚 𝐶𝑜𝑠𝑡𝑡𝑜𝑡𝑎𝑙= 𝐶𝑜𝑠𝑡𝐶𝑢𝑏+ 𝐶𝑜𝑠𝑡𝑒𝑙𝑒𝑐𝑡
The total cost of the cubicle’s material was quantified in 940€ in previous researches [19], the electricity price corresponds to 0.22 €/kWh with an increment of 5% per year.
Environmental impact
To determine the total environmental impact, the ReCiPe indicator was used. This indicator includes 17 different impacts aggregated in 3 different damage categories and translated into points with normalizations and weighting factors. To calculate the environmental impact, the total impact of the construction, which has been evaluated by the addition of the different material impacts and the insulating one, and the electricity impact, during 20 years, has been evaluated following the next equations:
𝐼𝑚𝑝𝑐𝑢𝑏 = ∑ 𝐼𝑚𝑝𝑚𝑎𝑡·𝑛· 𝑚𝑚𝑎𝑡·𝑛 𝑛
+ 𝐼𝑚𝑝𝑖𝑛𝑠· 𝑚𝑖𝑛𝑠
𝐼𝑚𝑝𝑒𝑙𝑒𝑐 = 𝐼𝑚𝑝𝑒𝑙𝑒𝑐𝑡· 𝐶𝑜𝑛𝑠𝑒𝑙𝑒𝑐𝑡
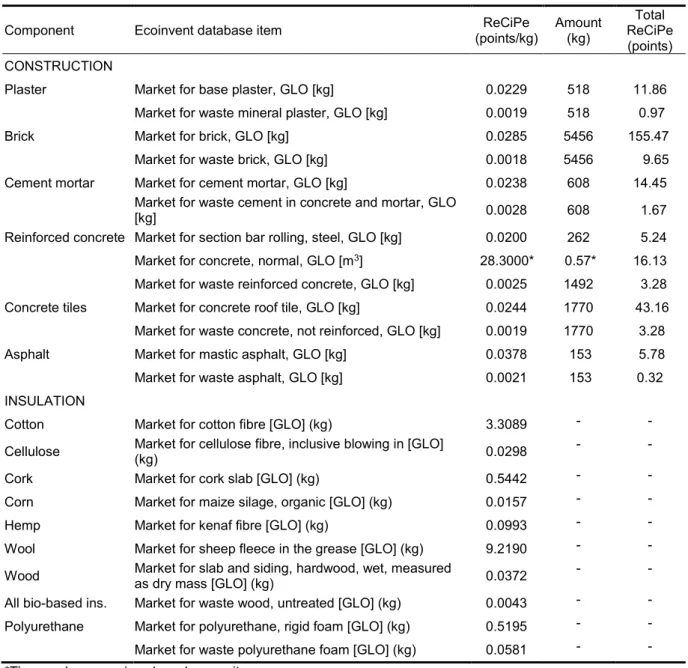
The ReCiPe points attributed to each material are included in Table 1, which include all the impacts from cradle to use and for the disposal. Whereas, the electricity impact correspond to 0.0482 points/kWh, the environmental impact to the electricity generation mix of Spain.
Multi-objective optimization
Those solutions which minimize cost and environmental impact at the same time are chosen as optimal solutions and a Pareto frontier has been constructed with those solutions.
3 RESULTS AND DISCUSSION
3.1 Performance of different natural insulation materials
Economic analysis
As previously explained in section 2, the economic analysis includes the energy consumption of a reversible heat pump for 20 years and the materials cost of the cubicle and the insulation material. The first optimization corresponds to continental climate conditions in Lleida. Seven different natural insulation materials were compared with the objective to find the thickness of each material that corresponds to the minimum cost.
The material costs increases linearly as the thickness increases depending on the cubic meter price of each material. Those materials with a higher price have lower thicknesses and higher energy consumption and can’t achieve cheaper solutions as the materials with lower price. Fig. 2 shows this dependency in the materials cost and in the total cost, 3 natural materials and polyurethane have been chosen to show clearly this effect. Cork corresponds to an example with a high materials cost, whereas cellulose or cotton represent solutions with lower materials cost, more dependent on the electricity cost.
Table 21. Main sources of impact associated with the materials during the manufacturing and dismantling phases.
Component Ecoinvent database item ReCiPe
(points/kg) Amount (kg) Total ReCiPe (points) CONSTRUCTION
Plaster Market for base plaster, GLO [kg] 0.0229 518 11.86 Market for waste mineral plaster, GLO [kg] 0.0019 518 0.97 Brick Market for brick, GLO [kg] 0.0285 5456 155.47
Market for waste brick, GLO [kg] 0.0018 5456 9.65 Cement mortar Market for cement mortar, GLO [kg] 0.0238 608 14.45
Market for waste cement in concrete and mortar, GLO
[kg] 0.0028 608 1.67
Reinforced concrete Market for section bar rolling, steel, GLO [kg] 0.0200 262 5.24 Market for concrete, normal, GLO [m3] 28.3000* 0.57* 16.13 Market for waste reinforced concrete, GLO [kg] 0.0025 1492 3.28 Concrete tiles Market for concrete roof tile, GLO [kg] 0.0244 1770 43.16 Market for waste concrete, not reinforced, GLO [kg] 0.0019 1770 3.28 Asphalt Market for mastic asphalt, GLO [kg] 0.0378 153 5.78 Market for waste asphalt, GLO [kg] 0.0021 153 0.32 INSULATION
Cotton Market for cotton fibre [GLO] (kg) 3.3089 - -
Cellulose Market for cellulose fibre, inclusive blowing in [GLO] (kg) 0.0298 - -
Cork Market for cork slab [GLO] (kg) 0.5442 - -
Corn Market for maize silage, organic [GLO] (kg) 0.0157 - -
Hemp Market for kenaf fibre [GLO] (kg) 0.0993 - -
Wool Market for sheep fleece in the grease [GLO] (kg) 9.2190 - - Wood Market for slab and siding, hardwood, wet, measured
as dry mass [GLO] (kg) 0.0372
- -
All bio-based ins. Market for waste wood, untreated [GLO] (kg) 0.0043 - - Polyurethane Market for polyurethane, rigid foam [GLO] (kg) 0.5195 - - Market for waste polyurethane foam [GLO] (kg) 0.0581 - - *These values are given by volume unit.
Fig. 2: Evolution of materials, electricity and total
cost with thickness increase
As Fig. 2 shows, despite all the materials have similar thermal performance, the energy consumption decreases in a similar tendency, the
total cost of the materials differs significantly among the materials plotted. Wood has the lower thickness in its optimal solution (8 cm) due to the high cost of the insulation material. As Fig. 2 shows, despite the initial reduction in the total cost due to the reduction in the energy consumption, the total cost rapidly increases with a similar slope as the increase of materials cost. On the contrary, hemp has a much lower material price and a much wider optimal thickness (22 cm). Finally, polyurethane shows a slightly better thermal performance than the majority of natural materials with thinner thicknesses, whereas as the thickness is increased this difference is reduced and the energy consumption of the materials is nearly the same.
Environmental impact analysis
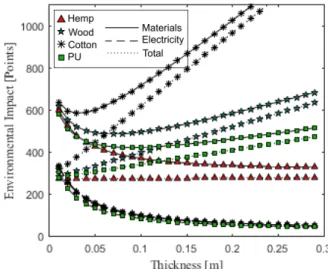
The same methodology was used to analyse the environmental performance of the materials. A cradle to grave analysis was applied for all the insulation and construction materials and the electricity required for maintaining the set point during the life-span of the building. To clarify the
figure, only for materials are shown in Fig. 3, which correspond to representative solutions of all the different materials performance, cotton shows a really high embodied impact, whereas hemp shows a really low one.
As previously happened in the economic section, the minimum point of the total impact is the optimal thickness for this objective. In this case, there can be observed some materials with an important embodied impact, in Fig. 3 cotton has a really fast increase in impact associated to the materials due to the insulation.
Fig. 3: Evolution of materials, electricity and total environmental impact with thickness increase
Against our preconceptions, some materials have a higher environmental impact than polyurethane. For all the selected materials this has two different reasons. In the case of cotton or wool, the environmental impact of the materials is really high due to the high value for the aggregated indicator, especially penalized for the land occupation of those materials. On the other hand, wood and cork are being penalized for the high density of those materials as the environmental impacts are expressed per mass unit. Finally, the others materials have a very similar performance, with low environmental impact associated to the materials. The optimal solutions for the first materials and PU are more dependent of the materials impact, whereas hemp, corn and cellulose environmental optimal solutions are more related to the electricity impact. Despite in thicknesses higher than 15 cm, the energy consumption decreases only slightly as thickness increases, the materials impact increases even less, achieving optimal solutions too high to be implemented in the real scenarios.
Multi-objective analysis
To find the solutions that minimize cost and environmental impact, simultaneously, a multi-objective optimization was performed.
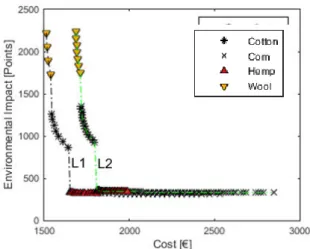
All solutions obtained while optimizing cost and impact individually are initially plotted in Fig. 4. This figure is useful to find solutions which minimize cost and environmental impact individually for each material, which correspond to the inflection point of each materials curve (it also corresponds to those solutions that are closer to the origin of the coordinate system for each material).
Fig. 4: Cost and environmental impact evolution for the different solutions.
Fig. 4 shows that the performance of the different materials is really different, which implies that the selection of the insulation material is a key factor in the majority of the cases. On the other hand, three of the materials have a very similar performance. In this situation, the availability of the materials would be more important than the material chosen. Fig 5 shows the Pareto Frontier solutions corresponds to those solutions situated at the lower envelope and are the values which can’t improve in one objective without worsen the other one.
As both objectives have different units of magnitude, is not possible to achieve one single best solution. For that reason, it’s interesting to show the tendency of the optimal Pareto solutions to find the knee points of the solutions. Those points represent changes in the tendency of the solutions, changing an objective significantly with a really low penalization in the other objective.
Fig. 5: Global optimal solutions constructing the Pareto frontier for the continental climate conditions
and PU solution for comparison.
Fig. 5 represents the global optimal solutions for all the materials and the optimal solutions of polyurethane individually for comparison. Polyurethane solution is clearly dominated in terms of cost, as there are solutions with much cheaper costs, but on contrary of what could be expected, is not much dominated for the environmental point of view, with solutions with only a slightly better
impact. The low impact of PU is due to the thin thickness of the optimal solution compared with other materials and for the slightly better performance if compared to other materials.
Only four of the different materials studied represent global optimal solutions, with two different tendencies. The first one is formed by wool and cotton, with an important reduction of the environmental impact with a small increase in the cost. On the other hand, when the analysis is focused on hemp and corn, small improvement of the environmental impact can be achieved with a high increase in the cost.
The most interesting solution is 22 cm of hemp because is where the trend between both tendencies change (the knee point of the Pareto frontier). This solution can achieve a reduction in the environmental impact of 85.5% with an increase of 16.7% in total cost compared with 15 cm of cotton. Another important aspect shown in Fig. 5 is that the Pareto frontier only includes thick insulation layers, if the thickness of the insulation is limited, PU could be more competitive as it has a thinner optimal solution.
3.2 Configuration of the envelope effect The configuration of the envelope influences the performance of a building. The aim of this section was to study the effect with respect to the optimal solutions.
Two different constructions were studied, one with insulation next to the air gap (core insulation), and the other with the insulation just inside the plaster layer (indoor insulation). The results obtained for Lleida are shown in Fig. 6, whereas all the different climate solutions are shown in the following section.
Fig. 6: Pareto frontier of the different envelope configurations, core insulation (L1) and interior
surface of the wall (L2).
This figure shows that, for Lleida’s climate condition, the most important effect in the optimal solutions are only in terms of cost, whereas the environmental impact and the materials solutions are really similar, with a marginal increment of the environmental impact and slightly lower quantity of optimal solutions.
3.3 Climate conditions effect
The effect of three different climate conditions have been analysed in the previous envelope configurations, the solutions obtained have been plotted in Fig. 7.
Fig. 7: Pareto frontier of the different envelope configurations for the climate conditions: Porto Velho, Ouagadougou and Lleida core insulation
(PV1, O1 and L1 respectively) and inside wall insulation (PV2, O2 and L2).
Similar tendencies can be observed in the different climates and constructions, with the same materials as the optimal ones and the same trend in all the Pareto frontiers. Despite that, some differences can be observed. Firstly, as expected, there is a reduction in the cost of the solutions in Ouagadougou and Porto Velho, due to the less extreme climate conditions of the tropical climates which reduces the heating and cooling electricity cost. Despite this similarity, Ouagadougou and Porto Velho have an interesting difference between the solutions of both constructions. On the first hand, Ouagadougou has a similar tendency than Lleida, with an important difference between the cost of both constructions, whereas in Porto Velho, the difference is lower. This fact can be explained by the small difference between day and night temperatures, which makes that the envelope maintains similar temperatures during the day, which prevents the activation of the thermal inertia.
4 CONCLUSIONS
A multi-objective optimization was developed to evaluate the performance of seven natural materials simultaneously.
If globally analysed, hemp, corn and cellulose showed the best performance, despite that only hemp and cellulose are already available solutions. Corn-pith material is still experimental.
Polyurethane solution is dominated for bio-based materials, because cheaper and more environmentally friendly solutions can be achieved with hemp or similar materials. However, these materials require thicker layers. In situations limited by space, PU could be more competitive.
Similar environmental and thermal properties have been shown by the majority of the materials (except for cotton and sheep wool), being cost and density the parameters that influenced more the solutions. If globally optimized, 22 cm of hemp seemed the best solution, whereas 24 cm of cotton or wool are the best solutions for the economic point of view and 86 cm of corn is the solution with lower environmental impact, despite not representing a
feasible solution for the important thickness of the layer.
The results were influenced by the envelope configuration and climate condition, with a lower cost with the insulation in the core of the air gap. This difference was smaller in Porto Velho because the thermal gap between day and night is very low and prevents the activation of the thermal inertia of the envelope.
Bio-based materials can be an available alternative to conventional insulators, reducing the cost and the environmental impact. However, a deep analysis of the moisture behaviour in different climates should be done.
5 ACKNOWLEDGMENTS
The authors would like to acknowledge financial support from the Spanish Government (CTQ2016-77968-C3-1-P, 64117-C5-3-R, ENE2015-64117-C5-1-R, MINECO/FEDER, UE). The research leading to these results has received funding from the European Commission Seventh Framework Programme under grant agreement no. PIRSES-GA-2013-610692 (INNOSTORAGE). M.P. would like to thank the Brazilian Education Ministry for the financial support received under the PNPD/Capes fellowship.
6 REFERENCES
[1] L.F. Cabeza, C. Barreneche, L. Miró, J.M. Morera, E. Bartolí, A. Inés Fernández, Low carbon and low embodied energy materials in buildings: A review, Renew. Sustain. Energy Rev. 23 (2013) 536–542.
[2] R. Dylewski, J. Adamczyk, The environmental impacts of thermal insulation of buildings including the categories of damage: A Polish case study, J. Clean. Prod. 137 (2016) 878–887.
[3] C.-D. Li, M.-U. Saeed, N. Pan, Z.-F. Chen, T.-Z. Xu, Fabrication and characterization of low-cost and green vacuum insulation panels with fumed silica/rice husk ash hybrid core material, Mater. Des. 107 (2016) 440–449.
[4] T. Senga Kiessé, A. Ventura, H.M.G. van der Werf, B. Cazacliu, R. Idir, Andrianandraina, Introducing economic actors and their possibilities for action in LCA using sensitivity analysis: Application to hemp-based insulation products for building applications, J. Clean. Prod. (2016). [5] D. Iribarren, A. Marvuglia, P. Hild, M. Guiton, E.
Popovici, E. Benetto, Life cycle assessment and data envelopment analysis approach for the selection of building components according to their environmental impact efficiency: A case study for external walls, J. Clean. Prod. (2015).
[6] A.M. Papadopoulos, State of the art in thermal insulation materials and aims for future developments, Energy Build. 37 (2005) 77–86. [7] L. Magnier, F. Haghighat, Multiobjective optimization of building design using TRNSYS simulations, genetic algorithm, and Artificial Neural Network, Build. Environ. (2010).
[8] Trimble Navigation, 3D modeling for everyone | SketchUp, Trimble Navig. Ltd. (2016). https://www.sketchup.com/es (accessed January 27, 2017).
[9] Alliance for Sustainable Energy, OpenStudio | OpenStudio, (2016). https://www.openstudio.net/ (accessed January 27, 2017).
[10] Department of Energy USA, EnergyPlus | EnergyPlus, (2016). https://energyplus.net/ (accessed October 27, 2016).
[11] ISO, ISO 7730: Ergonomics of the thermal environment Analytical determination and interpretation of thermal comfort using calculation of the PMV and PPD indices and local thermal comfort criteria, Management. 3 (2005) 605–615.
[12] J. Carreras, D. Boer, G. Guillén-Gosálbez, L.F. Cabeza, M. Medrano, L. Jiménez, Multi-objective optimization of thermal modelled cubicles considering the total cost and life cycle environmental impact, Energy Build. 88 (2015) 335– 346.
[13] Ministerio de Fomento. Gobierno de España, Catálogo de elementos constructivos del CTE, 3 (2010) 141.
[14] http://itec.es/noubedec.e/bedec.aspx, (n.d.). [15] Materiaux naturels, (n.d.).
[16] Les matériaux verts, (2016).
[17] ÉlanÉco matériaux écologiques, (2016). [18] M. Palumbo, Contribution to the development of new bio-based thermal insulation materials made from vegetal pith and natural binders, Universitat Politècnica de Catalunya, 2015.
[19] J. Carreras, D. Boer, L.F. Cabeza, M. Medrano, L. Jiménez, G. Guillén-Gosálbez, Reducing the Life Cycle Environmental Impact of Buildings Following a Simulation-Optimization Approach, in: Adv. Energy Syst. Eng., Springer, 2017: pp. 823–839.