Do Modern Tools Utilized in the Design and Development of Modern Aircraft Counteract the Impact of Lost Intellectual Capital within the Aerospace Industry
by
W. Geoffrey Andrew
B.S. Mechanical Engineering, University of Massachusetts, 1981 Submitted to the System Design and Management Program
in Partial Fulfillment of the Requirements for the Degree of Master of Science in Engineering and Management
at the
Massachusetts Institute of Technology May 2001
© 2001 W. Geoffrey Andrew. All rights reserved.
The author hereby grants to MIT permission to reproduce and to distribute publicly paper and electronic copies of this thesis document in whole or in part.
Signature of Author_________________________________________________
System Design and Management Program May 2001 Certified by_______________________________________________________
Dr. Eric Rebentisch Research Associate, Center for Technology, Policy, and Industrial Development Thesis Supervisor Accepted by______________________________________________________
LFM/SDM Co-Director: Dr. Paul A. Lagace Professor of Aeronautics & Astronautics and Engineering Systems
Accepted by______________________________________________________ LFM/SDM Co-Director: Dr. Stephen C. Graves
Do Modern Tools Utilized in the Design and Development of Modern Aircraft Counteract the Impact of Lost Intellectual Capital within the Aerospace Industry
by
W. Geoffrey Andrew
Submitted to the System Design and Management Program in Partial Fulfillment of the Requirements for the Degree of
Master of Science in Engineering and Management
Abstract
Prior research has suggested that intellectual capital within the Aerospace Industry has been in decline. The new design aircraft experience base of Post WWIV Aerospace Engineers was approximately 6-12 new design aircraft per career. In contrast, an aerospace engineer starting his career today may experience only one, maybe two new aircraft designs during their career. Anecdotal evidence has been published linking this trend to problems experienced in many recent aircraft programs. Counter arguments cite rapid advances in design, manufacturing and information technologies used in the design and development process of today's new design aircraft have compensated for some or all of declining experience base. This thesis focuses on exploring the validity of this counter argument.
Program performance metrics were established and utilized to draw comparisons between programs. In addition, extensive interviews with personnel who played roles in these programs were conducted to that the root cause in areas of differing performance were understood.
Analysis of the data gathered revealed that the predecessor programs outperformed the more recent programs. Recommendations regarding ways to mitigate intellectual capital performance gap are presented.
Thesis Supervisor: Dr. Eric Rebentisch
Table of Contents
ABSTRACT ...2 TABLE OF CONTENTS...3 LIST OF FIGURES...5 TABLE OF CONTENTS...5 ACKNOWLEDGEMENTS ...6 1 INTRODUCTION...7 1.1 Problem Statement... 7 2 LITERATURE REVIEW ...7 3 METHODS ...103.1 New Design Aircraft Case Study ... 10
3.2 Data collection ... 11
3.3 Metrics ... 12
1.1.1 Aircraft Attribute Based Metrics ... 12
3.3.1.1 Weight Derived Metrics ... 12
3.3.1.2 Range ... 13
3.3.1.3 Altitude Performance ... 13
3.3.2 Design Maturity Metrics ... 14
3.3.2.1 Flight test hours to achieve Type Certification ... 14
3.3.2.2 Major Specification Changes ... 14
3.3.3 Program Performance Based Metrics... 15
3.3.3.1 Schedule Deviation ... 15
3.3.4 Intellectual Capital Metrics ... 16
3.4 Interviews... 16
4 CASE STUDY DATA ...18
4.1 Bush BA140 ... 18 4.1.1.1 Initial Plan ... 18 4.1.1.2 Prelude to BA140 ... 19 4.1.1.3 Program Structure ... 19 4.1.1.4 Intellectual Capital ... 20 4.1.1.5 Tools... 21 4.1.1.6 Type Certification ... 21
4.1.1.7 Post Certification Development Activity ... 22
4.1.1.8 IFR BA140 B and B+... 23
4.1.1.9 Subsequent Derivatives ... 23
4.1.2 Program Performance Metrics... 24
4.1.2.1 Weight Derived ... 24
4.1.2.3 Altitude... 25
4.1.2.4 Frequency of Major Specification Changes ... 25
4.1.2.5 Flight Test Hours to Obtain Type Certification... 25
4.2 Swamp SW-24 ... 26 4.2.1 Overview... 26 4.2.1.1 Initial Plan ... 26 4.2.1.2 Prelude to SW-24 ... 26 Program Structure ... 27 4.2.1.4 Intellectual Capital ... 29 4.2.1.5 Tools... 29 4.2.1.6 Type Certification ... 29
4.2.1.7 Post Certification Activity... 30
4.2.1.8 SW-24 MkIV... 31
4.2.1.9 Other Descendants... 32
4.2.2 Program Performance Metrics... 32
4.2.2.1 Weight Derived ... 32
4.2.2.2 Range ... 34
4.2.2.3 Altitude... 34
4.2.2.4 Frequency of Major Specification Changes ... 34
4.2.2.5 Program Schedule ... 35
4.2.2.6 Flight Test Hours to Obtain Type Certification... 35
4.3 M700 ... 36 4.3.1 General Overview ... 36 4.3.1.1 Prelude to M700 ... 36 4.3.1.2 Initial Plan ... 37 4.3.1.3 Program Structure ... 38 4.3.1.4 Intellectual Capital ... 39 4.3.1.5 Tools... 39 4.3.1.6 Type Certification ... 40
4.3.1.7 Post Certification Development ... 40
4.3.1.8 MARSH M700 -200... 41
4.3.2 Metrics ... 41
4.3.2.1 Weight Derived ... 41
4.3.2.2 Range ... 41
4.3.2.3 Altitude... 42
4.3.2.4 Frequency of Major Specification Changes ... 42
4.3.2.5 Schedule ... 42
4.3.2.6 Flight Test Hours to Obtain Type Certification... 43
4.3.2.7 Summary ... 44 4.4 SWAMP SW-40... 45 4.4.1 Overview... 45 4.4.1.1 Early History ... 45 4.4.1.2 Business Climate ... 46 4.4.1.3 Program Structure ... 47 4.4.1.4 Intellectual Capital ... 48 4.4.1.5 Tools... 50
4.4.1.6 Flight Testing and Development ... 51
4.4.2 Metrics ... 53
4.4.2.1 Weight Data ... 53
4.4.2.2 Range Performance ... 54
4.4.2.3 Altitude Performance ... 55
4.4.2.4 Schedule ... 56
4.4.2.5 Major Specification Changes ... 56
4.4.2.6 SW-40 Performance At Type Certification ... 58
5 RESULTS AND DISCUSSION ...60
5.1 Program Ranking ... 60
5.1.1 Metrics ... 60
5.1.2 Intellectual Capital ... 62
5.2 Intra-Era Comparisons ... 63
5.2.1 Disco Era; SW-24 and BA140 ... 63
5.2.2 MS Era; M700 and SW-40... 66
5.2.3 Disco Era vs. MS Era ... 66
5.2.4 Comparison of SW-24 and SW-40... 67
5.2.5 Discussion of Key Findings ... 77
6 BULLET SUMMARY...80
LIST OF REFERENCES ...82
List of Figures
Figure 2-1 RAND Study Depiction of declining intellectual capital in Aerospace Industry ... 8Figure 4-1: Annual Aircraft Deliveries / Bush Aircraft ... 18
Figure 4-2: Frequency of New Design Aircraft Introductions / Bush Aircraft ... 20
Figure 4-3: Annual Aircraft Deliveries / Swamp Aircraft... 27
Figure 4-4: Frequency of New Aircraft Introductions / Swamp ... 28
Figure 4-5: Aircraft Deliveries / Marsh Aircraft ... 36
Figure 4-6: Frequency of New Design Aircraft Introductions / Marsh Aircraft ... 38
Figure 4-7: Annual Aircraft Deliveries / Swamp Aircraft... 47
Figure 4-8: Frequency of New Design Aircraft Introductions ... 49
Figure 4-9: SW-40 / We Status During Design and Development... 53
Figure 5-1: Frequency of New Aircraft Introductions / All ... 62
Figure 5-2: Comparison / New Design Aircraft Introduction Decay Rates ... 63
Figure 5-3: Swamp SW-24 and SW-40 Weight Growth Profiles ... 68
Figure 5-4: SW-40 / Official Program Empty Weight History During Design & Development ... 70
Figure 5-5: Weight Empty Variance from Initial Specification versus Percentile Ranking for DoD Aircraft of the Same Type ... 71
Figure 5-6: SW-40 Empty Weight History Referenced to Initial Spec Value ... 72
Figure 5-7: PVP Illustration ... 83
List of Tables Table 1: Summary of Applicable Major Specification Changes... 15
Table 2: Bush BA140 / Metric Variance Summary ... 22
Table 4: SW-24 Metric Variance Summary... 30
Table 7 provides a summary of the performance metrics at the M700s initial VFR type certification... 44
Table 8: MARSH M700 Metric Variance Summary ... 44
Table 9: SW-40 Metric Variance Summary... 58
Acknowledgements
First I would like to thank my thesis advisor, Dr. Eric Rebentisch, for assisting me getting started and completing this work. I am hopeful that the data collected will useful to the Lean Aerospace Initiative.
I would like to thank my work colleagues for being patient and understanding of my situation when I would pick up and go off to classes in the middle the days fire drill.
Thanks to my school colleagues, who without their help, I would not have been able to complete this program.
Most of all I wish to thank my wife, Nancy and my two sons, Sean and Brendan for tolerating my absences and lack of participation in family activities during the past 2 1/2 years. I know that working it was extremely difficult at times. I promise I will never do this again.
1 Introduction
1.1 Problem Statement
Prior research has suggested that intellectual capital (IC) within the Aerospace Industry has been in decline. The new design aircraft experience base of Post WWIV Aerospace Engineers was approximately 6-12 new design aircraft per career. In contrast, an aerospace engineer starting his career today may experience only one, maybe two new aircraft designs during their career. Anecdotal evidence has been published linking this trend to problems experienced in many recent aircraft programs. Counter arguments cite rapid advances in design, manufacturing and information technologies used in the design and development process of today's new design aircraft have compensated for some or all of declining experience base. This thesis focuses on providing an explicit link between declining intellectual capital and program performance by extracting quantitative data on the performance of new design civil aircraft programs which have recently with aircraft programs which were executed 20 to 25 years prior. By the nature of the approach taken, the validity of the popular counter argument is explored.
2 Literature
Review
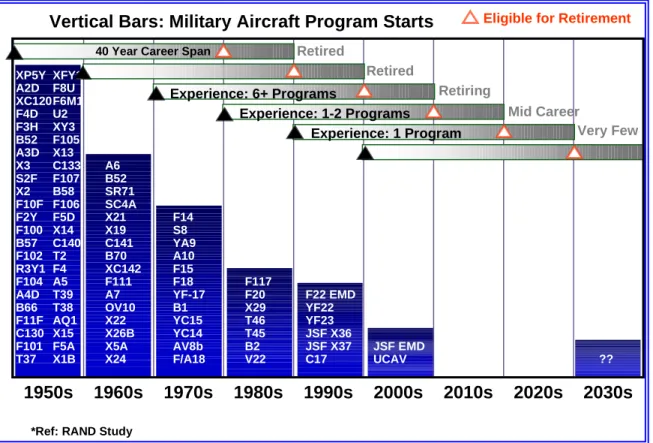
To a great extent, this research is a response to a RAND study published in 1992 titled; Maintaining Future Military Design Capability (ref 1). This report examined historical trends in the aerospace industry and their projected impact on the ability of the United States to design and develop aircraft weapons systems. The most striking trend was the declining rate at which new design aircraft are developed. Figure 2-1 is a modified version of the chart published in this report used to characterize this phenomena. As can be seen, the decline with respect to the 1950's has been dramatic. Overlayed horizontal bars are used to represent the typical career of an aerospace engineer or designer. The point was further made that as the frequency of new aircraft design introductions drops, so does the average number of aircraft programs an aerospace
employee will interact with during their career. Currently, this number is down to one for persons entering this industry within the past decade or in the foreseeable future. The authors further write, “We believe that a declining experience level has been a contributing factor to the problems we observe in many recent aircraft programs.” The aircraft programs cited are the T-46, B-1B, P-7 and A-12 programs. It is not stated how this conclusion was arrived at since no details are provided which directly link the performance issues of these programs to this declining experience base. It is however, an easy concept to accept from a common sense standpoint. And, judging by the frequency that this chart and quote is cited in other publications, it has been widely accepted.
Figure 2-1 RAND Study Depiction of declining intellectual capital in Aerospace Industry
The RAND study also surfaces the most popular counter argument raised when discussions of declining intellectual capital occur, modern computational tools. In some respects, a form of codified knowledge. "Some have suggested that the application of large-scale computer simulation to the design process will mitigate the need for
“We Believe That a Declining Experience Level Has Been a Contributing Factor to the Problems We Observe in Many Recent Aircraft Programs.”
RAND
*Ref: RAND Study
Vertical Bars: Military Aircraft Program Starts
1950s 1960s 1970s 1980s 1990s 2000s 2010s 2030s XP5Y A2D XC120 F4D F3H B52 A3D X3 S2F X2 F10F F2Y F100 B57 F102 R3Y1 F104 A4D B66 F11F C130 F101 T37 XFY1 F8U F6M1 U2 XY3 F105 X13 C133 F107 B58 F106 F5D X14 C140 T2 F4 A5 T39 T38 AQ1 X15 F5A X1B A6 B52 SR71 SC4A X21 X19 C141 B70 XC142 F111 A7 OV10 X22 X26B X5A X24 F14 S8 YA9 A10 F15 F18 YF-17 B1 YC15 YC14 AV8b F/A18 F117 F20 X29 T46 T45 B2 V22 F22 EMD YF22 YF23 JSF X36 JSF X37 C17 JSF EMD UCAV 2020s 40 Year Career Span
?? Eligible for Retirement
Retired Retired Experience: 6+ Programs Experience: 1-2 Programs Experience: 1 Program Retiring Mid Career Very Few
experienced designers. While simulation and automation of the design process will certainly help, it cannot substitute for the intuition and inspiration that contribute to successful new and innovative designs. Furthermore, such automation is only marginally effective when dealing with new and untried technologies because the basic information needed for the computational algorithms is missing or of low fidelity." (ref.1) As with the prior theory, this is a rational conclusion that is easy to swallow, but is not explicitly proven in this work. Several engineering managers from within the aerospace industry which were queried about this conclusion exhibited mixed reactions. One hand they have been spending unprecedented amounts of money each year to secure the latest computational tools. On the other hand, they were not exactly sure of how effective these tools at mitigating lost intellectual capital.
This is not a unique phenomena to aerospace, other industries are wrestling with intellectual capital issues. Shawn Ritchie (ref.2) discusses such issues with regards to the photo processing equipment industry. " Eastman Kodak has seen a slow eroding of the tacit dimension (knowledge) over the past few decades. One reason for this is the aging of the personnel base. In the past, the younger employees would be assigned to work side by side with the more experienced workers, establishing a mentor-protégé relationship. This relationship led to a slow, thorough transfer of tacit and explicit knowledge. In recent years, employees have been let go or encouraged to retire early without any emphasis on tacit knowledge transfer. Managers expect new workers to come in trained or to quickly pick things up on the job after a few shifts and cursory reading of operations manuals. Why? One theory is that companies do not know what they are missing anything and simply have no way to quantify "lost opportunity." They do not know the opportunity cost or value of information not transferred."
As with the RAND study, Ritchie's work does not explicitly demonstrate that knowledge transfer has in fact eroded Kodak's ability to perform faster than other imrrovements such as computational tools have enhanced it.
Articles published in aerospace industry periodicals discuss "brain drain" and various steps some of the major prime contractors such as Northrup Grumman are taking to attack this problem. Again, no articles or research was discovered which explicitly linkd declining IC with declining performance. Taking advantage of this lack of prior attention, this thesis is on filling this void.
3 Methods
3.1 New Design Aircraft Case Study
Case study of four new design civil aircraft programs. New design referring to "clean sheet" designs which do not significantly leverage a predecessor aircraft design in the design, development and certification process. Two of the aircraft programs were executed nearly simultaneously in the late 1970's and will be referred to as the "disco era" programs. The seceding pair were executed during the mid to late 1990's and will be referred to as the "Microsoft (MS) era" programs. Additional details of these programs and their associated aerospace manufacturers will be provided in subsequent sections.
Several criteria utilized in selecting these case studies which can be divided into subsets, similarity criteria and dissimilarity criteria. All of the programs share the following characteristics:
• New design Civil Aircraft certified to the same general Federal Airworthiness
Regulations (FAR's).
• Developed Using Company funds
• Developed to meet similar performance and market requirements
• Certified to the same FAR regulations
• Companies have long and rich aviation legacy (didn't start yesterday)
• Have significant US Military business and are to some extent categorized as
The "disco era" programs share the following:
• Same period of execution
• Competing head to head in the same market
• High workforce new design aircraft experience base
• Predominantly Paper & Mylar design tools
• Functional Organization with "heavy weight" project managers
The "MS era" programs share the following:
• Overlapping periods of execution
• Overlapping market segments
• Extensive use of computer aided design tools and information technologies
• Use of IPDT's
The subsequent list highlights the dissimilarities between the disco and MS era programs:
• Organic IC significantly lower for MS era programs than preceding disco era
programs
• Use of computer aided design tools significantly greater for MS era programs
Various means of comparison, discussed further in subsequent sections, will be utilized to develop an understanding as to the relationship between the performance of these programs and disco/MS set of dissimilarities.
3.2 Data collection
Case study data was collected from a variety of sources, official program documents, industry publications and interviews of participants. These multiple sources of data were used to cross validate the data. While it was desired to have comparable data depth between all programs there are some variables. Identifying and accessing participants
was more difficult for the disco era programs as they occurred twenty plus years ago. The majority of the participants have since retired or worse. Since, most internal documentation is discarded within a few short years of completion, this proved challenging for both the disco and MS era programs. However, in two of the cases, excellent internal documents were obtained from hard core "pack rats".
Aviation Industry publications such as Jane's, All the World's Aircraft, Air & Cosmos, Aviation World as well as many others, were used to gathering information regarding the subject case study aircraft program. In total, hundreds of articles were reviewed for each aircraft program. Jane's, All the World's Aircraft was particularly useful in gathering aircraft performance attribute data.
3.3 Metrics
Four types of metrics were employed , aircraft attribute based metrics, design maturity metrics, program performance metrics and intellectual capital metrics.
3.3.1 Aircraft Attribute Based Metrics
Traditional aircraft attributes, tracked closely internally, advertised and sometime guaranteed to prospective customers are utilized as metrics. These metrics, summarized below, are referenced the original specification values released at the launch of the program. To aid in direct comparisons of the four programs, the metrics are expressed in terms of percentage with respect to the reference value.
o Empty Weight
o Useful Load / Payload
o Maximum Takeoff Weight
o Range
o Altitude Performance
3.3.1.1 Weight Derived Metrics
In military and some civil aircraft procurement competitions, often, the ability to retard weight growth during design and development is the discriminator between the winning
and loosing team. Further, there are many documented cases of programs cancelled due to burgeoning weight. In the more modest situations, empty weight exceeding the aircraft's specification displaces either payload or fuel. In other words, if the empty weight of an aircraft is 150 lb. over specification, a passenger, 150 lb. of baggage, cargo or fuel (25 gal.) must be left behind. The payload deficit can be closed by increasing the maximum take off gross weight by 150 lb., possibly requiring an uprated powerplant which may not exist, or would require the redesign of some aircraft systems, further escalating the weight growth. This is an insidious feed-forward loop that every aircraft manufacturer has experienced at one time or another.
The aircraft will primarily be judged with respect to each other, however for the weight based metrics supplemental manufacturer weight control performance data was compiled for similar type aircraft the Society of Allied Weight Engineers (SAWE) publications.
3.3.1.2 Range
Range is a universal metric for all commercial and military aircraft. For the purposes of these comparisons, the maximum range with a full passenger load and standard reserves is used to reflect the criteria of a commercial customer. In specifying a full passenger load and not a maximum gross weight ensures that adverse weight growth impacts the allowable fuel load and in turn the range. The essential comparison will be the specified range at the outset of the program versus its range upon receiving its type certificate.
3.3.1.3 Altitude Performance
The ability to take off from a field under hot day and/or high altitude conditions (aka: "hot/high") where the air density is low and the power margins lower is also a universal metric. This capability is important to a customer as it is directly related the safety of an aircraft. Normally expressed in terms of standard day altitude in feet or meters, it will be expressed in terms of percent deviation for the initial specification for the purposes of this comparison. For instance, if the initial specification for an aircraft stated that its
takeoff capability at maximum gross weight to be 10,000 ft, and at type certification it was verified to be 12,000 ft. It capability would be + 20%.
3.3.2 Design Maturity Metrics
3.3.2.1 Flight test hours to achieve Type Certification
For a new design aircraft, the number of flight test hours to achieve flight type certification is a measure as to the maturity of the design going in to flight test. The actual type certification flight testing is not a great variable but the amount of flight testing required to get the aircraft to a certifiable configuration. For example, it could require several hundred flight testing hours to get the handling qualities of an aircraft to the point where it will comply with the airworthiness requirements. A common scenario would be for a set of flight test to be repeated many times with changes to the flight control software, tail planform area, strake configuration etc. until the correct combination is found. I contrast, a new design which has undergone a more effective design and risk reduction process, whether it be attributed to superior tools, personnel of more risk reduction testing, will converge on the certifiable configuration with less flight testing hours. This is compounded by the number of systems that are subject to certification of other functional requirements.
No universal benchmark has been established for this metric. However, since all aircraft are similar in terms of type, complexity and applicable FAR's, the values can be compared directly.
3.3.2.2 Major Specification Changes
This metric is intended to gauge the quality of the product development process. If perfect, the aircraft configuration which achieve type certification would be identical to the aircraft defined by the initial design trade studies and detail design efforts. This captures inadequacies in a design which are not reflected by the aircraft attributes. For instance; consider an aircraft under development whose range specification is 3000 nm. If during it’s the development the engines specific fuel consumption is recognized to be
10% greater than anticipated, the manufacturer is likely in one of two manners. He could reduce the specified range to by 300 nm. if he feels that it would not hurt the salability of the aircraft. Alternatively, he could revise the design to recover the lost range by increasing the fuel capacity or another alternatives. Either scenario would be counted as a specification change. The intent is to pick up high impact changes which cause significant redesign efforts or reduction in the aircraft's advertised capabilities or compliance with airworthiness regulations. Changing the gauge of a skin panel, or altering the seat pitch would not qualify as a major change. This criteria is fairly consistent with the fidelity of information contained in trade publication.
Of the subject aircraft examined only the nine spec change categories resulted. These are summarized in Table
Table 1: Summary of Applicable Major Specification Changes
1. Maximum Takeoff Gross Weight 2. Useful Load
3. Range
4. Fuel Capacity increases of >5%
5. Significant Reduction or migration of the Center of Gravity Range 6. Key Aircraft configuration dimensions including the fuselage,
empennage and lifting surface (including airfoil sections) 7. Propulsion / Drive system rating increase
8. Altitude Take off Performance 9. Any Major Sub-System Redesign
3.3.3 Program Performance Based Metrics
3.3.3.1 Schedule Deviation
All aircraft development programs have a schedule as to when critical milestones are to be achieved. The aircraft models date of; first flight, type certification and first aircraft delivery will be used as benchmarks. The performance metric will be deviation between the initial dates and the date that they are actually achieved.
3.3.4 Intellectual Capital Metrics
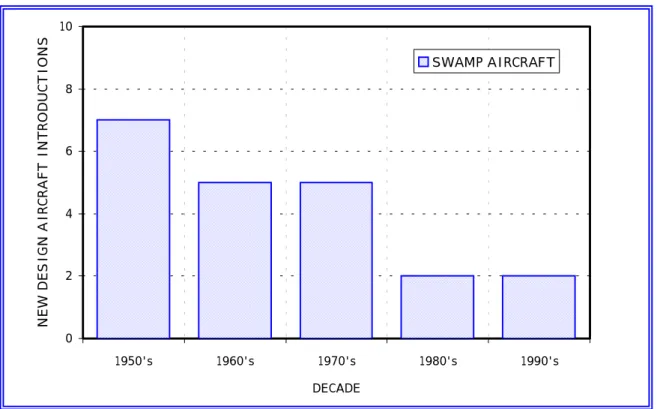
Two very simple the intellectual capital metrics were established for each manufacturer and used for comparison purposes. The first is the frequency of new design aircraft introduction in the decade preceeding the program launch of a aircraft considered. This is a measure of the intellectual capital accrued by the design team functional leads and workforce at task level. The second is nearly the same as the first but considers the number of new design aircraft introduced in the prior two decades. This is an indicator of the experience level of the middle level managers, senior technical staff and program management. These metrics were influenced by the RAND experience decay plot in Figure 2-1
3.4 Interviews
Interviews of key participants of the subject programs were conducted to gain better insight into events and specific performance issues. In all, thirty participants were interviewed. Ten of the interviewees were directly involved with programs from both eras. The interviewees were told that all of the information would be disguised prior to publication.
Interviews followed and informal structure, usually opening with a general overview of the thesis problem statement and the case study method selected to study the issues. From there "lay of the land" type questions framed from a historical perspective were used to get the dialogue launched. All of the interviewees were comfortable providing information, and seemed to feel it was important to contribute to an understanding of performance issues. The interviewer took a neutral posture during the interview so as not to lead the interviewee in any particular direction.
Performance metrics, were used to steer the interview to specific areas of discussion. Follow-up questions were used to fill in information voids and for clarification of remarks. When specific documents were referenced during the interview, the interviewer would be "do you still have a copy of that memo, document etc" Often times the interviewee
would dig through their files to find relevant documents without being prompted. About two thirds of the interviews produced copies of original documents with information pertinent to one or more of the case studies.
Cross interview triangulation was used as a method to gain an alternative perspective on a event or to verify information obtained. This was particularly helpful in sorting out old documents with conflicting information.
Interviews were recorded with hand written notes. These notes, being typically somewhat cryptic were reviewed within one hour of the completion of the interview and additional notes added to help improve the post-interview recall. When needed, follow up questions and clarifications were pursued by email. Handfuls of interviews were conducted by email correspondence only due to geographic constraints.
4 CASE STUDY DATA
4.1 Bush BA140
4.1.1.1 Initial Plan
The Bush BA140 program was officially launched in early 1974. It was preceded by a series off marketing and configuration studies that culminated with the construction of a full scale aircraft mock-up. The mock-up was brought to air shows and industry conventions to get further feedback from potential oil exploration and business customers. The BA140 was aimed at the same market as the SW-24, also featured as a cases study program. The aircraft was well received and Bush had no difficulty taking orders for the aircraft.
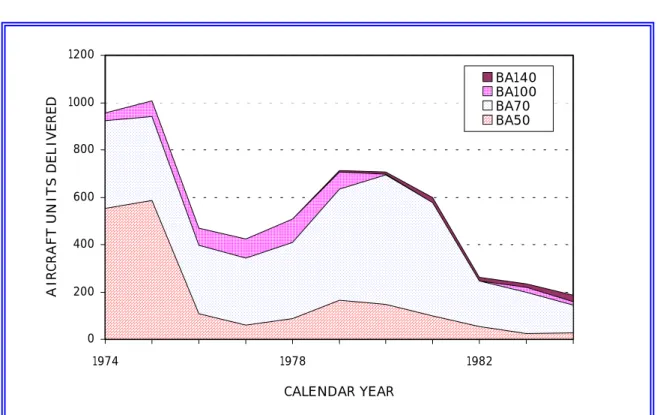
Figure 4-1: Annual Aircraft Deliveries / Bush Aircraft
0 200 400 600 800 1000 1200 1974 1978 1982 CALENDAR YEAR
AIRCRAFT UNITS DELIVERED
BA140 BA100 BA70 BA50
4.1.1.2 Prelude to BA140
Prior to embarking on the BA140 program, Bush was delivering over 30 civil aircraft per month and a somewhat higher number of military aircraft per month. About this timeframe, DoD deliveries of the BA50, BA70 and BA100 series models were dropping as DoD was in the process of fostering contracts for the development of a new generation of replacements for the aircraft (ref. Figure 4-1). Bush competed for these new contracts but lion's shares of these contracts were awarded to competitors. Bush did capture a significant military aircraft upgrade program and a NASA X-plane program, which were in progress during this timeframe.
The BA140 would be the first new design aircraft since the B70, 14 years previous. Bush also launched the BA130 and BA150 development and certification programs. These were improved civil version of the BA60/70 models. These announcements succeeded the BA140 model's initial Type Certification. However, according to one of the sources interviewed, there was a significant amount of overlap between these programs.
4.1.1.3 Program Structure
Heavy weight project team best describes the structure of the BA140 program. The entire team was located in a separate building across town from the main facilities. The engineering leads reported to, and were rated by the program management staff. Reportedly, this was a controversial arrangement at the time, fueling much discussion and concern regarding to use of "best practices" by the engineers, now isolated from the functional organizations.
Ex-Bush employees queried, regarded the BA140 team was "top notch". Its program director, project engineers and much of the functional engineering staff highly experienced with aircraft development, having worked on a variety of military and civil programs during their tenures. The number of military and civil models (including
derivatives), developed in the prior decade, Bush's production and R&D activity certainly supports this characterization. This is discussed further in the subsequent section.
4.1.1.4 Intellectual Capital
During the timeframe of the BA140 development, Bush employed 10,000 approximately workers of which 14% were represented by the engineering and design disciplines (ref. 5). For a period of at least ten years prior to the BA140 program, Bush has a steady diet of production contracts and a few research contracts. Its work force was relatively stable during this time period, not experiencing any significant downsizing until 1980's. Many Bush many employees migrated to competitors that had captured the large long-term military contracts that eluded Bush. This was subsequent to the launch and certification of the BA140.
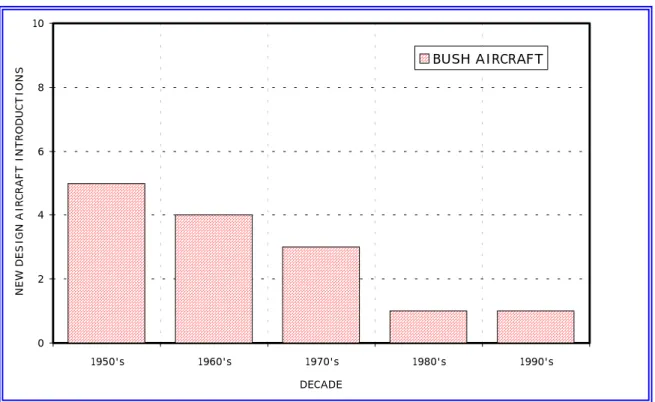
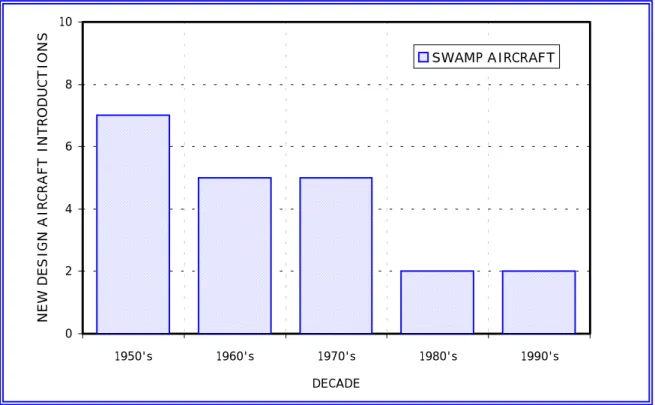
Figure 4-2: Frequency of New Design Aircraft Introductions / Bush Aircraft
0 2 4 6 8 10 1950's 1960's 1970's 1980's 1990's DECADE
NEW DESIGN AIRCRAFT INTRODUCTION
According to sources interviewed, about 65% percent of its BA140's technical workforce had made significant contribution to experience in the design and development of three or more derivative or and experimental research aircraft prior to the BA140 program. Figure 4-2 presents a summary of the frequency of fielding new aircraft designs for Bush. While not clear from this chart, the last bona fide new design production aircraft, the B70, preceded the BA140 by 10 years. However, during this duration, Bush continued to develop advanced wing, propulsion and material technologies through US government funded research programs as well as self-funded research. New technology was gradually introduced into existing aircraft models as in-line improvements and numerous new / derivative models. In short, there existed ample opportunities for the BA140 team to accrue significant amount of derivative aircraft experience as well as a more modest amount of new aircraft experience.
4.1.1.5 Tools
This program predated the era of Computer Aided Design (CAD). The majority of the design work was done on the traditional ink on Mylar medium. Mainframe based aero, aeroelastic and flight simulation computer codes were used. Structural analyses relied on early, mainframe versions of NASTRAN, indigenous aircraft loads prediction codes coupled with an equivalent amount of traditional paper and pencil hand analyses. Slide Rules were used commonly but were starting to be displaced with hand held and desk-top calculators. Mainframe computers were also employed for program management functions.
4.1.1.6 Type Certification
The BA140 received its VFR type certification 11 months later than the original target date. At the time of certification, a backlog of over 100 aircraft had been accrued. This number doubled within the next year.
VFR Type certification experienced further delays and the schedule variance increased to 17 months by the time IFR type certification was achieved.
Table 2 provides a summary of the performance metrics at type certification.
Table 2: Bush BA140 / Metric Variance Summary
Metric Deviation We +21% Useful Load +14% Payload +16% MTOGW +18% Range -30% Fuel +12% HOGE -36% HIGE -21%
First Flight +8 mo.
Type Certification (VFR) +11 mo.
Type Certification (IFR) +17 mo.
Initial Delivery +10 mo.
Major Spec Changes 9
4.1.1.7 Post Certification Development Activity
The BA140 introduced in to service through an official "launch customer", standard procedure for the aircraft industry during this timeframe. The BA140 launch customers experienced its share of new aircraft teething problems. Reliability of the aircraft subsystems and main wing fatigue concerns reduced the availability and increased the operating cost of the aircraft. To address these problems, initially, Bush made sure that sufficient spares and dedicated field representatives were available to the BA140's
launch customers . This was followed up with the introduction of field retrofit kits of redesigned components. While this was not a desirable situation, it is fairly typical situation for a new aircraft's introduction in to service.
More serious was the aircraft's performance shortfalls in payload and range which limited the productivity of the aircraft for many of the operators. In addition, the BA140 experienced delays in achieving its IFR certification, further reducing its productivity for operations that required this capability.
4.1.1.8 IFR BA140 B and B+
To address the shortcomings of the initial BA140, Bush followed up quickly with an improved and IFR certified BA140B model. The first BA140B was delivered in August 1982. It featured more powerful engines (+8%) and uprated drive system, a 30% increase in fuel capacity and a 5 % increase in maximum take-off gross weight. The majority of the BA140A models were upgraded to the BA140B configuration.
In less than one year, Bush was offering a further improved version, the BA140B+. It featured a further 18% increased fuel capacity, additional seating and a reduced empty weight. It was adopted as the standard production configuration. These changes were aimed at further improving the payload / range performance of the aircraft, which had yet to achieve the original performance claims.
Unfortunately, poor engine reliability and performance continued burden the operators and mar the aircraft's reputation. Aircraft sales of the BA140 at this point in time were well below the early projections.
4.1.1.9 Subsequent Derivatives
Subsequent to BA140B+, three additional derivative models of the BA140 have been offered by Bush, the BA140SP, B160 and the B190. Each successive version featured increased power takeoff gross weight and range and superceded its predecessor as the
base production model.The B190, Bush's current offering also features a moderate cabin stretch, FADEC equipped engines and a glass cockpit. Despite Bush's support of this model, sales have yet to reach the potential predicted at the outset of the BA140 program.
4.1.2 Program Performance Metrics
4.1.2.1 Weight Derived
The constant growth of the BA140's weight empty and maximum takeoff gross weight during the development program indicate that the program had difficulty with weigh control. Four published maximum takeoff gross weights were found in a variety of publications prior to receiving its initial VFR type certification. A fifth followed as the aircraft received IFR certification. Clearly, the increments were aimed at delivering an acceptable payload for its customers. The weight metric data is extracted from Jane's All the Worlds Aircraft (ref.4).
4.1.2.2 Range
The BA140 suffered a continuous decline in range performance throughout its development. Even at the outset of the program, a full fuel load plus full passengers was only possible with the lightweight passengers with no baggage. This could have been a requirements oversight as the spec FAA passenger is 170 lb., much lighter than the typical passenger who would fly in this aircraft is.
As its weight grew, the fuel system was enlarged to recover lost range. Two auxiliary fuel tank arrangements were developed for customers who were willing to trade some payload for range. By the time the aircraft reached certification, its range capability was 30% lower than the initial target specification. This shortfall excluded it from certain markets. The initial two derivative models, the BA140B and BA140B+ featured
increased fuel capacities of 30% and 48% respectively, a validation of the range shortfall conclusion.
4.1.2.3 Altitude
The altitude performance for the BA140 at Type Certification fell 36% short of the original specification. The aircraft could exceed the original specification at the original spec gross weight though. Again pointing the finger at excess weight gain during design and development.
This capability was improved upon with the BA140B model, which featured increased engine and drive system ratings. As stated in the prior section, most BA140A models were upgraded to this configuration.
4.1.2.4 Frequency of Major Specification Changes
Ten major specifications changes were gleaned from various aviation industry references. Four of the nine changes are attributed to increases to the maximum takeoff gross weight of the aircraft which occurred in increments of 3%, 7.5%, 6.3%, and 2.6% respectively for a cumulative total of 17.2% over the original design specification. Three are attributed to engine and or drive system takeoff rating increases and one to a fuel tankage redesign which yielded a 15% increase in capacity. Early in the flight test program, the horizontal tail was move forward significantly. And lastly, a redesign of the main wing, increasing it's span by 2% and chord by 8% for an area increase of 10%.
4.1.2.5 Flight Test Hours to Obtain Type Certification
According to data published in trade publications, three thousand flight hours were accrued on BA140 flight test aircraft in order to gain its VFR Type Certificate. Due to the lack of published data, it was not possible to construct a creditable estimate of the incremental flight testing hours required to achieve its IFR type certification.
4.2 Swamp SW-24
4.2.1 Overview
4.2.1.1 Initial Plan
Swamp announcement of SW-24 program occurred early in the year 1975. This was followed by a study phase during which time market research, competitive benchmarking and launch customers were sought. The SW-24 featured the latest technology used in the SW-18 to achieve maximum performance and to reduce risk. Program launch with the backing of Swamp's parent corporation occurred about one year after the program was announced. The initial press releases at this time cited mid 1976 for with FAA certification and initial deliveries in late 1977 followed by rate production in 1978 (ref. 4). A launch customer was signed on for the initial ten aircraft shortly after to the launch announcement.
4.2.1.2 Prelude to SW-24
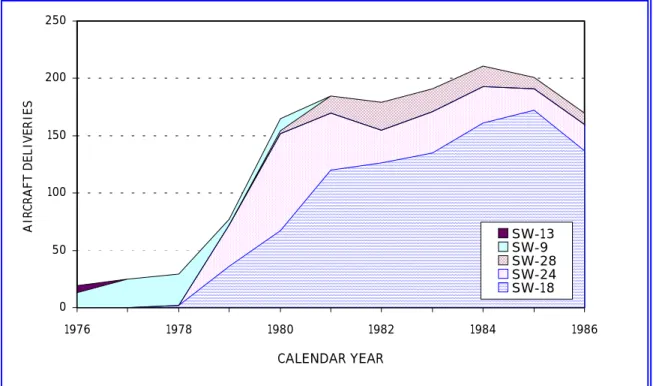
During the mid-1970's, Swamp was delivering new SW-9, SW-12 and the SW-13 model aircraft at rates of 20-40 per year along with 10-20 upgraded SW-9's. An all time low point in Swamp's history according to those interviewed. Figure 4-3 provides a summary of Swamp's production deliveries from this low point forward, compiled from internal records.
Prior to embarking on the SW-24 program, Swamp was fully involved in the later phases of the NUAC (New Utility Aircraft) program competition with Big Valley Aircraft. The SW-18 prototype's first flight had preceded the SW-24 program announcement by 3 months. Although Swamp would be awarded this contract twenty-three months later, uphill battles to solve design problems, and a "winner takes all" fly-off competition lay ahead. In short, there was much uncertainty in Swamp's future.
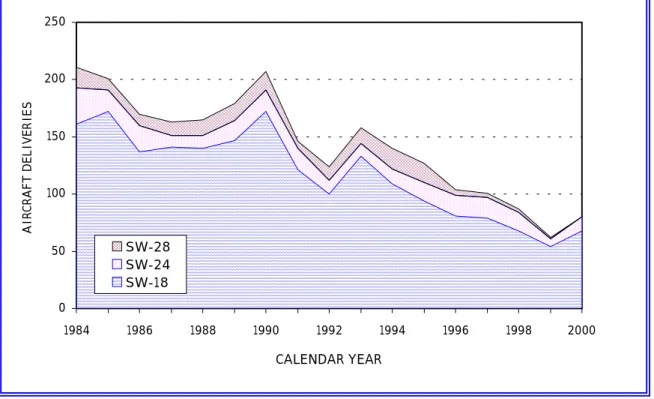
Figure 4-3: Annual Aircraft Deliveries / Swamp Aircraft
4.2.1.3 Program Structure
A heavy weight project team, staffed with functional engineering organization leads best describes the structure of the SW-24 program. The functional leads were responsible for making sure that the project tasks were supported by the functional organizations. The program manager and chief of design were highly experienced and previously held equivalent positions on the NUAC program. The functional organization leads, were hand picked by the chief of design according to their experience. The majorities were fresh off the NUAC program.
The program was also staffed with dedicated administrators and finance personnel to help with project management tasks.
0 50 100 150 200 250 1976 1978 1980 1982 1984 1986 CALENDAR YEAR AIRCRAFT DELIVERIES SW-13 SW-9 SW-28 SW-24 SW-18
In order to segregate the SW-24 activities from that of other government funded activities, the majority of the SW-24 team was located in a separate facility in an adjacent town. According to interviews, this was vital to the programs success as the main facility was experiencing many difficulties in their effort to prepare for SW-18 rate production. Production rates not experienced for many years and a ten fold increase over the current aircraft production rate.
Figure 4-4: Frequency of New Aircraft Introductions / Swamp
This is captured in part by Figure 4-3 which chronicles aircraft deliveries for the period just subsequent to the awarded of the NUAC contract and type certification of the SW-24. To the left side of this chart, one can see the rapid rate of increase for deliveries of both the NUAC and SW-24. According to one of the sources interviewed, "The main plant was in turmoil trying to ramp up for NUAC production. Any available body in main plant ended to be commandeered to work on the NUAC program. Therefore, it was recognized in the early phases of the program that an off site facility was imperative for the programs success."
0 2 4 6 8 10 1950's 1960's 1970's 1980's 1990's DECADE
NEW DESIGN AIRCRAFT INTRODUCTIONS
4.2.1.4 Intellectual Capital
The program manager and chief of design were highly experienced and previously held equivalent positions on the NUAC program. In addition, the majority of the functional organization leads had 15-20 years experience and had contributed to design and development of three to six other "clean sheet of paper" aircraft according to sources interviewed. . This information seems realistic when compared the number of new designs fielded by Swamp in the preceding decades, presented in Figure 4-4. The functional organization leads, according to one of the participants interviewed, were hand picked by the "chief of design" "as a prerequisite to his acceptance of this position. accepting the assignment as chief of design, Al Albert insisted that he must be able to hand pick his team." As such, the team of functional engineering leads consisted of the most experienced engineers, many of that were fresh off the NUAC program or one of the other development programs.
4.2.1.5 Tools
This program predated the era of Computer Aided Design (CAD). The majority of the design work was done on the traditional ink on Mylar medium. Mainframe based aero, aero-elastic and flight simulation computer codes were used extensively, and complimented with 1/10 scale,1/5 scale, and full scale subsystem wind tunnel testing. Structural analyses relied on early, mainframe versions of NASTRAN, indigenous aircraft loads prediction codes coupled with an equivalent amount of traditional paper and pencil hand analyses. Slide Rules were used commonly but were starting to be displaced with hand held and desk-top calculators. Mainframe computers were also employed to track the program budgets.
4.2.1.6 Type Certification
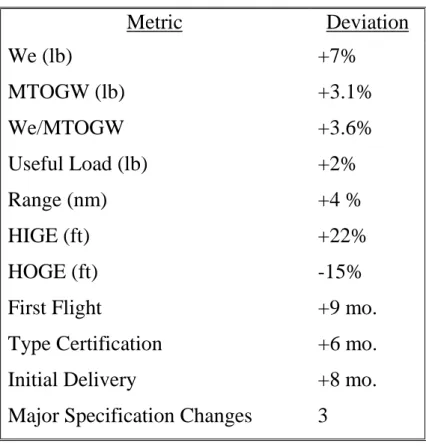
The SW-24 program was swiftly executed with type certification occurring within 6 months of the original target date. At the time of certification, a backlog of over 200 aircraft had been accrued. This number doubled within the next year. Table 3 provides a
summary of the performance metrics at type certification. These metrics are discussed further in subsequent sections.
Table 3: SW-24 Metric Variance Summary
Metric
Deviation
We (lb)
+7%
MTOGW (lb)
+3.1%
We/MTOGW
+3.6%
Useful Load (lb)
+2%
Range (nm)
+4 %
HIGE (ft)
+22%
HOGE (ft)
-15%
First Flight
+9 mo.
Type Certification
+6 mo.
Initial Delivery
+8 mo.
Major Specification Changes
3
4.2.1.7 Post Certification Activity
While the program had been executed successfully from a many technical and business perspectives, the initial SW-24 production models its share of teething problems. In the initial two years many reliability issues arose, of which some had Airworthiness Directives (AD) issued against, often requiring inconvenient special inspections and unscheduled maintenance. The engines were experiencing a high rate of in-flight shutdowns and were not providing adequate power margins for some operations.
In addition, the UK SW-24 operators had range issues due to additional equipment required by the CAA for over-water operations. This required them to reduce their passenger counts.
Customers exerted pressure on Swamp to resolve these issues. Swamp responded by putting together a special task force comprised of engineering and customer service personnel. The team's charter was to identify the root cause of the field problems and to implement corrective actions swiftly. Initially, the availability was dramatically improved by providing stocks of critical spare parts to operators on consignment and dedicated on-site field representatives. Introduction of field retrofit kits, which included redesigned components, followed. The weights of the aircraft escalated as these changes were incorporated.
This team stayed in place for two years before it was disbanded. At least one of the sources interviewed was of the opinion that this effort demonstrated the companies commitment to the customers and likely saved the program from an early demise.
4.2.1.8 SW-24 MkIV
The introduction of the SW-24A Mark IV, a mature and more reliable SW-24 occurred in early 1982. It incorporating 44 improvements over its predecessors including a 5% increase in engine power, and increased payload achieved by increasing the maximum gross weight 3%. Mark IV retrofit kits and made available to operators at no cost. Nearly all early SW-24A's are retrofitted to the Mark IV configuration.
Despite this progress, the aircraft's reputation continued to be marred by engine problems including engine bursts. The resolution of this issue eventually spawned the other SW-24 models discussed in the subsequent section.
1 An Airworthiness Directive or AD is an order issued by the Federal Aviation Administration which mandates that
4.2.1.9 Other Descendants
Engine problems experienced with the SW-24 force renewed interest in a re-engined version of the SW-24 designated the SW-24B. It featured 50% greater engine power margins for hot climates and high altitude operations as well as 15% in the drive system power rating. The SW-24B program was announced in 1984 and the received its Type Certification in 1987. The aircraft gained popularity with the Emergency Medical Services (EMS) and executive transport market segments.
Several other SW-24 derivatives, also characterized as re-engined versions followed the SW-24B. The SW-24A+ was a re-engined version of the SW-24A. This engine retrofit was conducted by an enterprising third party to took advantage of the many SW-24A models in service. Eventually, this led to a new model the SW-24C, an SW-24B airframe and drivetrain fitted with more capable versions of the engine initially introduced in the A+ as a retrofit.
4.2.2 Program Performance Metrics
4.2.2.1 Weight Derived
Based on data compiled from Jane's (ref. 4), the SW-24's empty weight was 7 % over the initial specification value upon receiving its initial Type Certification. Initially, there was some confusion regarding what weight empty value to use as a baseline. Jane's (ref. 4) published several lower empty weights up to the point in time that the aircraft was actually certified. The earliest reference came from the study phase of the program and was likely established by simple preliminary design methods and revised. The second value published seems more creditable since it appears consistently for several years in Jane's and other publications. Interviews with the lead mass properties engineer on the program also veirified this value and provided an explanation for some
of the numbers confusion. Equipped weight empty2 values for specific aircraft
2 Equipped weight empty refers to an aircraft configured with mission specific equipment such as avionics, safety
configurations corresponding to target markets were tracked internally and sometimes released. These values were commonly published without noting the specific configuration they represented. Nearer to the conclusion of this research effort, a copy of an early internal aircraft specification was discovered, eliminating any final doubts about the baseline value chosen.
Another observation was noted, the SW-24 spec empty weight represents a more austere configuration than any of the "launch" customers would operate. This is not an unusual marketing practice in the aerospace industry and will not impact any conclusions regarding weight control perfromance as long as the empty weight definition ramained consistent throughout the program. This issues was discussed with several of the interviewees, none were aware of mid-stream change in the definition of empty weight for the SW-24. Their explanation for the situation was that a large market for a stripped down, single pilot VRF, "no-frills" aircraft was anticipated. However, to their knowledge, no customer ever purchased such a configuration due to the surplus of inexpensive used aircraft. They also verified that a payload shortfall did exist with UK customers who conducted over-water operations. For these operations, the aircraft required additional avionics and safety equipment as compared with its US counterpart. This was the primary reason given for the 3.1 % increase in gross weight late in the development program.
Due to the relatively small magnitude of the increase, this change was accomplished with minimum program and aircraft impact. Structural analyses were revised, a major effort, but no redesign of the airframe or landing gear of significance was warranted. Some tests, including landing gear drop tests were repeated at the higher weights.
Over the course of the model's life, this card was played on three additional occasions with regard to -A models and once with the -B model. In all cases, the motivation was to recover payload capacity lost to weight growth. Two of the post certification weight increases with the SW-24A were executed within five years of receiving Type
certification, and were also accomplished with minimal impact to the airframe and landing gear.
In closing out this discussion, the useful load of the SW-24 upon Type Certification was exactly on target, due primarily to the increase in the maximum takeoff gross weight late in the program.
4.2.2.2 Range
The SW-24 spec design range was intended to be a realistic capability for its operators. It was based on carrying a full passenger load and fuel with a thirty-minute fuel reserve. During development this range status value dipped as low as 7.5% below the spec value, However, it was 1% over specification upon type certification. No specific range recovery actions could be identified other than a fuel capacity increase of 3%. Queries regarding this increase attributed it to latent capacity discovered during fuel system testing and not attributed to a specific redesign.
As discussed in a prior section, some customers could not achieve the spec, range due to the additional they were required to carry and the heavier than average passenger loading.
4.2.2.3 Altitude
The SW-24 exceeded its spec altitude performance by 10% upon receipt of its Type Certification. There were no specific recollections regarding the program history of this attribute. However, copies of original attribute tracking charts show that the aircraft's power margins was tracked to a value 5% higher than the spec value during development.
4.2.2.4 Frequency of Major Specification Changes
Three major changes to the design of the SW-24 were detected from the examination of records and publications. An increase in maximum takeoff gross weight, discussed in
prior section, a reduction in vertical tail area and the change from a variable to a fixed incidence horizontal tail. In actuality, the initial design had a fixed incidence tail. This was changed to a variable incidence tail after configuration risk reduction wind tunnel tests and flight simulation. According to reference 1, this decision was made in part to reduce the schedule risk associated with such a change introduced mid stream in to a certification flight test program. If the added capability was not needed the incidence could be simply fixed. As it turns out, the fixed incidence provided satisfactory handling qualities to obtain both VFR and IFR type certificates.
4.2.2.5 Program Schedule
First flight of the SW-24 occurred in early months of 1977, nine months later projected at the program launch. Its initial VFR Type Certification was obtained late in 1979 followed a month later with its IFR certification. Both dates are six months later than the original plan. Lastly, the first customer aircraft was delivered in February of 1979, reflecting an eight month slippage.
4.2.2.6 Flight Test Hours to Obtain Type Certification
Accurate documentation of the number of flight test hours was obtained through a Swamp Aircraft source. To obtain VRF type certification, four prototype aircraft accrued 1500 flight test hours. To gain IFR certification, an additional 700 hours were flown.
4.3 M700
4.3.1 General Overview
4.3.1.1 Prelude to M700
Prior to the M700 program launch, Marsh was delivering 150 new aircraft per year on average, with a peak production rate of 194 for 1987. Figure 4-5 chronicles the actual deliveries by model for Marsh from 1984 to 2000. Production was split roughly 60% / 40% between the two model lines, with deliveries split 80% / 20% military and civil customers. In the late 1980's, these numbers were anticipated to fall dramatically in the coming years as several military contracts were settling. These contracts were the primary source of revenue for Marsh, and, although potential follow-on upgrade and life extension US and foreign military contracts were likely, an overall downturn in revenues was projected.
Figure 4-5: Aircraft Deliveries / Marsh Aircraft
0 50 100 150 200 1984 1988 1992 1996 2000 CALENDAR YEAR AIRCRAFT DELIVERIES M700 M500 M400/M600
To address this, upgraded versions of two existing models were under development and early marketing and configuration studies of an aircraft, which led to the Marsh M700 program, were underway. Due to the post Cold War defense decline, these initiatives were focused on increasing the civil aircraft business.
Marsh's last foray into developing a new design aircraft occurred in the 1970's. It was a major military contract that was competed for by two other manufacturers. The contract award led to a protracted and controversial development program for this aircraft, the M500. There were many challenges in the areas of handling qualities, systems integration and reliability. Eventually, the aircraft entered service bringing with it impressive capabilities not seen in predecessor weapons systems. However, it has never been able to erase its reputation for being temperamental and unreliable.
The remainder of Marsh's product line traces their origin to a military aircraft developed in the 1960's. Over the years, this aircraft and its many derivatives became highly popular with both military and civil users.
4.3.1.2 Initial Plan
The Marsh M700 program was launched early in 1989 with the full support of Marsh's parent corporation. It was preceded by a year of configuration and market studies. First flight of the new aircraft was anticipated in 1992 with initial deliveries following within a year.
The launch announcement was well received, with over one hundred certificates of interest accrued in the course of one week.
4.3.1.3 Program Structure
Integrated Product Development Team (IPDT) best describes the configuration of the M700 program. A customer focus group comprised of potential launch customers from various market segments also supported the IPDT's during the early definition stages and at various design reviews.
To reduce the capital outlay for development, risk-sharing partners from North America, Europe, the Middle East and Asia were recruited to share in the development cost. In return, these partners would receive a share of the profits from each aircraft sale. Marsh retained the design of the primary flight systems, systems integration, final assembly and the delivery of the aircraft. The development of major modules including; the engines, fuel system, drive systems, main fuselage structure, landing gear, avionics, interior and furnishing were delegated to these partners.
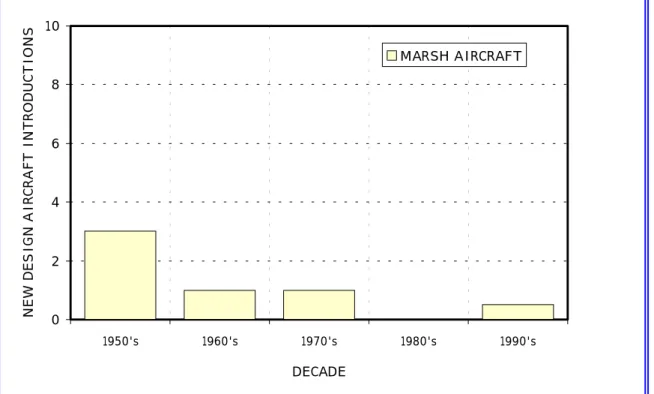
Figure 4-6: Frequency of New Design Aircraft Introductions / Marsh Aircraft
0 2 4 6 8 10 1950's 1960's 1970's 1980's 1990's DECADE
NEW DESIGN AIRCRAFT INTRODUCTIONS
4.3.1.4 Intellectual Capital
As previously stated, the last bona fide new design Marsh aircraft was the M500 which was designed during the mid-1970's. In fact, as depicted in Figure 4-6, the frequency at which new design aircraft introductions in the prior two decades was less than one. The lowest of the four case study manufacturers. Marsh did however have a knack for getting the most out of each new design by spawning many derivative models of each.
The sale of Marsh to another concern in 1984, impacted its indigenous intellectual capital when its engineering and manufacturing operations were moved several hundred miles inland to an adjacent state. The climate of the new location differed greatly and many longtime Marsh employees elected not to relocate. Most of the manufacturing talent was available local to the new site. To fill the voids in the technical ranks, aggressive recruiting of Marsh competitor workforces was employed.
At the time of the relocation, Marsh's priorities were (1) move it's existing manufacturing operations (2) bring the M500 in to rate production and (3) to secure the NGAC (Next Generation Aircraft) contract. The M700 was still a few years down the road.
When it came time for the M700 program, Marsh again turned to recruiting of Marsh competitor workforces. Ex-Marsh employees assigned to the M700 program estimated that 50% of the technical personnel on the program were recruited from outside companies, including themselves.
4.3.1.5 Tools
The Marsh M700 utilized all of the state of the art design and development tools including sophisticated a 3D digital CAD/CAM system. Using this system, machined parts are fabricated by numerical controlled machines directly from the digital data.
Another feature enabled a three dimensional virtual representation of the aircraft design to be assembled in whole or in part from a database of CAD files for components and sub-assemblies. This was utilized to evaluate inferences as well as maintenance access and vision obstruction. A host of contemporary finite element tools for stress analysis (NASTRAN) and fluid dynamics codes was utilized as well. An information exchange network was established so that this digital design and analysis data could be shared between partners with a minimum of difficulty.
Wind tunnels testing, a more traditional aircraft design tool, were used extensively. A 1/5 scale model tested in the Texas A&M wind tunnel was used to do configuration validation and development and drag reduction A full-scale test of the main wing was conducted in one of the NASA wind tunnels.
The MARSH M700 features a unique directional control system that was first introduced on another model just prior to the M700 launch. The development of this system on this aircraft led the M700 by several years and contributed greatly to the M700.
4.3.1.6 Type Certification
The MARSH M700 program suffered some delays during its execution, completing initial VFR certification 12 months later than the original target date. Type Certification for IFR operations experienced a considerably longer delay of 33 months. This will be discussed further in a subsequent section.
On a more positive note, one reference claimed that the M700 achieved certification in a mere 23 months after its maiden flight, the shortest on record for an aircraft of its type.
4.3.1.7 Post Certification Development
The majority of post TC development activity was focused on obtaining IFR type certification and enhancing the range and single engine capability of the aircraft. This
work eventually led to an improved -200 version of the aircraft which is discussed briefly in the subsequent section.
4.3.1.8 MARSH M700 -200
The -200 version of the M700 features an uprated engine and transmissions, improvements to the air inlets and a gross weight increase. A 7% increase in range and a 16% increase in payload resulted from these improvements. This model replaced its predecessor as the standard production configuration. Operators wishing to upgrade their aircraft to this configuration could buy these kits.
4.3.2 Metrics
4.3.2.1 Weight Derived
The weight metrics baselines were extracted from a technical publication authored by an MARSH employee early in the development program. They seem quire optimistic, and yield high weight metric variances (ref Table _). Putting the variance magnitudes aside, the constant creep of MARSH M700's weight empty and maximum takeoff gross weight indicate that the program had difficulty with weigh control. Four published maximum takeoff gross weights were found in a variety of publications prior to receiving its initial VFR type certification. A fifth followed as the aircraft received IFR certification. Clearly, the increments were aimed at delivering an acceptable useful load for its customers.
4.3.2.2 Range
The MARSH M700 suffered a continuous decline in range performance throughout its development. As envisioned, the aircraft maximum takeoff gross weight would be reached with a full tank of fuel and the advertised payload. However, as its weight escalated, the full payload and fuel could not be carried simultaneously. Due to geometric constraints imposed by its configuration, enlarging the fuel system of the
M700 proved difficult and only increased slightly over the duration of the development program.
The shortfall of its range performance led to its demise in one of its primary markets. In fact, the launch customer for the aircraft cancelled its option for further aircraft due to the range shortfall.
4.3.2.3 Altitude
The altitude performance for the MARSH M700 exceeded the original specification by 10%. An increase in engine and gearbox ratings was effective in countering detrimental impact of the aircraft's weight escalation during development.
4.3.2.4 Frequency of Major Specification Changes
Twelve major specification changes were identified for the M700 by examining published documents As previously discussed, the maximum takeoff gross weight of the Marsh M700 was increased five times. The actual impact to the development cost and schedule could not be quantified, although it is known that no changes were required to the aircraft for the last increase.
Other major changes allocated to this case include increases in both the engine and transmission ratings, a redesign of the electrical system, widening the fuselage 4" and the shortfalls in range and payload performance.
4.3.2.5 Schedule
As noted in Table 4 the schedule variance to achieve initial type certification was 12 months. Not entirely too bad for this industry. However, a much more serious delay of 33 months was encountered in obtaining IFR certification.
It is typical for aircraft in this class to obtain VFR certification first, deliver a few aircraft to customers to start the process of training its pilots and mechanics. Within three to six months the IFR certification is expected with little difficulty.
In the case of the M700, the basic electrical system did not meet the certification criteria for redundancy and had to be redesigned. In addition, the unique directional control system of the M700 was not architecturally compatible with existing automatic flight control systems offered by the chosen vendor. Thus, it required a significant redesign and several iterations to arrive at a certifiable solution. This clearly reflects on the lack of prior experience with IFR certification of civil aircraft.
Also of note, the M700's IFR type certification was sub-contracted to the automatic flight controls system manufacturer. This is a unique situation with respect to the other case studies.
4.3.2.6 Flight Test Hours to Obtain Type Certification
Three development M700's shared the type certification duties. Initial VFR Type Certification was achieved within 23 months after its maiden flight. It is estimated from literature that these aircraft collectively logged approximately 3,000 flight in reaching this milestone.
As mentioned in the prior section, a third party conducted the IFR certification of the M700. No published data or other sources could be found to establish the flight test hours required for the M700 to obtain an IFR type certification.
4.3.2.7 Summary
Table Table 4 provides a summary of the performance metrics at the M700s initial VFR type certification.
Table 4: MARSH M700 Metric Variance Summary
Metric Deviation We +36 % Useful Load -18 % Payload -28 % MTOGW +11 % Range -22 % Fuel +8 % HOGE +10 %
First Flight +9 mo.
Type Certification (VFR) +12 mo.
Type Certification (IFR) +33 mo.
Initial Delivery +12 mo.
Flight Test hours to TC 3,000 hrs.
Major Specification Changes 12
Further discussion regarding the metric values assigned are contained in the prior sections.
4.4 SWAMP SW-40
4.4.1 Overview
4.4.1.1 Early History
The SW-40 first appears in publications in the early 1990's. Initially the emphasis of the program and corresponding aircraft design was to capture a DoD contract for a multi-mission aircraft. At this early stage in the program, the aircraft was a direct derivative of the SW-18, an aircraft already in widespread service with the US and foreign militaries. This strategy was adopted to capitalize on cost effectiveness of procuring a high commonality derivative of an incumbent DoD aircraft as opposed to a new design
model3. A civil variant was to be derived from the military model, which bode well with
the "dual use" philosophy emerging at the time.4 While a compelling case, the DoD
procurement program was cancelled amidst a myriad of political turmoil.
After this, there was a period of internal deliberation as to the viability of such a program without the support of the US DoD. During this interval, the program was throttled back while the program direction vacillated back and forth from a DoD spec. aircraft to a pure Civil/FAA certified aircraft. Eventually, a new vision of the SW-40 program and aircraft emerged. It was externally similar to its predecessor, but based on significantly different assumptions.
This new vision was based on certification of the aircraft to the latest FAA/JAA airworthiness regulations. To enhance the aircraft's appeal to potential military customers, selected systems would be designed to meet more stringent military
requirements.5 The low cost argument, previously based on commonality with the
3 The basis of this argument revolved around network externalities such as pilot and maintenance training, and an
established logistics system and procurement efficiency.
4 The term "dual use" describes the philosophy where military technology is used for civil applications and vice
versa.
5 A large percentage of the projected international market for this class of aircraft was projected to be foreign