HAL Id: hal-00643411
https://hal.archives-ouvertes.fr/hal-00643411
Submitted on 21 Nov 2011
HAL is a multi-disciplinary open access
archive for the deposit and dissemination of sci-entific research documents, whether they are pub-lished or not. The documents may come from teaching and research institutions in France or abroad, or from public or private research centers.
L’archive ouverte pluridisciplinaire HAL, est destinée au dépôt et à la diffusion de documents scientifiques de niveau recherche, publiés ou non, émanant des établissements d’enseignement et de recherche français ou étrangers, des laboratoires publics ou privés.
Does the CO2 emission trading directive threaten the
competitiveness of European industry? Quantification
and comparison to exchange rates fluctuations
Quirion Philippe, Jean Charles Hourcade
To cite this version:
Quirion Philippe, Jean Charles Hourcade. Does the CO2 emission trading directive threaten the competitiveness of European industry? Quantification and comparison to exchange rates fluctuations. EAERE Conference, Jun 2004, Hungary. �hal-00643411�
Does the CO2 emission trading directive threaten the competitiveness of
European industry?
Quantification and comparison to exchange rates fluctuations
Philippe QUIRION* and Jean-Charles Hourcade Abstract
The European Union commitment to implement the Kyoto Protocol has been recently criticised by some Member States and high level officials who claim that such a policy would threaten the competitiveness of European industry vis-à-vis countries without a commitment. This concern has been voiced in particular against the European directive 2003/87/EC, which will create a CO2 allowance market covering carbon-intensive industry and energy supply
from 2005 on. We assess this claim through a quantitative analysis for twelve industry sectors for 2001, based on the OECD STAN and BTD databases, as well as on the IEA CO2
emissions database. Excluding intra-EU trade, it first appears that, with only one exception, carbon-intensive sectors (iron and steel, minerals, paper, power generation, fuel refining, chemicals) are less exposed to extra-EU competition than non-carbon intensive ones (transport material, machinery, textile, wood, food and drinks). Only the non-ferrous metals sector is both more carbon-intensive and more exposed than industry average.
We then compute the loss in sales for three sets of import and export price elasticities, estimated at the sector level, and compare it to the impact of a 10% rise in UE currencies vis-à-vis all other currencies. It appears that if allowances are grandfathered, and assuming a high allowance price (20 euros per ton of CO2), the competitiveness impact of the directive is, at
worst, 20% of the impact of the 10% rise in exchange rates.
Furthermore, if allowances are auctioned and the income recycled through a cut in social security contributions, sales of non-carbon intensive sectors increase. For two out of our three sets of import and export price elasticities, the overall impact is positive, i.e., the loss in carbon-intensive sectors is more than compensated by the increase in other sectors.
* contact author
CIRED (CNRS EHESS ENPC ENGREF) 45 bis avenue de la belle Gabrielle F 94736 Nogent sur Marne cedex, France
0. Introduction
The European Union commitment to implement the Kyoto Protocol on climate change has been recently criticised by some Member States and high level officials who claim that such a policy would threaten the competitiveness of European industry vis-à-vis countries without a commitment1. This concern has been voiced in particular against the European directive 2003/87/EC, which will create a CO2 allowance market covering manufacturing industry and
energy supply from 2005 on.
To assess this claim we compute, for twelve2 UE 15 industry sectors, the loss in turnover resulting from the unilateral implementation of the allowance trading directive, for several variants, based on 2001 data. We aim to identify the most sensitive sectors and to compare the loss in competitiveness to that of another asymmetric shock: a rise in the European currencies. In order to put an upper limit to the impact of the directive, we systematically choose pessimistic assumptions.
1. Exposition to extra-UE international trade and CO2 emissions
In the public debate on climate change mitigation, it is frequently said that high CO2 emitters
are particularly exposed to international competition. Yet, data supporting this argument are lacking. According to Fouquin et al. (2001), all energy intensive sectors appear to be less exposed to a drop of the US dollar vis-à-vis the euro than the industry average. However, this study cannot be directly used here because the authors compute the exposure, not to extra-UE trade, but to trade with countries whose currencies are not empirically linked to the euro, a smaller subset of countries.
To shed some light on this question, we computed for each sector the openness ratio used by the OECD3 (Coppel and Durand, 1999), as well as the emissions/turnover ratio. Graph 1 below displays the results. It turns out that among the sectors that are more exposed than average, only one, non-ferrous metals, is more CO2 intensive than average, and only slightly4.
All other sectors more CO2 intensive than average (electricity, gas and water; non-metallic
minerals; iron and steel; petroleum refining, coke and nuclear fuel; chemicals and pharmacy) are less exposed to international competition than the European manufacturing industry average.
1 Environment Daily 1574, 15/12/03 "Competitiveness test set for EU climate policy".
2 These sectors cover most of the manufacturing industry (94% of turnover) as well as electricity, water and gas,
a sector outside manufacturing industry but whose high CO2 intensity justifies the inclusion
3 This indicator is defined as: X/Q+(1-X/Q)*M/D, where X is exports, Q production, M imports and D final
domestic demand. The first element of the sum takes into account international competition on foreign markets and the second competition on the domestic market.
4 However, if emissions of other greenhouse gases than CO
2 were included, and if we took into account the
Graph 1. Openness to extra-UE 15 competition and CO2 emissions
in 2001, sources: OECD (STAN and BTD), IEA (CO2 emissions)
0% 10% 20% 30% 40% 50% 60% 0% 1% 2% 3% 4% 5% 6% value of emissions/turnover
(assuming 20 euros/t CO2)
Openness (OE
CD defi
ni
ti
on) see text
electricity, gas and water non-metallic minerals
iron and steel industry refining, coke and nuclear fuels chemicals
machinery and equipement, N.E.C.
textile, textile products, leather and footwear non-ferrous metals
transportation materials
wood and wood products
food products, beverages and tobacco paper, pulp, printing and publishing
average of manufacturing industry
2. Allowance auctioning, no recycling of receipts
In this first simulation, we assume that all allowances are auctioned, that the allowance price equals 20 euros per ton of CO2 and that the receipts are not used to reduce other taxes on
firms. 100% auctioning is not allowed by the directive but assuming a perfect capital market, pure grandfathering would lead to the same impact on turnover (Boemare and Quirion, 2002). We have to stress that the allocation method used in the directive is not pure grandfathering but a mix of grandfathering and output-based allocation, so that the impact on turnover will be lower than computed here. Again, we provide an upper limit to competitiveness impacts. We chose 20 euros because it is the reference value in the European Climate Change Programme. This value is higher than early forward trades on the European trading market (around 10 euros) and credits from CDM or JI projects (around 5 euros), once again in order
to provide an upper bound on competitiveness risks. In each sector, the loss in turnover is then the higher, the higher the four items below:
1. the cost of CO2 emissions reduction;
2. CO2 intensity;
3. openness to extra-EU trade;
4. price-elasticities of imports and exports, i.e. the percentage of rise in imports and of decrease in exports entailed by a 1% rise in the price of domestic producers.
Regarding the first point, we consider that the cost of reducing CO2 emissions is infinite,
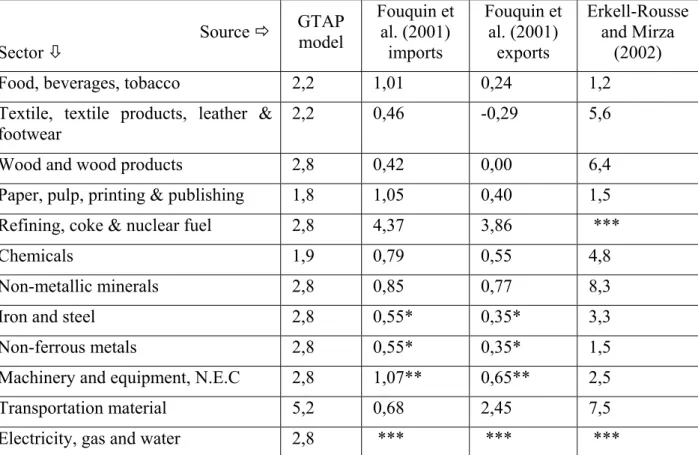
again in order to put an upper bound on competitiveness impacts. The second and third items are described above. The fourth items have to be econometrically estimated and, as we shall see, various results have been produced. We thus use three groups of import and export price-elasticities: those from the GTAP model, those obtained by Fouquin et al. (2001) and those obtained by Erkell-Rousse and Mirza (2002). Table 1 below display these values.
The GTAP model (GTAP team, 2002) is well-known in the study of international trade. Import and export price elasticities are taken from the SALTER model (Jomini et al., 1991), which is justified by the authors in the following way:
"The SALTER settings represent a compromise between econometric evidence and prior belief. A search of the econometric literature indicated that these elasticities are relatively low. On prior belief, it is generally believed that the terms of trade effects imply that the source substitution elasticities are relatively high. The SALTER settings adopted here, thus, represent a compromise: the elasticities are generally higher than that indicated by the econometric literature, but still low enough to generate significant terms of trade effects." (GTAP team, 2002, 20.1)
In other words, modellers of SALTER and GTAP considered that elasticities from econometric studies (around -1) were likely to be underestimated (in absolute value). On the opposite, the other two groups of elasticities that we use are only based on econometric studies.
Fouquin et al. (2001) use traditional methods and estimate separately import and export elasticities. Their results are consistent with the bulk of the literature, i.e., around -1 in most cases.
Erkell-Rousse and Mirza (2002) use more sophisticated econometric methods. In particular, they use instrumental variables which lead, in most sectors, to higher estimates than those obtained by traditional methods. For each sector, they present the results obtained by four different methods and we select the highest result statistically significant at 1%.
Table 1. Price elasticities of imports and exports used in the simulations Source Ö Sector Ø GTAP model Fouquin et al. (2001) imports Fouquin et al. (2001) exports Erkell-Rousse and Mirza (2002) Food, beverages, tobacco 2,2 1,01 0,24 1,2
Textile, textile products, leather & footwear
2,2 0,46 -0,29 5,6
Wood and wood products 2,8 0,42 0,00 6,4 Paper, pulp, printing & publishing 1,8 1,05 0,40 1,5 Refining, coke & nuclear fuel 2,8 4,37 3,86 ***
Chemicals 1,9 0,79 0,55 4,8
Non-metallic minerals 2,8 0,85 0,77 8,3 Iron and steel 2,8 0,55* 0,35* 3,3
Non-ferrous metals 2,8 0,55* 0,35* 1,5 Machinery and equipment, N.E.C 2,8 1,07** 0,65** 2,5
Transportation material 5,2 0,68 2,45 7,5 Electricity, gas and water 2,8 *** *** ***
* Since this study does not separate ferrous from non-ferrous metals, we took the same elasticity in both cases. ** Since this study distinguishes two sub-sectors, we have taken the weighted average.
*** These sectors have not been estimated by the authors. In the simulations, when we give results for all sectors covered by our study, we use the GTAP model elasticities.
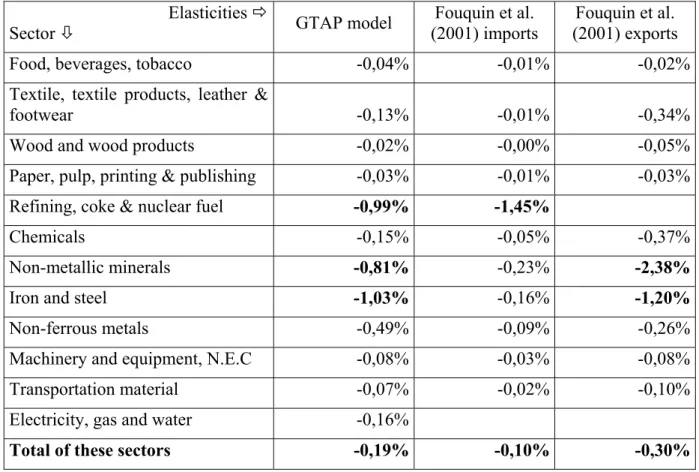
Results from this simulation are displayed in table 2 below. Impacts higher than 0.5% are in bold
Table 2. Decrease in turnover following auctioned allowances, no receipts recycling
Elasticities Ö
Sector Ø GTAP model
Fouquin et al. (2001) imports
Fouquin et al. (2001) exports Food, beverages, tobacco -0,04% -0,01% -0,02% Textile, textile products, leather &
footwear -0,13% -0,01% -0,34%
Wood and wood products -0,02% -0,00% -0,05% Paper, pulp, printing & publishing -0,03% -0,01% -0,03% Refining, coke & nuclear fuel -0,99% -1,45% -0,99%
Chemicals -0,15% -0,05% -0,37%
Non-metallic minerals -0,81% -0,23% -2,38%
Iron and steel -1,03% -0,16% -1,20%
Non-ferrous metals -0,49% -0,09% -0,26% Machinery and equipment, N.E.C -0,08% -0,03% -0,08% Transportation material -0,07% -0,02% -0,10% Electricity, gas and water -0,16% -0,16%
Total of these sectors -0,19% -0,10% -0,30%
As expected, the impact is negligible (less than 0.5% whatever the elasticity) in all sectors generally though of as not energy intensive. More surprisingly, this is also the case for some sectors generally considered as energy-intensive, for various reasons:
• In the paper sector, upstream activities (manufacturing of pulp and paper) are somewhat hidden by downstream, less energy intensive activities (printing and publishing). The same explanation holds for chemicals, which include pharmaceuticals;
• For electricity, gas and water, the low openness dominates the high CO2 intensity;
• For non-ferrous metals, on the opposite, the low direct CO2 emissions dominate the
relatively high openness.
In only three sectors is the loss in turnover higher than 0.5%: • Refining, coke & nuclear fuel;
• Non-metallic minerals; • Iron and steel.
To make these results more meaningful, we shall compare them to the impact of a 10% rise in the euro and the other three UE 15 currencies vis-à-vis the rest of the world. In this paper, we only present results using the GTAP model elasticities, since results with the other elasticity sets would bring few more information. The results presented in table 3 below overestimate a bit the impact of the currency rise since they do not take into account the decrease in the cost of imported inputs. According to Campa and Gonzáles Mínguez (2002), a 10% rise in euro entails a 1.2% decrease in the cost of intermediary consumptions in average. Our results are thus only slightly overestimated.
Table 3. Decrease in turnover following auctioned allowances at 20 euros per ton of CO2,
no receipts recycling, and following a 10% rise in European currencies*
20 euros/t CO2 no
recycling (1) 15 currencies (2) 10% rise in EU (1) / (2) Food, beverages, tobacco -0,04% -3,0% 1,4%
Textile, textile products, leather & footwear
-0,13% -13,0% 1,0%
Wood and wood products -0,02% -5,1% 0,4%
Paper, pulp, printing & publishing -0,03% -2,1% 1,6%
Refining, coke & nuclear fuel -0,99% -6,5% 15,2%
Chemicals -0,15% -4,7% 3,1%
Non-metallic minerals -0,81% -4,1% 19,7%
Iron and steel -1,03% -6,7% 15,4%
Non-ferrous metals -0,49% -15,4% 3,2%
Machinery and equipment, N.E.C -0,08% -17,4% 0,5%
Transportation material -0,07% -21,4% 0,3%
Electricity, gas and water -0,16% -0,3% 51,3%
Total of these sectors -0,19% -9,6% 1,9%
* GTAP model elasticities
It turns out that for all sectors, a 10% rise in European currencies, although much lower than the actual increase vis-à-vis the dollar since 2001, entails a decrease in turnover much higher than the climate policy: apart from the electricity, gas and water sector, which is anyway sheltered, the impact of the climate policy does is less than 20% of that of the currency fluctuation.
3. Receipts recycling through labour taxes reductions
In this section, we compute the impact on turnover of a scenario in which the receipts from the auctioning of allowances are used to decrease taxes on labour. We assume that the climate policy covers all CO2 emissions, including households', and that receipts are distributed to all
firms, as a proportion of labour costs. Results are displayed in table 4 below, in which figures higher than 0.5% are in bold again.
Table 4. Impact on turnover, comparison between no receipts recycling and recycling through a decrease in labour taxes
Elasticity sourcesÖ GTAP model Fouquin et al. (1999) Erkell-Rousse and Mirza (2002) Receipts recyclingÖ Ø Sector no labour taxes no labour taxes no labour taxes Food, beverages, tobacco -0,04% 0,04% -0,01% 0,01% -0,02% 0,02%
Textile, textile products, leather & footwear
-0,13% 0,37% -0,01% 0,03% -0,34% 0,95%
Wood and wood products -0,02% 0,18% 0,00% 0,02% -0,05% 0,41%
Paper, pulp, printing & publishing
-0,03% 0,05% -0,01% 0,02% -0,03% 0,04%
Refining, coke & nuclear fuel -0,99% -0,91% -1,45% -1,34%
Chemicals -0,15% -0,03% -0,05% -0,01% -0,37% -0,09%
Non-metallic minerals -0,81% -0,66% -0,23% -0,19% -2,38% -1,94%
Iron and steel -1,03% -0,84% -0,16% -0,13% -1,20% -0,98%
Non-ferrous metals -0,49% -0,17% -0,09% -0,03% -0,26% -0,09%
Machinery and equipment, N.E.C
-0,08% 0,48% -0,03% 0,15% -0,08% 0,43%
Transportation material -0,07% 0,41% -0,02% 0,13% -0,10% 0,59%
Electricity, gas and water -0,16% -0,15% -0,16% -0,15% -0,16%
Total of these sectors -0,19% 0,08% -0,10% -0,02% -0,30% 0,07%
CO2 intensive sectors still loose but the impact on turnover is mitigated, sometimes
significantly (by 5% in electricity, 8% in fuels, 19% in minerals and iron and steel industry, 66% in non-ferrous metals and 80% in chemicals). Turnover rises in other sectors. With elasticities from Erkell-Rousse and Mirza, the increase in turnover even exceeds 0.5 in transportation materials and almost reaches 1% in textile.
Furthermore, for two elasticity sets (from the GTAP model and Erkell-Rousse and Mirza), the total turnover of considered sectors increases slightly: +0.07 to +0.08%. With elasticities from Fouquin et al. it decreases but only by 0.02%. In other words, an ecological tax reform combining taxation, or tradable allowances auctioning, and labour taxes reduction increases the "aggregate competitiveness" of UE 15 industry, in so far as this expression is not
meaningless5. This positive conclusion is consistent with data presented in section 1: CO2
-intensive sectors are less exposed to international competition than industry average. As a consequence, the loss in turnover in these sectors is more than compensated by the increase in labour-intensive sectors. This remains true although, in our simulations, a large part of the decrease in labour costs benefits the service sector, which is thus likely to be a net winner, although we had no data to confirm this intuition.
To sum up on this point, receipt recycling allows compensating the loss in "aggregate" competitiveness. Hence one can only regret that the directive prevents such a strategy by limiting auctioning at 5% between 2005 and 2007 and 10% between 2008 and 2012.
4. Durability of exchange rate fluctuations and asymmetric environmental policies
In section 2, we compared the impact of a climate policy to that of an increase in exchange rates. This kind of comparison frequently prompts the following criticism: exchange rates fluctuations would be ephemeral while environmental policy asymmetries would be permanent. In other words, firms would not relocate their activities following a rise in European currencies because they would consider it as temporary while they would relocate following a unilateral environmental policy because they would consider it as long-lasting. Although widespread, this line of reasoning suffers from three weaknesses.
First, it assumes that firms anticipate that if a currency appreciates, it will go down, rather than up, in the future. Yet the fact that a currency (or any other financial asset) rose or felt in the past tells nothing on its likely future value. In the opposite case, it would be easy to win on financial markets, just by selling rising currencies!
Second, historically, cycles in exchange rates movements are not markedly shorter than political cycles. As shown by graph 2 below, the exchange rate of the French franc (then euro) in dollars follows five to ten years cycles. In five to ten years, it is not unlikely at all that the US implement a domestic CO2 policy comparable to the European allowance trading
directive. In November 2003, the proposed McCain-Lieberman bill aiming at creating such a CO2 cap-and-trade scheme has only been rejected in the US Senate by a small margin of 43 to
55, which gives it a good chance to be adopted in the future.
Third, even though it is very plausible that Kyoto does not enter into force and that the EU leads a unilateral policy for a while it is very unlikely that this policy would last in isolation. A2012, either a multilateral approach will re-emerge or all climate policies, including in the EU, will halt.
For these three reasons, the comparison of the impact of a unilateral climate policy with that of exchange rate fluctuations presented in section 2 is not nullified by exchange rates volatility.
Graph 2. Exchange rate French franc/dollar then euro/dollar
1980-2003 : yearly average, source OECD. 2004 : rate 7 January, source : IMF
0,0 0,2 0,4 0,6 0,8 1,0 1,2 1,4 1,6 1,8 1980 19811982 19831984 1985 198619871988 1989 19901991 19921993 19941995 199619971998 1999 2000 20012002 2003 2004 US dol la
rs for one euro
-53% in 5 years
+79% in 10 years
-30% in 5 years
+38% in 3 years ½
5. Conclusion
In the light of the present analysis, the European industry competitiveness does not seem threatened by the implementation of climate policies, even unilaterally, at least as long as the CO2 price generated by these policies does not exceeds the forecast of the European climate
change programme (20 euros per ton of CO2). Even taking the most pessimistic assumptions
for import and export price elasticities, neglecting any abatement possibility and assuming that allowances are sold without any compensation to firms, the loss in turnover exceeds 0.5% in only three sectors: fuels, non-metallic minerals and iron and steel. Recycling the receipts through a decrease in labour costs reduces significantly these impacts, which drop below 2% in all sectors in any case.
Furthermore, some of our assumptions lead us to overestimate the impacts on the turnover of CO2-intensive sectors:
• We assume a price of 20 euros per ton of CO2, higher than market expectations (about 10)
and CDM and JI projects (around 5);
• We include combustion installations smaller than 20 MW which are excluded by the directive;
• We assume that the directive only covers the EU 15 whereas it will also include the ten acceding countries and possibly Romania, Bulgaria and Norway;
• We assume no climate policy in the rest of the world, although Japan, Canada, New-Zealand and Switzerland will need policies at least as ambitious as the EU to comply with their Kyoto Protocol target.
Admittedly some of our assumptions underestimate the loss in turnover of CO2- and
• We assume that the consumption of CO2-intensive products does not decrease following
the rise in these products' price, which only changes the sharing out between EU and foreign producers;
• We neglect input-output feedbacks, e.g. the impact of a higher electricity price on non-ferrous metals.
It is hard to assess whether the positive or negative biases dominate; in any case, our results are not systematically biased. As a consequence, competitiveness is not a rationale to oppose the implementation of the CO2 allowance trading directive.
Appendix 1. Data sources
All data are from year 2001. Emission data are from the International energy agency "CO2
emissions from fossil fuel combustion", CD-ROM 2003 edition. As regards greenhouse gas sources coverage, we chose to stay as close as possible to the directive. As a consequence, we did not include other gases than CO2, neither process emissions from the chemical industry.
On the opposite, process emissions from iron and steel and minerals industries are included6. However, contrarily to the directive, we could not exclude combustion installations smaller than 20 MWth because of a lack of data. Lastly, we adopted a "wide" interpretation of the
sectoral coverage of the directive by including fossil fuel emissions in sectors not listed in the annex I of the directive, like chemicals or non-ferrous metals. Member states diverge on this point so we stuck to the interpretation given by the European Commission.
Data on turnover and labour cost come from the OECD STAN database. For the three UE countries outside the euro zone, data have been converted in euros using 2001 exchange rates from the OECD. For some countries, the STAN database does not distinguish the iron and steel sector from the non-ferrous metals sector; in this case, we have supposed that the sharing out was the same as in other countries7. Imports and exports come from the OECD BTD (bilateral trade database). For each member state, we subtracted imports from and exports to the EU 15 from total imports and exports in order to get the extra-EU international trade. BTD data, originally in US dollars, have been converted into euros using the OECD 2001 exchange rates.
References
Boemare C. and P. Quirion (2002), "Implementing greenhouse gas trading in Europe: Lessons from economic literature and international experience", Ecological Economics, 43(2-3): 213-230, December
Campa et Gonzáles Mínguez (2002), Differences in exchange rate pass-through in the Euro
area, IESE Working Paper No. D/479, Madrid, October
Coppel J. et M. Durand (1999), "Trends in market openness", OECD, Economic Department
Working Papers, 221
Erkell-Rousse et Mirza (2002) "Import price elasticities: reconsidering the evidence",
Canadian Journal of Economics, 35(2): 282-306
Fouquin M. et al. (2001), Sector sensitivity to exchange rate fluctuations, CEPII Working paper 2001-11, November
GTAP team (2002) GTAP 5 Data Package Documentation, Purdue University
Jomini P. et al. (1991) SALTER: A general equilibrium model of the world economy, vol. 1, model structure, data base, and Parameters, Australia: Industry Commission
Krugman, P. (1994) "Competitiveness: A dangerous obsession", Foreign Affairs, March-April
6 Iron and steel process emissions (iron ore reduction) are included in IEA data. Process industries from
non-metallic minerals are not: they are roughly equal to emissions from fossil fuel combustion in this sector. As a consequence, we doubled IEA data.