Publisher’s version / Version de l'éditeur:
Vous avez des questions? Nous pouvons vous aider. Pour communiquer directement avec un auteur, consultez la
première page de la revue dans laquelle son article a été publié afin de trouver ses coordonnées. Si vous n’arrivez pas à les repérer, communiquez avec nous à PublicationsArchive-ArchivesPublications@nrc-cnrc.gc.ca.
Questions? Contact the NRC Publications Archive team at
PublicationsArchive-ArchivesPublications@nrc-cnrc.gc.ca. If you wish to email the authors directly, please see the first page of the publication for their contact information.
https://publications-cnrc.canada.ca/fra/droits
L’accès à ce site Web et l’utilisation de son contenu sont assujettis aux conditions présentées dans le site
LISEZ CES CONDITIONS ATTENTIVEMENT AVANT D’UTILISER CE SITE WEB.
Internal Report (National Research Council of Canada. Division of Building
Research), 1964-11-01
READ THESE TERMS AND CONDITIONS CAREFULLY BEFORE USING THIS WEBSITE. https://nrc-publications.canada.ca/eng/copyright
NRC Publications Archive Record / Notice des Archives des publications du CNRC :
https://nrc-publications.canada.ca/eng/view/object/?id=14d57d48-e8cf-4ec3-9883-9f99c756c3c7 https://publications-cnrc.canada.ca/fra/voir/objet/?id=14d57d48-e8cf-4ec3-9883-9f99c756c3c7
Archives des publications du CNRC
For the publisher’s version, please access the DOI link below./ Pour consulter la version de l’éditeur, utilisez le lien DOI ci-dessous.
https://doi.org/10.4224/20338132
Access and use of this website and the material on it are subject to the Terms and Conditions set forth at
Electro-kinetic and conductance studies of clay sediments in the
Ottawa-Hull area
CANADA
DIVISION OF BUILDING RESEARCH
ELECTRO-KINETIC AND CONDUCTANCE STUDIES OF CLAY
.SEDIMENTS IN THE OTTAWA-HULL AREA
by
Edward Penner
AN l\l VZED
Internal Report No. 305 of the
Division of Building Research
OTTAWA
The Leda clay deposits of the St. Lawrence and Ottawa River valleys of Eastern Canada are of great engineering significance because of their relatively high void ratios and sensitive structur es. These features result in very large compressions under load and frequent earth flows in natural slopes.
Although these physical properties are easily demon-strated in the laboratory and often observed in nature, the fundamental behaviour of the soil is not well understood. It was with the objective of improving this understanding that Mr. Penner, who is a soil scientist in the DBR Soil Mechanics Section, planned and carried out the research program described in this report.
In addition to describing the test methods and results of electro -kinetic and conductance studies of a variety of Canadian soils the author reviews the technical literature with particular reference to clay-water systems. This leads to several specific conclusions concerning the relationship between sensitivity and some measurable physical and chemical characteristics of the bulk soil . . When related to other observations of the performance of the undisturbed soil an improved appreciation of micro -mechanisms during deformation is gained.
It is hoped that this report will stimulate discussion of the fundamental properties of these and similar soils.
Ottawa
November 1964
R. F. Legget Director
Page REVIEW OF LITERATURE
1. Sensitivity of Clay Sediments - Definition and
Test Methods . • . . . 2 2. The Nature and Origin of Sensitive Clays . . . • . . 4 3. Nature and Electrolyte Content of the Pore Water 6 4. Mineral Composition of Sensitive Clays • . • . . • . . . . • . . . . • 7 5. Electro-kinetics and Electrical Conductance with
Particular Reference to Clay-Water Systems . • • . . . •
9
(a) Electrical conductance of solutions and
clay-water systems . . . • . . . • . . • • . . • . • . . • . •
9
(b) Electro-kinetic phenomena with particular
reference to clay-water systems . . • . . . • . . • • 10
EXPERIMENTAL
1. Apparatus and Methods
...
13THE OR Y 15
MATERIALS
RESULTS AND DISCUSSION
17
1. Preliminary Studies on the Performance of the
Electro-osmotic Cell 18
2. Electrical Resistance and Conductance Capacity. . . . • . . . . 19 3. Detailed Electro-kinetic Studies •..•••••.••..••••..•.•• 21
(a) Influence of mechanical and chemical
dispersion . . . e._ • • • • • • • • • • • • • • • • • • • • • • • • • • • • • • 22
{b} Leaching experiments. • • . . • • • • . . . • 23 {c} Electro-kinetic potentials of undisturbed
soils of varying salt concentration •....••.••.•.• 23 {d} Adsorption of sodium metaphosphate in
relation to structure. . . .. • . • . . . • . 24 (e) Pore -water salt 'composition . . . • . . . 25 (f)' Amount of electrolyte required for
floccu-lating sensitive clays from the Sewer
Plant location. . . • • . . . 27 (g) Shear strength in sensitive clays
.
.
..
..
..
.
...
.
.
...
28CONCLUSIONS 31
REFERENCES • . . . • . . . • . . . 33
SEDIMENTS IN THE OTTAWA-HULL AREA
by
Edward Penner
According to the geological studies by Sir William Dawson as summarized by Johnson (l), the fine-grained deposits that are found extensively along the Ottawa - St. Lawrence Rivers and their tribu-taries were thought to be marine sediments of the Champlain Sea. These deposits were given the name IILeda clay" by Dawson. Although this name has been retained in the literature from time to time, it has been
suggested that possibly the whole deposit is not uniquely marine in origin. In particular, geologists have not been in agreement about the sequence of events beginning with the general uplift of the area and the recession of the Champlain Sea.
In the most recent report on the surficial deposits in the Ottawa-Hull area, Ga dd (2) stresses the view that Ita sudden influx of fresh water produced either by release of meltwater from glacial sources or more likely by the sudden release of large volumes of silt-laden
water from the Great Lakes region" was capable of considerable erosion of the old Champlain sediment. This sediment was subsequently deposited in fresh water lacustrine or fluvial environment to which the origin of the upper (and younger) deposits are now assigned.
On the basis of engineering properties, no distinction has been made between these radically different deposits because the clays from the whole St. Lawrence Lowland region have the same unusual engineering problems which are commonly assigned to "leached marine deposits. I. The dominant property of these fine -grained soils is a
characteristic loss of strength when disturbed or remoulded. A
combination of structural breakdown and other factors sometimes causes the whole mass to be transformed into a fluid state.
The strength-loss property when r emoul de d, termed the IIs e n sitivity" of the soil, was described and defined by Terzaghi in 1944 as the ratio of the undisturbed strength to remoulded strength. For Leda clay this ratio is rarely less than ten below the fissured drying crust, and sometimes reaches several thousand. It is not surprising then that this vast deposit is scarred by characteristic flow slides, similar to the flow slides in the Scandinavian countries. Many flow slides occur each year in this region often with disastrous results.
Although the prediction and control of potential flow slide sites is the most urgent engineering problem and would have far reaching effects if it could be done successfully, the unique behaviour of this material affects all engineering problems related to settlement and stability.
The research reported in this paper is concerned with elucidating the physico -chemical nature of sensitivity in these
deposits, particularly with respect to its relationship to the electro-kinetic potential. The soils studied cover the characteristic range of sensitivity encountered in Leda clay and were selected from various locations and depths, mostly from the Ottawa-Hull area.
The author is not aware that measurements of electro-kinetic potential have been attempted previously for natural soils in the study of sensitivity, although the concept of interpartiCle repulsion is frequently invoked when describing the phenomenon. As the structure of the soil, its resultant high moisture content, and the repulsion forces are all important aspects of sensitivity, the nature of the structure has also been given special attention. A method of determining preferred particle orientation by electrical conduction has been evaluated and this adds one further method of evaluating structure to those methods already in use such as volume change due to swelling and shrinking, the thin section technique, heat flow measurements, and the X-ray method.
The results reported in this paper clearly demonstrate that the degree of sensitivity of a soil is not uniquely dependent on anyone factor. In fact, sensitivity is an expression of many inter-related soil properties. Soils were selected from various deposits in the Ottawa area which, according to some geologists, have had different sedimentation environments. This affor ds the special opportunity of evaluating the concept of leaching and speculation on other major contributing causes in the development of highly sensitive soils in the St. Lawrence Lowland deposits of Eastern Canada.
RE VIE W OF LITERATURE
1. Sensitivity of Clay Sediments - Definition and Test Methods
Ter zaghi (3) defined the sensitivity (S) of clays in terms of the unconfined compression strength at the same water content as
where
qd is the natural (undisturbed) strength
and q the remoulded strength. dw
Because the value for S may vary from 1 (most uncommon) for an insensitive soil to a very large value for highly sensitive soils, Skempton and Northey (4) proposed the following arbitrary
sensitivity classification of soils into separate ranges based on shear strength:
1. S
=
1 insensitive clays2. S
=
1-2 clays of low sensitivity3. S
.-
2-4 clays of medium sensitivity4. S
=
4-8 sensitive clays5.
S=
>8 extra-sensitive clays6. S
=
> 16 quick clays.Rosenqvist (5) modified and extended the classification for the more sensitive clays from the fifth category to accommodate "certain Scandinavian soil typ e s!' termed "quick clays" as follows:
5.
S=
8 -16 slightly quick clays6. S
=
16-32 medium quick clays7. S
=
32-64 very quick clays8. S
=
> 64 extra quick clays.It is evidently not practicable to determine the sensitivity of all clays by the unconfined compression test used originally by Terzaghi in his definition. Several other methods of determining sensitivity have been reported in the literature but in other respects the definition has been retained.
Eden and Kubota, using Leda clay, found the value of S depended on the test method (6). This means that some or all of the
4
-methods used at present cannot be clearly interpreted. On the basis of their study of various sensitivity test methods, these author s stated that the present methods employed in measuring sensitivity cannot be expected to yield consistent results and that no one method is to be preferred. The factors listed that were thought to be responsible for the " r ather poor results" were: insufficient sensitivity in the
apparatus for measuring the remoulded strength; the time interval allowed between remoulding and testing for remoulded strength as all clays have thixotropic properties; and whether tests are conducted with increasing or decreasing rates of shear. To this the authors might have added that incomplete breakdown of structure has a strong influence on the remoulded strength and would not be achieved to the same degree in each test method. This is especially true when com-paring the remoulding achieved in the vane methods with that achieved in cone tests. The more common methods used are the field vane apparatus, the laboratory vane and the drop cone method.
2. The Nature and Origin of Sensitive Clays
In describing the properties of Norwegian marine clays, Bjerrum (7) mentions that the possibility of explaining flow slides by leaching was indicated in pdper s in 1929 and 1934 by G. Holmensen (8,
9).
Tests made by Rosenqvist (5) and Skempton and Northey (4) did not show that the leaching of laboratory samples with high pore-water salt content reduced the natural strength of clays, although it greatly reduced the remoulded strength. Subsequently, comprehensive leaching tests of laboratory-prepared samples by Rosenqvist andBjerrum did show a reduced undisturbed strength, and such results were used as substantiating evidence regarding the cause of certain slides in marine clays where the salt content was low at the time the slides occurred. Bjerrum states that "where the possibilities of
leaching are present (in marine clays) this reduction in shear strength may lead to slides without external causes" (7). Some 35 slides had occurred by that time where no external causes could be found, 28 in quick clays.
The explanation for the development of highly sensitive clays (quick clays) from naturally-deposited marine sediments by the reduction of the electrolyte content in the pore water is attributed to Rosenqvist (5). The results of comprehensive laboratory
experiments involving sedimentation, consolidation, and leaching by Skempton and Northey (4) and Bjerrum and Rosenqvist (lO) have apparently substantiated the hypothesis. Rosenqvist postulates the formation of a quick clay as follows. When clay minerals are
particles are low. The particles tend to flocculate when brought close together. The resulting sediment has an open structural arrangement. Because the forces of repulsion are low between particles, their thermal energy can bring them into close
proximity. The cations are partly polarized creating Van der Waals forces of attraction. Subsequent consolidation brings the particles still closer together. When the sediment is leached the reduction in electrolyte concentration increases the dissociation of the adsorbed cations which increases the repulsive forces, but the Van der Waals forces remain nearly unchanged. Upon remoulding, the Van der Waals forces are broken down, recombination being prevented because of the high repulsive forces. Although a number of details have been added to the explanation during the last eight or nine years, most researches have accepted this explanation for the development of sensitivity in a marine clay. On the other hand, most researches in this field dating back to Ske mpt on and Northey (4) have been quick to point out that the so -called "leaching theory" does not necessarily explain the formation of all sensitive or
extra-sensitive clays that are encountered in nature.
Soderbloom (11) stated that the conclusion reached in the literature to the effect that a meta-sensitive product can form only from salt -coagulated material is contradicted by experiments which show that glacial clays become quick when treated with dispersing agents. A further preliminary view expres sed by Soderbloom is . .. "The quick clays examined are built up of a skeleton of uninfluenced coarse material which is non-cohesive, and this is mixed with a cohesive material in which the cohesive properties are reduced by the influence of disper sing agents. The clay is thus sensitive to mechanical
change in the non-cohesive skeleton, II . .. IIPreliminary experiments have shown that even the colloidal fraction of clay contains undis-per s ib le constituents. liOn the other hand, in studies on clay from
I I . 11
the Gota RIver. at Alvangen, Soderbloom (11) was unable to develop a highly sensitive condition by leaching alone and has performed
experiments which led him to believe that natural oxidation processes plus infiltration of organic dispersing agents from peat beds may well account for the sensitivity developed.
Some fresh-water clays may also be sufficiently sensitive to be classified as quick clays. Eden (12) has reported on the
sensitivity of a varved clay from the bottom of Steep Rock Lake after it was dewatered for iron mining purposes. The dark layers were found to have a sensitivity of 12 based on the unconfined compression test, but the light layer was too soft in the remoulded state to form a sample for the compression test. These soils are "slightly quic k" according to Rosenqvistls revised sensitivity classification. Again in
varved clays in Northern Ontario near New Li s ke a r d, Eden and Bozozuk (13) have measured sensitivities as high as 19 with the field vane. The average clay size content « 0.002 mm) was 93 per cent.
3. Nature and Electrolyte Content of the Pore Water
There is much less information in the literature regarding the nature and electrolyte con tent of the pore water of sensitive soils than about their engineering properties. Both type and amount of ions in solution appear to influence the mechanical properties of the remoulded soil to a greater extent than the natural soil. For example, Bjerrum (7) has shown that by leaching a
marine-deposited clay the natural strength was reduced by 60 per cent but at the same time the remoulded strength was O. 1 per cent of its original strength.
Numerous laboratory studies have been carried out on the strength increase or reduction of remoulded soils by the additions of various electrolytes (14). The most noticeable variations are observed between the effect of adding coagulants and disper sants and are brought about by changing the electro-kinetic behaviour of the clay surfaces.
The natural leaching of a soil originally deposited in sea water will apparently change the relative concentration of the various ions. This observation is reported to have been made by Holmensen before 1930. Rosenqvist cites examples of changes in the ratios of the main anions, Cl - and S04 =. The mechanism to explain the differential leaching of anions and cations is apparently based on preferential adsorption although in the case of anions this is not too clear (IS). Changes are also brought about in the nature of the electrolyte, most notably in K+, by weathering processes. In Norwegian marine clays the most important ions in the pore-water phase have been found to be Na+ Mg++ K+ Ca++, S04=t CL", and to a lesser extent HC0 3- (1S). Although such information about
Norwegian soils has been available for many year s , this report, to the author's knowledge, presents the first chemical analyses of the pore water carried out on so-called marine clays in Canada in connection with sensitivity measurements.
Although only sparse information exists about the nature of electrolytes in sensitive soil , many total-dissolved-salt
measurements have been made on pore water. Skempton and Northey (4) report concentrations ranging from 0 to 30 gm/I. Of
7
-the six marine or estuarine deposited soils, -the sensitivity was inver sely related to the salt concentration. Bjerrum (7) found the same general relationship for all of the locations studied in Norway.
Although no pore -wat e r chemical analyses have been reported for geologically similar deposits in Canada, there are numerous results of pore-water concentration (gm/l) available for the Ottawa area (16) and some from other locations in the same geological region (17). In the Ottawa area, the salt content has been found to be less than Z gm/l except for one location. Here the salt increases from the surface with depth and reaches about 15 gm/l at 80 ft. At Nicolet, Oue , , the site of a flow slide in 1955, salt concentrations were found to range from below 1 to 11 gm/l with no obvious pattern of distribution with depth. All the sensitivities fell in the IIs li gh tly qui c k!' range despite the variation in salt concentration. At one level, extra quick clays were encountered. In general, it can be said that no correlation has been found between sensitivity and
salt concentration in soils studied by the Division of Building Research, although large variations in sensitivity have been measured. Previous studies of sensitive varved clays (IZ, 13) have not included the
determination of por e -water salt content. For these the assumed glacial origin is generally accepted.
4. Mineral Composition of Sensitive Clays
Attempt s have been made in the past by the author and other s to establish a definite connection between sensitivity and the mineral composition of the clay-size fraction. Nearly always, in those soils that are suspected to have had a marine origin, at least some chlorite has been reported; whether this has any significance is not known. Such attempts at linking compositional analyses with
sensitivity have not been particularly helpful but such a possibility is not ruled out since, in clay mineral analyses, much depends on the analytical techniques used and the interpretations. Furthermore, recent advances in both the science and technology of clay mineral analyses quite naturally render the earlier studies less reliable and leave relatively few studies that are useful. Nevertheless, drawing on the limited information available, it is possible to make the
following generalizations about the two main regions of highly sensitive clays -- Fennoscandia (mainly Norway and Sweden) and the St.
Lawrence - Ottawa River Valleys of Eastern Canada.
1. Montmorillonite, or other expanding layer silicates, is absent or present in only trace quantities.
2. Some chlorites are frequently present. 3. Some vermiculite is usually reported. 4. Illite, hydrous micas, or micas are the
predominant clay mineral.
5. Rock-forming minerals consisting of vary-ing proportions of feldspar, quartz and amphibole make up a large part of the clay-size fraction with feldspars predominating. 6. The same rock-forming minerals found in
the clay are represented in the silt - and sand-size fraction.
7. The major change accompanying particle size is an increase of clay minerals in the small-size fractions with a consequent dilution of the other minerals.
8. Mineral composition is closely related to the source rock but there is some disagree-ment on the degree of chemical alteration.
The varved clays in the clay belt of Northern Ontario are similar to the above in most respects with the exception that the varved clays are higher in montmorillonite.
The compositional analyses of Finnish clays according to the studies of Soveri (18) are similar to the marine clays in Norway and Sweden with perhaps a lower content of rock - forming minerals in the clay-size range. The strong influence on clay composition of nearby source bed rocks is emphasized by Sove ri , No kaolinite or montmorillonite was found in the samples studied.
Soil engineers have found it useful to identify the composite behaviour of a soil on the basis of "activity." The assumption is that the physico-chemical characteristics that determine the mechanical properties of a soil depend on the amount and type of minerals in the clay-size fraction. To this should be added the influence of the concentration and nature of the electrolyte in the pore water. The merit in using such quantities as activity stems from the fact that it has not been pos sible to predict with any reasonable precision the engineering behaviour of a fine -grained soil from the type and proportions of the clay
The activity of a soil is determined by plotting the per cent clay-size particles vs the plasticity index. The slope of the line obtained by connecting such a point to the origin is the "activity." The sensitive soils from Fennoscandia and Canada all fall into the groups referred to as "inactive," that is, with a
slope less than 0.75. The Canadian soils in the St. Lawrence Lowlands tend to have a somewhat greater slope than the others {l5}. In general, the clay-size fraction is usually higher although a wide variation exists. As it is not possible to predict the
behaviour of a clay soil from its mineral composition except in very general terms, the concept of activity (19) as a measure of composite behaviour will apparently continue to be useful for engineering purposes.
5. Electro-kinetics and Electrical Conductance with Particular Reference to Clay-Water Systems
(a) Electrical conductance of solutions and clay-water systems. - It is self-evident that if electrolytes are partially or completely ionized in s o lutior. and a drop in potential exists across two electrode s placed in this solution, a current will flow between the electrodes. In such cases current flow is due to the migration
of ions in solution. Positively-charged ions (cations) will move to the negative electrode (cathode) and the negatively-charged ions (anions) will move to the positive electrode (anode). The amount of current carried by an ion will depend On its charge and the rate at which it moves through the solution.
Conductivity of a solution is normally expressed in terms of specific conductivity (Ie s) although it is calculated from resistance measurements. As conductivity (Ie) and resistance (R) have a reciprocal relationship it is an easy matter to go from one to the other. Similarly, specific conductivity (Ie s) and specific resistance (R s) are also reciprocally related for any electrolytic conductor.
x
s 1,Je ::: A 1, I ::: A R ::: KI R I ::: R s {l}If 1" the distance between two electrodes, is exactly I cm and A, the area of the electrodes, is exactly I cml , Ie s ::: Ie, that is, by definition, specific resistance is the resistance of I cm 3 of solution. For any particular cell, 1, and A need not be measured since Je s is accurately known for many solutions. Also for any given cell 1, /A is rigidly fixed by the geometry of the electrodes and is called the "cell
10
-constant" K. It can be indirectly determined by filling the cell with a solution of known specific conductivity and measuring R. Then from Eq. (l) the cell constant is K
=
R x A. s > For any other unknownsolution R is measured and hence the specific conductivity,
As
=
K/R. The units of As are cm/cm 2 xl/ohm=
cm- 1 ohmr J;The conductance of a clay slurry is not the sum of the conductance of the clay and the conductance of the pore fluid. As Van Olphen and Waxman (20) have pointed out recently, in the case of rock this is a consequence of the ionic double layer phenomenon which results in surface conductance. The clay being negatively
charged attracts positive char ge s (cations) from the liquid and pro-vides a conductance path along the surface of the clay which is not allowed for in the equation and therefore,
A. (pore liquid)
+
A. (clay)f
A. (clay slurry) (2) Van Olphen and Waxman point out that for a given pore which is filled with fluid, and where the opposite walls of the pore are approximately parallel, the following equation holds:A. (pore liquid)
+
A. (clay surface)=
A. (liquid-filled pore). (3) Special factors must be taken into account when in situ resistance measurements of clay deposits are used as a basis for estimating the salinity of the pore fluid even though the relative proportions of the various ions remain the same. These factor s are: the clay particle concentration, the geometry of the clay structure and the relative magnitude of the surface conductance compared with conductance of the pore liquid. With increasing electrolyte concentration of the pore liquid and decr easing clay particle concentration, the importance of the surface conductivitydiminishes.
(b) Electro-kinetic phenomena with particular reference to clay-water systems. - When two phases such as clay particles and water come in contact, there is a spontaneous separation of charges at the interface which gives rise to electro-kinetic phenomena. The negatively-charged surfaces of clay are the result of isomorphous
substitution of cations within the crystal structure. Hence, if· tetra-valent silica ions have been replaced by tri-valent aluminum ions, the crystal has a resultant excessive negative char ge. To counterbalance the excess negative charges, cations are adsorbed .on the surface and this neutralizes the clay micelle. Such ions cannot be removed except by replacement. The concept of a fixed negative
char ge for clays and electro -neutrality by cation adsorption is accepted generally. The spacial distribution of cations, however, is dependent on the properties of the solution. It follows from this that the resultant potential drop exterior to the particle in the
solution is a variable. The salient features of one diffuse double-layer concept is diagrammatically depicted in Figure 1, recognizing that such an illustration may incorporate many oversimplifications partly for the sake of clarity and partly because of the many
uncertainties that still exist about the constitution of the clay particle and its environment.
Following the concept of electro-kinetic or zeta
potentials and the electrical diffuse double-Layer as developed by Alexander and Johnson (20), the negatively-charged particle is surrounded with a shell of strongly-bound water. In this water and next to the particles some cations may be held more or less
permanently in position and constitute the so-called immobile Stern layer. These Ilfixed1 1 cations partly counterbalance the negative charges. The remainder of the cations are considered to be in a mobile layer.
The concentration of cations decreases with distance from the surface of the particle to an average concentration of cations in the bulk solution; conversely, in the mobile layer the concentration of anions is essentially zero at the boundary but increases with distance up to an average concentration of the bulk solution.
The flood of cations in the mobile layer is relatively distant from the particle but, in the sphere of influence of the negatively-charged particle, the cations are in constant motion by virtue of their thermal energy and may be interchanged with cations from the bulk solution. Thus the behaviour of the ion atmosphere is statistically determined and is known as the IIdiffuse layer. II
Alexander and Johnson (21) point out that it is sometimes useful to think of a shell of char ge s equivalent in action to the diffus e layer. The distance between the outside of this shell and the surface of shear (interface between immobile and mobile layers) is known as the thickness of the double layer, d. For water at 25°C,
where
d
=
3.05 x 10 -8,ff
, cm (4)o o Assuming I
=
0.01, d=
30. 5A and when I=
1, d=
3.05 A, this means that the electro-kinetic potential is smaller with increased concentration and drops to zero over a shorter distance, d, from the immobile layer.When an external electrical potential is applied
tangentially to the surface of the particle. the positively-charged diffuse layer will be attracted toward the negative electrode (cathode) and the negatively-charged particle (together with the immobile layer), will be attracted to the positive electrode (anode). This forms the basis for measurement of electro-kinetic potentials. As there are
several ways in which this may be done, they have been classified in the literature as follows:
1. Electro -osmosis - involving the movement of a liquid relative to the solid by the external application of an electrical field.
2. Electrophloresis - involving the movement of a solid phase with respect to the liquid by the external application of an electrical field.
3. Streaming potential - involving the movement of the liquid by mechanical means with respect to the solid and measuring the electrical
potential induced.
4. Sedimentation potential (Dorn effect) - involving the movement of the solid by mechanical means (usually gravitational) and measuring the
electrical potential induced.
As this paper is concerned with the measurement of the electro-kinetic potential by electro -osmosis, further review will be confined to this method.
The electro-osmotic technique has been used to study the electro-kinetic potential of a large variety of pure crystals by
Douglas and Walker (22), for other material such as cellulose fibre by Goring and Mason (23), and more recently for the study of
bentonite drilling muds by Oakes and Burcik (24).
By this method, a liquid-saturated plug of solid particles is held in a fixed position. An external electrical potential is
Utilizing the flow rate, the applied potential, the dielectric constant and viscosity of the liquid in the diffuse layer, the electro-kinetic potential E k may be calculated using the Smoluchowski-Helmholtz equation. As with the other methods of measuring electro-kinetic potentials there are limitations with the electro-osmosis technique. The three more important ones are discussed in some detail by Kruyt (25) and may be summarized as follows:
1. The conductance determining the conduction current should depend solely on the bulk conductivity of the liquid. This means that surface conductance should not contribute significantly to the total conduction. If it does, it is possible to partly correct for the error.
2. The radius of pores of the plug must be much larger than the thickness of the double layer.
3. The flow of the liquid must be laminar. Normally this condition is readily fulfilled.
How these limitations have been avoided or how the difficulties introduced have been overcome in the past and in the research described in this paper will be described in the discussion of the technique.
EXPERIMENT AL
1. Apparatus and Methods
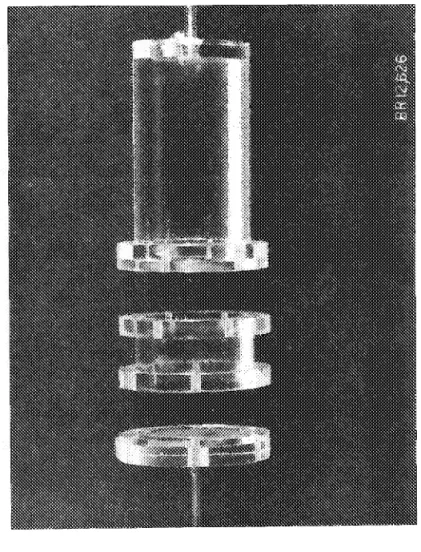
An apparatus (Figures 2 and 3) was designed based on the electro-osmotic technique used by others (22, 23 and 24) for the determination of electro-kinetic potentials. Suitable modifications were made to permit a-c resistance measurements of the plug
before and after electro-osmotic measurements. The centre section containing the soil plug was designed so that undisturbed samples of clay could be pressed into the holder with a perfect fit between the holder wall and the sample.
The technique was that commonly used for preparing natural soil samples for consolidation tests. Figure 4 shows a clay sample being pressed into the sample holder. For semi-fluid
remoulded soils, the sample was contained between two coarse filter paper s that were held in place in the sample holder by lucite retaining rings.
The inner electrodes consisted of coarse platinum gauze (covered with platinum black) held tightly on both sides of the sample by porous stones mounted on the end of glass rods. The platinum lead wires were brought to the outside through a
hole in the glass rods. These electrodes were used only to measure the resistance of the plug. The whole electrode assembly was more than sufficiently porous so as not to impede liquid flow during the electro-osmosis run.
The external potentials were imposed with the outer electrodes. These electrodes were made of platinum gauze tubes. A layer of silver was deposited on the surfaces by electrolysis and they were then subsequently chloridized in O. 1 N hydrochloric acid
solution using an inert cathode.
The entire cell was submerged in a constant temperature bath held at 25° C ±O.1. The liquid flow was measured on both the intake and outflow sides with calibrated capillary tubes mounted on a mirror containing an etched millimetre scale. The potential was applied in one direction for 10 min and then rever sed for a further 10 min. The values for such runs were averaged to obtain a mean value.
The electrical current through the system was held constant with a manually-operated rheostat, based on continuous measurements of the potential drop across a thermostatted standard resistor in the external current. The current selected for each particular run depended on the resistance of the plug and was
arranged to give a O. 5 voltage drop across the plug. The amount of liquid moved through the plug varied between O. 2 and O. 05 cc for a 10 -min period, depending on the electro -kinetic potential of the plug material.
The specific conductivity of the solution in both outer cell compartments was based on the predetermined specific
conductivity of the pore water in the sample. Although the specific conductivity of the liquid throughout the system was the same (in the clay plug and the outer compartments), it was not practicable to simulate the nature of the electrolyte of the pore water.
The bulk pore -water concentration of the plug was deter-mined from the soil immediately adjacent to the position of the sample plug in the soil profile.
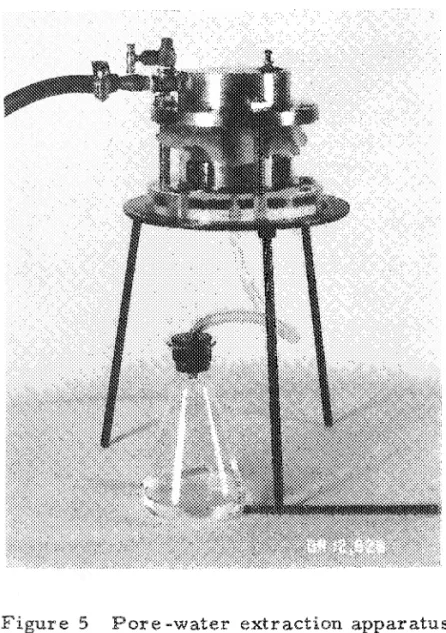
A pressure -membrane apparatus with a rubber bellows was used to carry out the extraction (Figure 5). Sufficient pore water was extracted to fill a standard laboratory conductivity cell so that no dilution was normally necessary.
The resistance of the porous plug was measured in the cell between the inner electrodes with a 60 to 1000 cps conductivity bridge, after the apparatus was in thermal equilibrium at the bath temperature of 25° C. The conductivity of the extracted pore water was also measured with this same instrument. '
Strength tests for. sensitivity calculations were done with the Swedish cone (26). The cone penetration measurement was
repeated several times and averaged. The shear strengths were calculated from this average using the equation
where
T
=
(5)THEORY
T is the shear strength
H is the penetration depth in the metric system Q is the weight of the cone
K is a constant depending on the cone angle.
The electro-kinetic potential can be calculated from the well-known Smoluchowski-Helmholtz equations which are applicable independent of the pad dimensions or of the structure within the pad.
where
4n T1 v A. s
=
eiE k is the electro-kinetic potential,
e and T1 are respectively the dielectric constant and viscosity within the double layer,
v is the electro-osmotic liquid flow rate,
and As is the specific conductivity of the pore liquid.
Values for Asand i must be in cgs electrostatic units. As A. s is usually in ohm- l crnr l it must be multiplied by 9 x lOll, and i, in
amperes, must be divided by O. 33 x 10 -9. The electro -kinetic potential will now be in cgs electrostatic units. Further, v is in cm 3/ sec, 1'1 in poises. To convert Ek to practical units (volts) it must be multiplied by 300.
If A s is the specific conductivity of the bulk solution the electro-kinetic potential calculated may be too low. It is possible, however, to make at least a partial correction for this by evaluating
A s for the solution while in the pore; this takes care of the errors caused by surface conductivity of the solids in the plug. It has been suggested in the literature that a part of the error introduced by excessive surface conduction is not allowed for by the method described in this report. In view of the uncertainties of the values for viscosity and dielectric constant in the double layer, no further attempt beyond that employed elsewhere (22) is warranted.
The value for As in Eq. (6) was determined by Briggs' method (27). The resistance of the plug containing the natural pore water was measured in the cell. After the run was completed,
sufficient KGl salt was added to the sample to bring the salt con-centration of the pore water up to at least O. 1 N, the soil was thoroughly remoulded and the resistance of the plug was measured again. The pore water was then extracted and its specific con-ductivity (A s) determined. The electro -osmotic "cell con stant" was calculated from the product of R O• 1 N KGl (the resistance of the plug with the high salt concentration) and AS O. 1 N KGl . The specific conductivity of the pore fluid at any low salt concentration can then be evaluated as follows:
A
=
s
[R O• 1 N KGl (Plug) ] [AS O. 1 N KGl (Bulk specific conductivity) ] R (Plug at field salt concentration)
(7)
As may be expected for dilute solutions, As is always higher than the specific conductivity of the pore fluid measured in bulk by an amount equivalent to the conduction added by surface conduction.
In addition to the difficulty of allowing adequately for the surface conductivity effect in applying Eq. (6) a further complication
arise s with the electro -osmotic method if the pore radii of the porous plug are of the same order as the thickness of the double layer. It is because of this objection that the electro-kinetic properties of clays are normally determined in dilute solutions by electrophoretic means. Some studies have, however, been carried out on plugs made from small particles of the order of 30 microns. Oakes and Burcik {24} have studied bentonite drilling muds by electro-osmosis up to bentonite concentrations of 13 gm/l.
It was of special interest to study the electro-kinetic potentials of these sensitive clays with their natural structure intact and bathed in the natural soil water. Removal of the soil particles from their natural pore -water environment changes the electro-kinetic potential and there is no way of simulating accurately the pore solution of soil. Hence, if the electro-kinetic potentials to be measured are to be meaningful in terms of the in situ potentials, no other method is possible.
Preliminary calculations, although based on a number of assumptions, permit an evaluation of the ratio between the thickness of the double layer and the pore radius in the clay-water systems studied in this report. Assuming that the clay particles are
randomly oriented and have a surface area of 72 m/gm, at a water content of 0.652 gm/gm of dry soil, and postulating a uniform
distribution of water over the entire surface, the layer of water over
o
the clay surface is 118 A in thickness. At an ionic strength of 1, the
o 0
double layer was shown to be 3.05 A; at 0.1 it is 10 A; and at 0.01 it
o
is 30. 5 A. The ionic strengths of the pore water in the soil are probably of this order, that is, between O. 1 and O. 01. From this it can be seen that the ratios of pore radius range approximately from 4/1 to 11/1. Bull {28} shows that the electro-kinetic potential is depressed for ratios in capillary tubes of less than 15/1. The two factors taken into account were the overlapping of double layers in small pores and the cylindrical shape of the pores when the radius is small. Equation {6} assumes the surfaces to behave as flat parallel condenser s ,
It is concluded from this that the measured electro-kinetic potentials may be lower than the real value, in porous diaphragms consisting of finely-divided particles such as those used in this study.
MATERIALS
The majority of the soils studied were from the so-called marine deposits of the Ottawa-Hull area. Some of the undisturbed
samples were taken in blocks from deep excavations; others were sampled with the Norwegian thin wall sampler or with the Swedish foil sampler. Figure
6
is a map of the area showing the sample locations. Other soils included in this study were from Toulnustouc, Quebec {the site of a recent flow slide}, Burnaby, British Columbia -believed to be a marine clay, and from Seven Sisters, Manitoba - a glacial lacustrine deposit.RESU LTS AND DISCUSSION
1. Preliminary Studies on the Performance of the Electro-osmotic Cell.
From the basic equation used to calculate electro-kinetic potentials, it can be seen that the osmotic flow should be proportional to the current. Based on average flow rates {Table I}, some prelim-inary trial runs were carried out to test the apparatus for this
relation-ship for two different soils. Doubling the current also doubled the flow rate. Shown also in Table I are the flow rates for two samples taken from adjacent locations in the same soil block in order to test the reproducibility of the apparatus and technique. Good agreement between runs was not difficult to achieve on soils that were reasonably homogeneous. Repeat runs on the same soils after several months in storage showed small changes in electro-kinetic potential and also in salt concentration. This is believed to result from ageing the soil at a higher temperature than the in situ temperature. Oxidation of the outside layer s of blocks is quite common after several months of laboratory storage even when heavily waxed and stored in an atmosphere of high relative humidity.
There was some concern, based on the survey of the
literature, that the repression errors on the electro-kinetic potentials would be too severe for the results of the electro-osmosis method to be meaningful due to the smallness of the pores. Such errors would be greatest at low electrolyte concentrations when the diffuse layer thickness is large. The results of the measurements {Table II} show that very large electro-kinetic potentials can be measured by this technique. The potential of the r emoulded soil was 19. 2 mv. This increased to 23. 2 mv when the salts were reduced in the pore water by washing. When finally treated with 1 gm of sodium metaphosphatej 100 gm of dry soil, the potential increased to 64. 5mv. The measured sensitivity values increased appreciably, as expected, with increasing electro-kinetic potentials. Although such experiments do not permit an evaluation of the amount that the electro-kinetic potential is re-pressed in an absolute sense, indications are that large values of
electro-kinetic potential can be measured in this way by treating the soil particles in ways that are known to influence the diffuse double layer. All these experiments were carried out at a constant soil density.
As a further check on the influence of pore size on the measured potentials, the water content may be increased, thus leading to larger pores in these flocculated systems. The change should be reflected in the measured electro-kinetic potentials as the ratio of the pore radius to double -layer thickness is increased. The results in Table III indicate that when the water content was increased (increasing the over -all p o r os ity}, the potentials remained essentially constant within experimental error s, The lowest moisture contents are those encountered in the field. These were increased by nearly four times by adding previously extracted natural pore water of low electrolyte content to which additional electrolyte was added to achieve a high concentration. These experiments were carried out with a very sensitive clay (94-27) and one of lower sensitivity
(94-14). The thickness of the double layer was varied (by electrolyte concentration) and the pore size was varied (by changing the water content). As such changes were not reflected in the electro-kinetic potential, it is concluded that the repression of the electro-kinetic potential by the smallness of the pore size in these soils is not a
serious drawback to using the electro -osmotic technique under the conditions described. Some repression is to be expected, however, in view of the suggestions presented earlier in this report.
2. Electrical Re sistance and Conductance Capacity
Heat conductivity, determined normal and parallel to the direction of sedimentation in clay deposits, is a reasonably sensitive method for establishing the degree of preferred particle orientation. The highest ratio of such coefficients (1. 7) was for a lacustrine
deposit from Seven Sisters, Manitoba. Electrolytic conduction appears to be an even more sensitive method of determining the anisotropy of
clay soils. For the sample previously studied by heat flow methods, the horizontal electrical specific conductivity was 2. 65 x 10- 4 ohm- l crnr L, and the vertical was 0.710 x 10- 3, giving a ratio of 3.8 or
more than twice that given by the heat flow method. The value for the remoulde d soil was 1. 38 x 10-3 which is a little less than the average of the two extremes. It therefore appears that there is an important contribution by surface conductance to the conductance of the pore water.
One suggested method of comparing the relative con-tribution by the surface of particles is to compar e the conductance capacity (A s R) of a clay plug at various salt concentrations (where A s is the bulk specific conductivity of the pore water and R is the measured resistance of clay plugs of a given dimension, fully
saturated with the electrolyte of AS). Because R is r educed at low salt concentrations, owing to the relative importance of the surface conduction path at low electrolyte por e -water contents, the values of ASR decrease with decreasing values for AS. The maximum value of A s R is obtained when the contribution of the surface is reduced to an insignificantly small value compared to the over -all conductivity. It can be seen that the influence of surface conductance also diminishes with a decreasing clay-particle concentration. Figure 7 shows the conductance capacity for two soils at two salt concentrations - at the natural pore -water concentration in the field and at a high salt content of approximately O. 1 N KC!. The lowest point on each curve is for the field moisture content. The difference in conductance capacity is a reflection of the relative importance of surface conductance with the amount of clay and electrolyte present.
It becomes obvious that resistance measurements of the clay-water system do not properly reflect the degree of salinity of the pore water at low salt contents. Such measurements become increasingly dubious with decreasing salt content. Table IV gives the conductance capacity of a marine clay with depth, where the salt
content increases with depth. In Table V are listed the natural
conductance capacity values for sensitive soils from various locations. The second column from the left gives the conductive capacity values when surface conduction adds only a small amount or nothing to the total conduction. As in Table IV, Table V shows that the lower the natural salinity of the soil, the higher is the proportion of conductance along the particle surfaces.
Comparisons of electrical resistance measurements made at right angles (parallel to the direction of the natural sedimentation and at right angles to this) for a well-oriented lacustrine deposit suggested that such measurements might be used as a sensitive indication of the degree of particle orientation in Leda clay.
Unfortunately, for such comparisons to be a meaningful measure of anisotropy, they would have to be made at the same
density and salt content. Although these comparisons cannot indicate the degree of orientation, any difference in vertical and horizontal conductivity indicates the existence of some structural anisotropy. Figure 8 contains the results of all the vertical, horizontal, and re-moulded conductivity measurements on sensitive clays from the
Ottawa-Hull area, plotted against the bulk pore -wat e r conductivity. Although only a few horizontal determinations were carried out, in every case the conduction in this direction was greater than the vertical value; in all cases the remoulded conductances were intermediate in
magnitude.
The experimental results in Figure 8are further evidence that conductivity values of natural soils do not properly reflect
salinity conditions of the pore water, because of the anisotropic con-duction of the structure. Cognizance of this must be taken into
account when using an electrical sounding probe. Large salinity differences, however, would ,be expected to show up .
. A preferred orientation of clay platelets is in fact the favoured alignment of short electrical conductors, if measured parallel to the long axis of the particles. At the same time, the electrolytic path through the pores of the system may be less tortuous than in a randomly-oriented system of clay particles.
Such measurements in two directions of the natural
structure and in a remoulded condition still lead to the possibility that subsequent consolidation has resulted in the sliding of particles into positions that give a preferred alignment of the long axis of clay platelets normal to the direction of loading by the overburden.
3. Detailed Electro-kinetic Studies
The structure of a clay platelet is such that the distribution of charges is not uniform over its entire surface. This is important because these charges are chiefly responsible for the double layer phenomenon in clays. The negative charge along the planar face is probably mainly the result of isomorphous substitution in the clay lattice. The broken bonds around the edges of the platelets can, however, also contribute to the base exchange capacity. Grim (29)
points out that in illites the broken bonds make an appreciable con-tribution to the total cation exchange capacity, and in this connection the effect of pH on edge charge is well recognized.
Although considerable information is now available on the mineralogical nature of the St. Lawrence Lowland clays, no detailed studies have been carried out on the precise origin of the location of the exchange sites.
The non-uniformity of charge distribution around the clay particles, together with some preferential orientation of the long axis in the direction normal to the direction of consolidation, suggests that
the electro-kinetic potentials measured in two directions should also show some anisotropy. The rn e a su r e d electr0 -kinetic potential is
a kind of average potential of all the particle surfaces contributing to electro-osmotic flow in any given direction in which the external potentials are applied.
Based on this, if the external potentials are applied
parallel to the greatest density of planar surfaces, the flow should be higher than when applied at right angles to this direction. These peculiarities are unique to clay samples because of particle shape, a feature which normally does not arise with plugs made of other fine-grained material.
(a) Influence of mechanical and chemical dispersion. -In earlier studies (14) it was observed that the sensitivity of r e rn ou.l de d Leda clay could be increased by mixing in sodium metaphosphate, a common chemical disper santo This phenomenon, observed also by others, has been attributed to an increase in interparticle repulsion brought about by high electro-kinetic potentials. These effects were studied on two samples taken from the same profile but at different depths. The sensitivity measurements determined by the falling cone method for two samples, 94-13 and 94-20, were 30 and 75, respectively.
The quantity of dry sodium metaphosphate added to the soil was based on ear lier results (14) which showed that the minimum shear strength for the remoulded state was obtained by adding
approximately 0.5 gm/IOO gm dry soil. Both soils were low in natural por e water salt content - - les s than 2 gm/l - - although their
sensitivities were entirely different. The results in Table VI bear out the previous hypothesis concerning the increase in electro-kinetic potential brought about by the adsorption of metaphosphate. When
such a disper sant is added to a flocculated clay mass and remoulded, the adsorption of the metaphosphate increases the repulsion forces. By mechanically remoulding the soil, the particles that are held together by Van der Wa.a l s attraction or other forces are separated. Once separated the repulsion is too high to allow the particles to come close enough together to recombine or flocculate. The fluid in the pore spaces distributes itself evenly between the particles.
Instead of particles touching one another to form a cardhouse network, the particles repel each other and behave as separate entities.
Water tends to collect on the surface of the sediment if left standing for long periods, as the packing of particles per unit volume that can be achieved is increased. These new conditions occurred although the moisture content was not increased from its natural field moisture content. The remoulded shear strength was 68 lb/ft 2, and its
un-disturbed strength was 2080 Ib/ft 3. Changes in strength resulting from metaphosphate additions are plotted in Figure 9 as a function of electro-kinetic potential.
(b) Leaching experiments. - In preliminary studies, naturally-occurring electrolytes were washed out of highly-diluted remoulded clays originally containing pore-water salt contents of approximately 10 gm/l. The electro -kinetic potentials increased but such a treatment is entirely different from the natural leaching process visualized by Rosenqvist (lS) that takes place in situ with minimum structural disturbance.
In these experiments, undisturbed samples were cut from these high salt content clays, and electro-kinetic potentials were measured before and after various stages of leaching. The apparatus used for the leaching process is shown in Figure 10. Differential air pressure of less than an atmosphere was applied to the top chamber; no consolidation of the sample occurred during leaching. The effectiveness of leaching was ascertained from
measurement of the resistance of the soil plug and of the conductivity of the leachate. The results are shown in Table VII. Leaching was then continued in one sample with a weak solution of sodium meta-phosphate which again increased the potentials. This was followed by a further leaching period using only distilled water to remove the excess unreacted metaphosphate which caused yet a further increase in the measured potential. These experiments show that leaching of salts from marine deposits does increase the electro-kinetic potential and hence, the sensitivity. That further increases in
sensitivity in the field may result by reaction with naturally-occurring organic dispersants in the leaching fluids seems probable in view of the effect of metaphosphate leaching. It is important to note that such increases in electro-kinetic potential were brought about by leaching without any mechanical disturbance. Unfortunately the full significance of these experiments was not realized at the time and, in consequence, no strength measurements associated with increases in potential were measured in these tests. As the pattern between sensitivity and electro-kinetic potential has already been established for remoulded clays in this paper, this should apply equally well for the leached undisturbed samples.
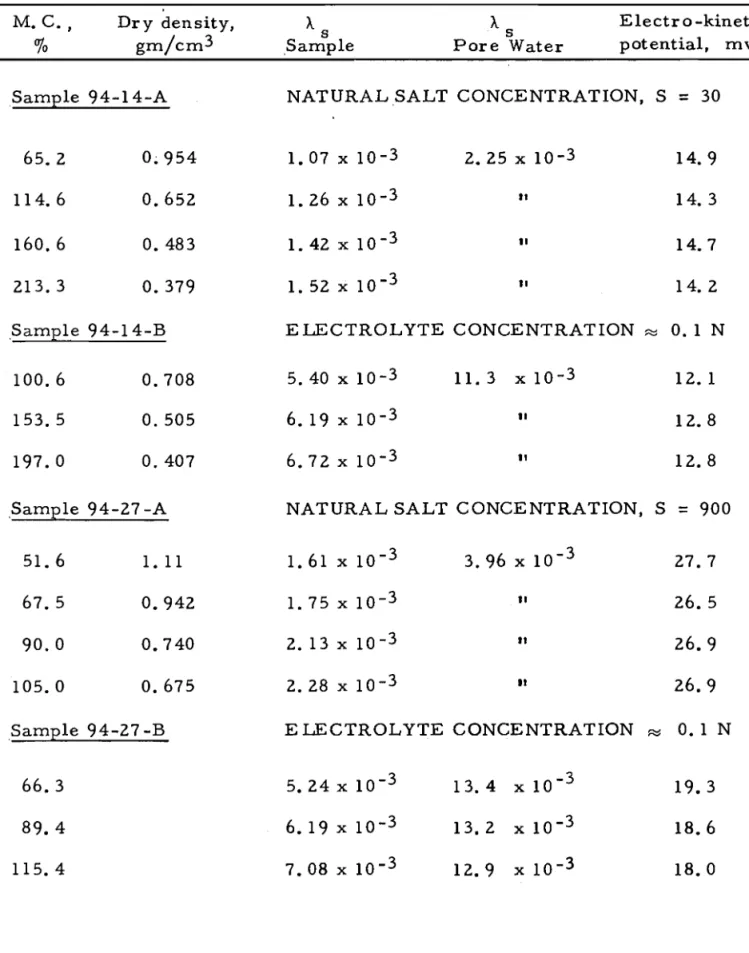
(c) Electro-kinetic potentials of undisturbed soils of varying salt concentration. - Previous experience with cla ys from the Ottawa-Hull area failed to show that sensitivity necessarily increases with decreasing natural pore -water salt concentration (14). The results of the sixteen clays included in the present study support the
24
-conclusions from the earlier studies. At low pore -wat e r salt con-centrations (4 x 10- 3 ohmr l crnr ! in terms of specific conductivity),
the sensitivity may vary considerably. Soils with salt concentrations in excess of this may still have reasonably high sensitivities but do not exceed 75. The general pattern of the relation between sensitivity and natural pore -water salt concentrations is shown in Figure 11. It is not possible for soils with high salt concentrations to develop very high sensitivities because of the flocculating effect of electrolytes at these concentrations. At low salt contents the sensitivities may be
either high or low. The reason for this can be more readily under-stood in terms of electro-kinetic potentials. These results are given in Figure 12.
Taking into account the range in moisture contents, grain-size distribution and per cent clay which have an influence on sensitivity, the pattern presented in Figure 11 is remarkably con-sistent with the theory of interparticle repulsion. The two soils that are notable exceptions to the general pattern seem at first glance to have too high a sensitivity for the low potentials measured. Both have a relatively low surface area and therefore slurries of these materials will have different consistencies than for those from soils that are more finely divided. These results show that sensitivity is related to the electro -kinetic potential. It must be recognized that measurements of potentials by the electro-osmosis technique cannot be claimed to give absolute values. Similarly, there are problems in obtaining good sensitivity measurements but it can be said that sensitivity tends to reflect relative differences in electro-kinetic potential between soils from the Ottawa area.
More complete information on these soils, including sur-face area, natural moisture content, per cent clay-size particles, plasticity indices and depth of sampling is given in Table VIII. Attention is directed to the low surface areas of soils 94-20 -5,
94-27 -1 and 123 -2 -3. Figure 13 gives a plot of the relation between clay content and plasticity index. These agree with earlier studies on similar materials (15).
(d) Adsorption of sodium metaphosphate in relation to structure. - Treatment with sodium metaphosphate was carried out on soil 126 -5 under two very different conditions. This soil has a relatively high pore -wat e r salt concentration (10 gm/l) and soils with this high a salt content have been found only in one location to date in the Ottawa-Hull area.
25
-In the first case, a small amount of clay (50 gm) was remoulded and diluted with severallitres of water. By processes of decantation, filtration and sedimentation the salt was almost com-pletely removed. The original por e -water conductivity was
16.9 x 10- 3 ohm -1 cm -1; after washing it was 0.29 x 10 -3. The sample was redispersed and 0.5 gm/lOO gm of dry soil of sodium metaphosphate was added. The water content was reduced by air pressure to its original field moisture content. The electro-kinetic potential was increased from 19. 7 mv in the remoulded state to 23. 2 in the low salt content state, and to 64.6 after treatment with the dispersant.
When the salt from the same soil was removed by leaching the natural structure with distilled water, followed by an extensive leaching period with sodium metaphosphate and another leaching period to remove excess dispersant, the electro-kinetic potential increased only to 30 mv in contrast to 64. 6 rnv, These results seem to indicate that most of the edge charges are occupied in the natural structure by the edge to face arrangement and not available for exchange. When
structural breakdown was effected by mechanical means preceding the metaphosphate treatment, the face -to -fa c e repulsion was kept high and sodium metaphosphate reacted easily with the exposed edges and the micelle as a whole was negatively charged. If this reasoning is correct, it may be assumed that a significant proportion of the adsorption sites for sodium metaphosphate is on the edges of clay platelets, which seems quite probable based on the evidence presented by Van Olphen (30).
(e) Pore -water salt composition. - Conductivity and gravimetric determinations of the pore-water salt concentrations for several of the deposits were compared. Conductivity measure-ments were carried out at the extracted concentrations without dilution. Gravimetric determinations consisted of weighing the solids after evaporation of a fixed volume of solution at 105° F.
The last column in Table IX gives the specific con-ductivity of the pore water per gram of solid. Such salts are
known to have both organic and inorganic components but no attempt has been made to evaluate accurately the amount of each present.
The change s in the weight conductivity values indicate compositional changes in the solids in the pore water even for one profile but an approximate conversion factor may be calculated to estimate grams of salt per litre from conductivity measurements or vice versa.
26
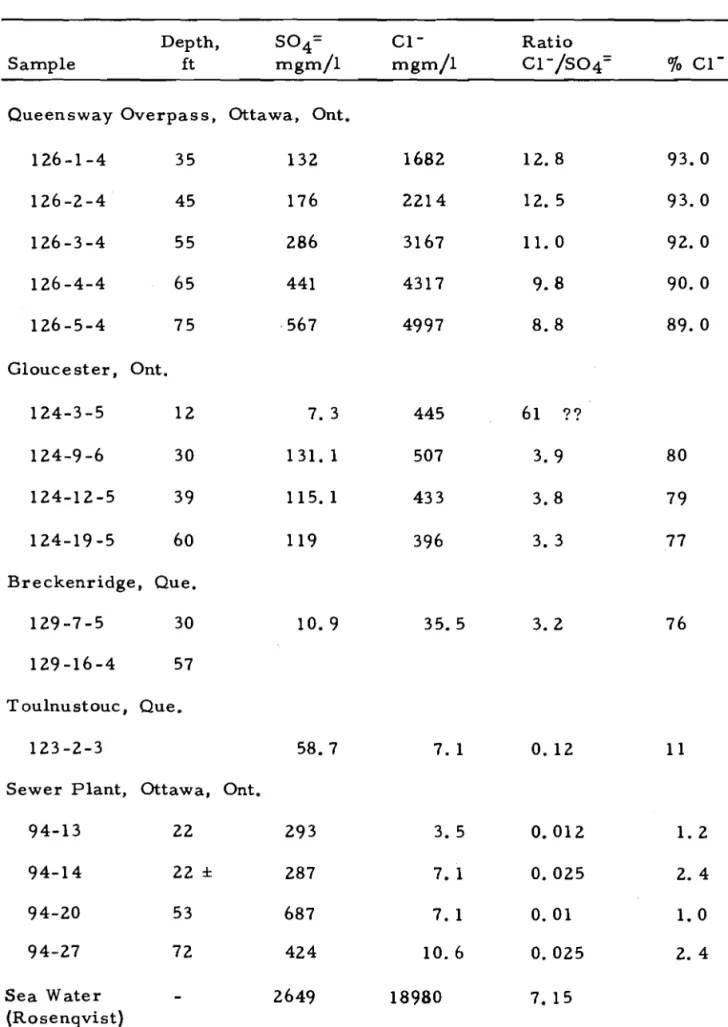
-Table X contains a partial chemical analysis of the extracted pore water in milligrams per litre. Selection of the principal cations and anions was based on earlier stu die s by Rosenqvist (15). A total pore-water analysis showed that in
addition to calcium, sodium, magnesium, potassium, sulphate and chloride, some samples contained moderate amounts of dissolved silica and aluminum. It is interesting to note that the six main
inorganic constituents given in Table X comprised as low as one -half of the total solids based on gravimetric studies, indicating that in addition to silica and aluminum, organic constituents are probably also important in terms of the amount present. Other studies at this laboratory suggest that for soils which contain 2 to 4 gm/l of pore water, one -third to one -half of this is lost by treating the evaporated salt with hydrogen peroxide.
Table XI gives the main cations in terms of
milli-equivalents per litre and the percentages of each ion. At the bottom of the table, the sea water analysis quoted by Rosenqvist (15) is given in the same units.
At the Queensway overpass where the highest known salt content in the Ottawa-Hull area is found, the K+ /Na+ ratio is essentially the same as in the sea water analysis, but the Mg++ /Na+ ratio in terms of equivalents is about one-third and the Ca++ percentage is down,
which may indicate selective adsorption of divalent ions by the clay. Conversely, both the Na+ and K+ contents are above that given in the sea water analysis. In particular, Mg++ is much below the sea water analysis in comparison to Ca++ .
Examination of the S04 = and C'l " analyses of the Queensway overpass in Table XII shows that the ratio of Cl-/S04= decreases with depth. Whether this should be interpreted as selective adsorption or whether the 504 = has been reduced to relatively insoluble sulphides in increasing amounts with depths is still a matter for speculation. At this location the ratio goes from about 9 at 75 ft to about 13 at 55 ft, as compared with a ratio of 7 in sea water.
On the whole, although differences do exist, the pore -water salts resemble sea water. At other locations where the pore water contained much less salt this similarity diminishes, as has been noted previously by Rosenqvist for Norwegian leached marine clays.
Attention is also directed to the constancy of the percentages of the various ions with depth at the Queensway overpass, with the
exception of the deviations already noted in the Cl "
Iso
4= ratios. This fact suggests two things - either this deposit was laid down inincreas-ingly diluted salt water conditions as the sediment was built up, or, if leaching has caused the decreased salt conditions, the mono and divalent ions were leached at the same rate. The former is the more probable answer. Although only the profile from 35 to 75 ft was considered in this study, the increase of salt concentration with depth at this location applies from the present surface to bedrock.
At the Glouce ster location the K+
INa
+ ion ratio is some-what higher than at the Queensway overpass and higher than that in sea water, as are the absolute percentages of K+ and Na+ ions. At this location the sensitivity is much higher for the upper three samples. The deepest sample has more than twice the amount of Ga+ ions and a lower sodium content. These factors lead to a lower sensitivity and a lower electro -kinetic potential. The soil from the Gloucester profile has a high calcite -dolomite content going as high as 12. 5 per cent at the bottom of the profile. This is in contrast to the soil at theBreckenridge site which shows no reaction t'o HGI and is lower in pore-water saIt content but despite this has a lower sensitivity.
At the Sewer Plant location the cause of the lower
sensitivity and electro-kinetic potential at the 22-ft depth, as com-pared with samples from 53 ft and 72 ft , appears to be explained on the basis of the kind of ions in the pore water. In the upper part of the profile the Na+ content is about half that at depth and the percentages of calcium and magnesium are higher. The sample from 'I'oulnu st ouc, Quebec, which is also in the St. Lawrence Lowland region, is believed to have the highest sensitivity ever observed at this laboratory. Its silty nature and high sodium content is thought to contribute to the very high sensitivity observed.
(f) Amount of electrolyte required for flocculating
sensitive clays from the Sewer Plant location. - Flocculation studies have been carried out with samples from two depths at the Sewer Plant location. The upper soil (94-13) from a depth of 22 ft has a
natural pore -wat e r salt concentration of about 1 gmll and a conductivity of 1. 07 x 10- 3 ohm -1 ern -1, a low electro -kinetic potential and a
sensitivity of 30. Sample 94-27 from a depth of 73 ft has a pore-water salt concentration close to 3 gmll giving a conductivity of 2.33 x 10- 3 ohm -1 cm -I, a high electro-kinetic potential and a sensitivity of 600.
Two types of flocculating solutions were used. One contained only NaGI. In the other, the salt mixture was about the same as that given by Rosenqvist for sea water to simulate marine conditions. In each case one gram of soil (calculated on a dry weight basis) was dispersed mechanically in one litre of water in a 1000 cc
graduated cylinder. The results are given in Table XIII. Ten concentrations were used ranging from 0.01 to 5.12 gm/I.
The difference in behaviour to flocculation between the highly sensitive soil (94-29), and the less sensitive soil (94-14) was quite noticeable. despite the fact that the former had a higher pore-water salt concentration. From Table XI it can be seen that sample 94-14 had a much higher divalent cation content in the pore water and therefore also on the exchange positions. Rosenqvist (15) observed similar results. The flocculating response in similar
solutions appear s to depend on the electro -kinetic potential of the soil before it is subjected to the new environment. The electro-kinetic potential in this case may be simply the result of the higher valence ions on the less sensitive soils. which means that the exchange ions do not equilibriate immediately with the ions in the new solution.
In the Na Cl solutions the highly sensitive soil (94-29) showed" a medium amount of flocculation in the 1. 28 gm/l solution after 16 hr. With sample 94-14 the 0.64 gm/l solution caused high flocculation after 16 hr. In the simulated sea water solution.
sample 94-29 showed a medium amount of flocculation in the 0.32 gm/l solution after 16 hr. Sample 94-14 showed a medium flocculation in the O. 16 solution for the same time period. Figure 14 is a photograph of soil 94-14 after a flocculation time of 64 hr for a range of salt
concentration of simulated sea water.
Attention is directed to the low concentration of ions required to bring about flocculation. Recognizing that particle con-centration is important in establishing flocculation times and that those used in the experiment may be quite different than during
sedimentation in nature it may be concluded. nevertheless. that sediments were probably formed in the period when nearly fresh water conditions existed.
(g) Shear strength in sensitive clays. - The nature of the undisturbed shear strength of the so -called marine clay sediments that are found extensively in Norway, Sweden and Finland as well as in the St. Lawrence Lowland region in Canada has been the subject of much speculation. Plotted in Figure 15 are the shear strength values versus electro-kinetic potentials for several different con-ditions at the field moisture content. Point B gives the electro-kinetic potential at the strength of the undisturbed Leda clay at the time of sampling. On remoulding. the shear strength was reduced by at least 30 fold as given by point C. Point A was established by