HAL Id: hal-01677488
https://hal.archives-ouvertes.fr/hal-01677488
Submitted on 8 Jan 2018HAL is a multi-disciplinary open access
archive for the deposit and dissemination of sci-entific research documents, whether they are pub-lished or not. The documents may come from teaching and research institutions in France or abroad, or from public or private research centers.
L’archive ouverte pluridisciplinaire HAL, est destinée au dépôt et à la diffusion de documents scientifiques de niveau recherche, publiés ou non, émanant des établissements d’enseignement et de recherche français ou étrangers, des laboratoires publics ou privés.
Modeling Energy Migration for Upconversion Materials
G. Ledoux, David Amans, Marie-France Joubert, Benoit Mahler, S. Mishra, S.
Daniele, Christophe Dujardin
To cite this version:
G. Ledoux, David Amans, Marie-France Joubert, Benoit Mahler, S. Mishra, et al.. Modeling Energy Migration for Upconversion Materials. Journal of Physical Chemistry C, American Chemical Society, In press, �10.1021/acs.jpcc.7b10113�. �hal-01677488�
Modeling Energy Migration for Upconversion Materials
G. Ledoux,
*
,†D. Amans,
†M.-F. Joubert,
†B. Mahler,
†S. Mishra,
‡S. Daniele,
‡and C. Dujardin
††Univ Lyon, Université Claude Bernard Lyon 1, CNRS, Institut Lumière Matière, F-69622 Lyon, France
‡Univ Lyon, Université Claude Bernard Lyon 1, CNRS, Institut de Recherches sur l’Environnement et la Catalyse de Lyon, F-69622 Lyon, France
*
S Supporting InformationABSTRACT: One of the key issues in upconversion materials is the design of an appropriate complex nanoarchitecture to control energy migration. We propose here a numerical tool based on a Monte Carlo approach capable of modeling the energy migration in particles with diameters of up to a few tens of nanometers. To validate the approach, the obtained results are compared with a wide range of published experimental data. The proposed simulation allows us to guide the optimal design strategies to develop upconverting nanoparticles for light-harvesting applications.
■
INTRODUCTIONUp-conversion is a well -known optical process that allows us to convert the absorption of low-energy photons into higher energy photon emission. It was demonstrated in the late 1950s by Bloembergen.1 A few years later, Auzel2,3 showed that it could be combined with energy transfer. Such a process is known as APTE (addition de photons par transfert d’énergie) or ETU (energy transfer upconversion). It has been widely studied as a fundamental process and is currently commonly used in bioimaging4 and for photovoltaic applications.5 This process may involve various sequences of cooperative effects and energy transfers. Wang et al. demonstrated in 2011 that suitable core−shell structures enable us to force irreversible energy migration of the excited states.6 A great number of applications have been developed in this spirit, and numerous new geometrical designs have been proposed.7−18
These experimental demonstrations are based on the analysis of the emission efficiency measurements for various core−shell structures, where active elements are supposed to be homogeneously distributed. Because energy transfers are strongly dependent on the acceptor−donor distances, natural fluctuations and even gradients of concentrations might have a significant impact. It is crucial to evaluate their effects to properly describe the observed data and to optimize systems. The goal is to design a model accounting for the complex core−shell structure on the atomic scale and containing various interfaces, which cannot be achieved by a simple analytical model of diffusion. Villanueva-Delgado et al. have recently proposed an approach based on the population equation of individual elements, which has been solved,19but the system is then limited to thousands of atoms, which is two orders of magnitude smaller than the particles considered in our work and developed experimentally. We propose here a Monte Carlo (MC)-based simulation to estimate these
energy-transfer efficiencies and trajectories that help in the design of optimized systems on the atomic scale. Such designs of complex structures allow us to fully control the migration of excitation from a sensitizer to an active center, including special functions, such as diode-like layer regarding these migrations, which are crucial in thefield of light harvesting for photocatalysis. Monte-Carlo-based approaches to model upconversion processes have already been proposed, but they have been based on a kinetic approach to model the dynamics of the upconversion.20,21 They therefore evaluated simple geometries considering only one composition. Another work by Wang et al.22is closer to our approach. They modeled the energy migration among the Yb ions sublattice for two different crystalline structure. Compared with our work they only considered first neighbors for the transfer and only homoatomic transfers. Here, instead, we consider all reasonably possible transfers, including those between ions of different nature.
■
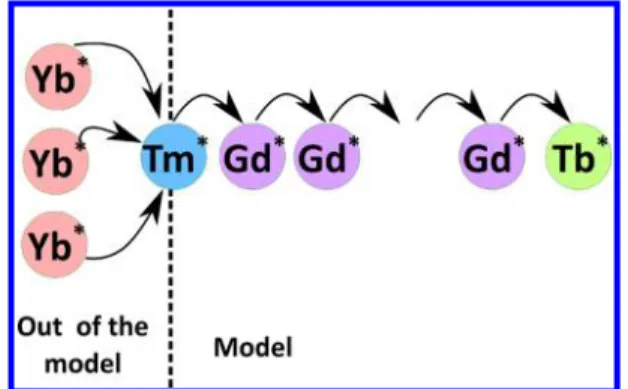
RESULTS AND DISCUSSIONThe proposed model aims in estimating the efficiency of energy migration of a high-energy excited state toward the outer surface of a core−shell nanoparticle (NP) where photocatalysis occurs. In our model, we consider a core made of an up-converting material in which the high-energy excitation state is reached through a primary optical excitation, as schemed inFigure 1. The excitation can then be transported to the outer layer by nonradiative energy transfer. The whole process is called energy migration upconversion (EMU), as introduced by Wang et al.6 When the high-energy excitation
Received: October 12, 2017
Revised: November 29, 2017
Published: December 14, 2017
pubs.acs.org/JPCC
Cite This:J. Phys. Chem. C XXXX, XXX, XXX−XXX
© XXXX American Chemical Society A DOI:10.1021/acs.jpcc.7b10113
reaches the surface, the system is considered as ready for photocatalysis. Despite the fact that we are focusing our attention on converters for the photocatalysis effect, the model can be generalized to other configurations. We are thus considering a core−shell NP containing potentially multiple shells. For validation, we have selected β-NaGdF4, a material
benefiting from abundant literature in terms of energy-transfer and back-transfer efficiency data. It can be doped with various activators, and a core−shell structure having different optical functions can be prepared with the same host, with an epitaxy-like interface, considered as perfect.
We are considering β-NaGdF4 doped with ytterbium and
thulium ions as the core. Ytterbium is present at high concentration to ensure a strong infrared light absorption and to efficiently promote thulium ions into a high excited states (with energy above the 1I6level; see Figure S1). From
that level, Tm3+→ Tm3+energy transfer may occur, but
cross-relaxation leads to step-by-step energy losses, as explained by Liu et al.23Tm3+ → Gd3+ energy transfer can occur between
ions being separated by short distances, while Gd3+ → Gd3+ energy transfer is very efficient. Contrary to Tm3+,
cross-relaxation cannot occur between Gd3+ ions. It is why β-NaGdF4is preferred toβ-NaYF4. Gd3+from the host acts as an
energy mediator through its6Pi, 6Ii, or6Dimultiplets. On the
basis of these processes, the excitation is redistributed among the different ions constituting the structure and the model aims to evaluate the contributions of the different ions to the emission and the fraction of excitation reaching the surface of the nanocrystal. As an indicator of the reached surface, we consider an outer layer ofβ-NaGdF4:Tb3+. Tb3+excited states
show a good resonance with Gd3+ excited states, allowing an
efficient transfer from Gd3+. In addition, our results can be compared with the obtained results from literature through the observed typical green emission intensity from the Tb3+ ions. We particularly focus our attention on the energy migration depending on the compositions of the nanocrystal.
Details of the numerical calculations are given in the
Supporting Information. The various transfer probabilities, namely, Tm3+⇌ Tm3+, Tm3+⇌ Gd3+, Gd3+⇌ Gd3+, Gd3+⇀
Tb3+, and Tb3+ ⇌ Tb3+ used in our Monte Carlo code, are based on the critical radius model considering dipole−dipole interaction. The critical radius Rc is the distance between a
donor and an acceptor for which the energy-transfer probability from donor to acceptor is equal to the radiative probability of the donor. Considering dipole−dipole inter-actions the relative probability of transfer is proportional to (Rc/R)6,24
where R is the real distance from donor to acceptor.
While the physical reason comes from a change of transition rate, using a critical radius approach allows us to avoid the time parameter in the model. The transfer between two species can then be described by only one parameter Rcin addition to the
geometrical layout of the atoms. The parameters Rcstart,
considered as initial values, are obtained from literature and summarized inTable 1. As described later, these initial values are not the best values allowing us tofit the experimental data, and the optimized ones are then deduced (Rcopt).
We selected the Wichmann−Hill random number generator, which offers the best compromise between the calculation speed and randomness. To generate the atomic positions, we use a representative supercell of the considered material described as a list of atomic positions (x,y,z). The supercell is then reproduced in the three directions, generating a cube whose sides are larger than the particle diameter. As previously explained, we applied our model onβ-NaYF4and β-NaGdF4 hosts. According to the CCDCfile 872707, the space group for β-NaGdF4 is P6̅ with unit-cell parameters a = 6.0400(10) Å
and c = 3.6100(6) Å and a cell volume of 114.05(3) Å3.26 Y, Gd, Yb, Tm, and Tb ions are randomly distributed according to the desired composition. The nanocrystal design may include multilayers assuming perfect interfaces. We have considered the cell parameter of NaGdF4, whatever the
content of the metallic ions. Note that the cell parameter of NaYbF4is similar to <2% difference (a = 5.927 Å27) and that
the cores we are considering contain at least 50% of Yb3+.
Because the dipole−dipole transfer is strongly sensitive to the interatomic distance, fluctuations may be observed from one distribution to another. For each composition, we have performed the calculations over 250 randomly prepared geometries. For each generated geometry we evaluated over 5000 tracks the probability for an excitation to reach the surface when the core has been excited. From one step to the next, the transfer probability for a given pair of ion is deduced from Table 1. We neglected all of the transfer with a characteristic time one hundred times higher than the radiative lifetime of the donor. In other words we consider only acceptor ions that are at smaller distances than Rc·991/6from the donor
ion. The distribution of probability density of the remaining process is then normalized to 1 for each donor, thus becoming a distribution of probabilities. The sequence of energy transfers ends when a radiative recombination occurs. Typical tracks are presented in theSupporting Information(Figure S2).
Our model relies on the measure of the critical radius of transfer for the different possible pairs of ions obtained from the literature. These values are nevertheless scarce and even sometimes contradictory for the compositions we are interested in. Kiliaan et al. have studied the energy transfers
Figure 1.Scheme of the process modeled. The upconversion process is not modeled; only the transfer between Tm, Gd, and Tb is modeled.
Table 1. List of Critical Radii Used for the Estimation of the Dipole−Diplole Energy Transfera
D⇌ A Rcstart(nm) Rcopt(nm) Gd⇌ Gd 0.39−0.6 0.75 Gd⇀ Tb 1.38 0.9 Gd⇀ Tm 0.5 Tm⇀ Gd 0.5 Tb⇌ Tb 1.2−1.42 1.4 Tb⇀ Tm 0.75 Tm⇀ Tb 0.5 aR c
startare derived from Kiliaan et al.25
The Journal of Physical Chemistry C Article
DOI:10.1021/acs.jpcc.7b10113
J. Phys. Chem. C XXXX, XXX, XXX−XXX
in Na(Y,Gd)F4doped with Ce3+ and Tb3+. 25
They derived a critical radius for Gd3+to Gd3+between 0.39 and 0.6 nm. At
the same time, they deduced a critical radius for the transfer
5D
3→7F0to7F6→5D4in Tb3+of∼1.42 nm. Later Fournier
et al. found a value of 1.2 nm for the same transfer between Tb3+ ions.28 From the value of transfer rates calculated by Kiliaan et al., one can also deduce a value for the Gd3+to Tb3+
transfer of 1.38 nm. It should be noted, however, that there are huge discrepancies in the literature on the critical radii from one composition to another and even for the same compositions. For instance, the Gd3+ to Gd3+ critical radius
varies from 0.3925to 1.86 nm.29Additionally no critical radius value was found for Tm3+ to Gd3+ energy transfer, but this particular one has a marginal effect, as explained later. Other energy transfer can be discarded. Indeed, Tb3+→ Gd3+cannot
occur because the excited state5D2of Tb3+lies below the Gd3+
excited states. Therefore, once the energy has been transferred to continuum of excited states above the level of terbium ions, the energy will rapidly decrease by phonon emission down to the 5D3 level without any back-transfer capabilities. Similarly
Tm3+ to Tm3+ cross-relaxation can happen but generally only
for excited levels that are below those of gadolinium. Tm3+can, in principle, transfer to Tb3+ ions directly, but no values are available in the literature for transfer from the high states of Tm3+(1D
2or above) to Tb3+.
The Rc values have then been optimized by making a
multiparameter optimization of their values to best fit a number of experimental data detailed below. First, we validated our model considering the structures studied by Wang et al.6
Figure 2 presents the evolution of Tb3+ emission for core− shell−shell nanoparticles in which Tm3+ ions are separated
from Tb3+ions by an undoped NaGdF4layer. This structure is
particularly suitable for the analysis of the transfer between Gd ions. Because the Rc parameters obtained from literature contain some uncertainties, optimization is required. We are thus facing a multiparameter problem. It requires us to order the importance of potential Rc fluctuations on the efficiency.
We have tuned each ion pair’s Rcvalues around the initial value
for several thicknesses of the undoped layer. The evolution shown in Figure 2 allows us to estimate that the maximum sensitivity on the overall efficiency comes from the Gd3+ → Gd3+ critical value. Rc for Tb3+ → Tm3+ transfer plays a role
mainly for weak undoped thicknesses. Then, the Gd3+→ Tb3+
and Gd3+ → Tm3+ R
c values marginally affect the curves.
Finally, we have not detected any significant changes when changing Rcfor the Tm3+→ Gd3+, Tm3+→ Tb3+, and Tb3+→
Tb3+ transfer. The curves are thus not presented here but in
theSupporting Information, Figure S4.
When comparing the simulations to the experimental data, it clearly appears that the Rcvalues proposed by Kiliaan et al.
25
(0.4−0.6 nm) for the Gd3+ to Gd3+ transfer R c are
underestimated. Rcopt of about 0.7 to 0.75 nm better fit the
data. The multiparameter optimized data are listed inTable 1. From the experiments, the evolution of the efficiency as a function of the undoped layer thickness appears monotonic. Nevertheless, the investigated thicknesses were 0, 3, and 5 nm. The simulation highlights that a maximum occurs for thicknesses below 1 nm. On one hand, the process benefits from an increase in the thickness of the undoped layer to limit the back transfer Gd3+ → Tm3+. On the contrary, when the
Gd3+ → Gd3+ transfer probability is high, having a large thickness increases the time spent in the intermediate layer, which is always detrimental to the excitation migration toward the surface, even in perfect crystals. Our model allows us to obtain the optimum thickness of the undoped NaGdF4, which
was not observed by the experiments and which is in the range of a few atomic layers.
To demonstrate the crucial role of the intermediate anti-back-transfer layer, the results can be compared considering NaYF4instead of NaGdF4. Contrary to Gd3+, Y3+cannot lead
to any energy transfer toward other active ions. This intermediate layer thus acts as a passive spacer. Experimental results were published in 2012 by Su et al.16By comparing our results with their experimental data (seeSupplementary Figure
Figure 2.Effect of the change of Rcvalue for different couples of donor−acceptor ions on the evolution of the normalized Tb emission ITb3+(d)/
ITb3+(0) for core−shell−shell nanoparticles. Tm3+and Tb3+are separated by a NaGdF4shell layer of varying thickness d. The blue star points are
derived fromfigure 3d in ref6. The lines are the results obtained from the modeling with varying values of critical radii corresponding to different transfer noted on the upper left or right corner of each layer, while the other Rcvalues are kept at their optimal values (Table 1). The dark yellow
curve corresponds to the best-fit values. Error bars are for 95% confidence intervals (2σ).
DOI:10.1021/acs.jpcc.7b10113
J. Phys. Chem. C XXXX, XXX, XXX−XXX
S5), we can better optimize the values of Gd3+ → Tb3+ and Tb3+→ Tm3+critical radii. From this comparison with the two
experimental multilayered nanoparticles, a reasonable set of critical radius values can be extracted that differ from the initial values summarized in Table 1. Those values are used in the following text.
We have considered up to now a random distribution of the cations according to a defined composition. This statement can, in fact, be not true, and some deviations might be observed due to the segregation that our model is able to reproduce. Wang et al.6 have considered a core made of NaYxGd(1−x)F4:Yb,Tm and a shell of NaGdF4:Tb. It appears that for any reasonable range of critical radius the simulation (red curve) cannot correctly reproduce their data (blue stars), as shown in Figure 3. At low Gd3+ concentration the
simulation predicts a transfer efficiency toward the outer shell one order of magnitude higher than observed. The experimental data would infirst approximation suggest that the transfer Gd3+ → Tb3+ and Tm3+→ Tb3+is less efficient than
expected, but because the critical radii are physical constants, the only acceptable explanation is a modification of the mean Gd3+−Tb3+ and Tm3+−Tb3+ average distances. Such a situation may occur if the distribution of the cations is not homogeneous in the case of the solid solution. We have thus considered hypothetical distribution coefficients to design the nanoparticle for the modeling. Two examples of such a segregation are presented inFigure 3. In thefirst case (green) we suppose that yttrium ions are segregated to the surface and the core thus forms a core−shell system, with the core being made of NaGdF4 and the shell made of NaYF4, according to
the composition of the supposed solid solution. As an illustration, for 25% Gd3+ in the core the intermediate NaYF4 layer has a thickness of 0.75 nm. In the second case (magenta) we consider that Y3+ are segregated together with Yb3+so that the intermediate layer is a NaYF
4:Yb3+(50%). For
the same example as above (25% gadolinium), the thickness of the intermediate layer is then 1.6 nm. The bestfit would be
obtained for an intermediate case where part of yttrium and ytterbium atoms are segregated. It is noteworthy that the thickness of the intermediate layer is still pretty small and therefore difficult to detect experimentally by electron energy loss (EELS) or energy-dispersive X-ray spectroscopy on a transmission electron microscope. Such segregation might be smoother than a real core−shell structure. It nevertheless reproduces the tendency. Apart from the potential distribution coefficient, we have noticed that the fluctuation of geometries coming from the random generation of structures leads to a spread of efficiencies of ∼15% (seeSupplementary Figure S6). It suggests that special configurations of active ion distributions are significantly more efficient.
It is also interesting to compare our model to results obtained for more complex systems such as those developed for photocatalysis. Since 2013 there has been a number of studies on the combination of upconverting nanoparticles with titania particles to create some IR-sensitive photocatalyst. While many teams30−34 have synthesized NaYF4:Yb,Tm
particles decorated with titania nanoparticles, Chen et al.35 have synthesized NaGdF4:Yb,Tm decorated with titania. For
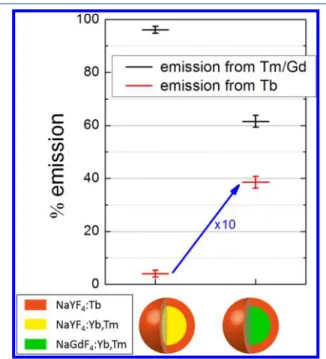
yttrium-based systems, no increased solar-driven photocatalysis was observed. For gadolinium-based systems a strong increase was observed. If we consider two model systems of yttrium-and gadolinium-based core surrounded by a shell of terbium-doped NaYF4 used to mimic the titania, then we observe a huge difference in terbium emission, as can be evidenced on
Figure 4. This stresses the importance of gadolinium energy
transfer to bring as much UV excitation toward the outer layer of the core particle. This phenomenon is paramount for obtaining strong enhancement of photocatalysis. In the case of yttrium-based nanoparticles, excited Tm3+ ions can radiate in
the UV, but most of the emission will lead to visible photons unusable for photocatalysis. On the contrary for Gd3+-based
particles, the higher excited levels of Tm3+ are harvested by gadolinium and transported to titania at the surface.
Figure 3. Evolution of the normalized Tb emission for core−shell nanoparticles with Tm3+-doped NaYxGd(1−x)F4 in the core and
NaGdF4doped with Tb3+in the shell. The blue stars are derived from Figure 3c in Wang et al.6The other lines are the results obtained from the modeling under different conditions. Red circles correspond to NaYxGd(1−x)F4:Yb,Tm@NaGdF4:Tb. For green rhombus, yttrium
ions have been segregated in an intermediate undoped NaYF4layer.
For magenta stars, both yttrium and ytterbium have been segregated. In both segregated structures the overall number of each ions has been kept identical. Error bars are for 95% confidence intervals (2σ).
Figure 4.Amount of Tm3+emission compared with Tb3+plus Gd3+
emission for two different core−shell structures. On the left, NaYF4:Yb,Tm@NaYF4:Tb, and on the right, NaGdF4:Yb,Tm@
NaYF4:Tb. Error bars are for 95% confidence intervals (2σ).
The Journal of Physical Chemistry C Article
DOI:10.1021/acs.jpcc.7b10113
J. Phys. Chem. C XXXX, XXX, XXX−XXX
■
CONCLUSIONSUsing a Monte-Carlo-based simulation describing the energy migration through dipole−dipole transfers in core−shell nanostructures, we were able to reproduce the tendency of the observed data in the literature. It highlights that the already published nanostructures are not yet optimized to reach the best efficacy. In the case of photocatalysis where the photoexcitation has to migrate toward the surface, our study shows that nanolayers of two to three atomic layers of the anti-back-transfer intermediate shell would be more efficient by ∼45% compared with the one already published. This simulation model can be extended to a wide variety of complex nanosystems where energy transfer is a crucial parameter for the targeted application.
■
ASSOCIATED CONTENT*
S Supporting InformationThe Supporting Information is available free of charge on the
ACS Publications website at DOI:10.1021/acs.jpcc.7b10113. Energy levels diagrams of the ions studied, track examples, typical calculation times, additional calculation results, and details of the calculation procedure. (PDF)
■
AUTHOR INFORMATIONCorresponding Author
*E-mail:[email protected]. Tel: +33 (0)4 72 44 83 38.
ORCID
G. Ledoux: 0000-0002-0867-1285
S. Mishra: 0000-0003-2846-4221
Notes
The authors declare no competingfinancial interest.
The software described in this article is available on request to thefirst author.
■
ACKNOWLEDGMENTSWe acknowledge the funding from Agence Nationale de la Recherche through the grant number ANR-17-CE09-0002.
■
REFERENCES(1) Bloembergen, N. Solid State Infrared Quantum Counters. Phys. Rev. Lett. 1959, 2, 84−85.
(2) Auzel, F. Compteur Quantique par Transfert d’Energie de Yb3+
Tm3+ dans un Tungstate Mixte et dans un Verre Germanate. C. R.
Acad. Sci. 1966, 263, 819−821.
(3) Auzel, F. Compteur Quantique par Transfert d’Energie Entre Deux Ions de Terres Rares dans un Tungstate Mixte et dans un Verre. C. R. Acad. Sci. 1966, 262, 1016−1019.
(4) Wang, F.; Banerjee, D.; Liu, Y.; Chen, X.; Liu, X. Upconversion Nanoparticles in Biological Labeling, Imaging, and Therapy. Analyst 2010, 135, 1839−1854.
(5) van Sark, W. G.; de Wild, J.; Rath, J. K.; Meijerink, A.; Schropp, R. E. Upconversion in Solar Cells. Nanoscale Res. Lett. 2013, 8, 81.
(6) Wang, F.; Deng, R.; Wang, J.; Wang, Q.; Han, Y.; Zhu, H.; Chen, X.; Liu, X. Tuning Upconversion Through Energy Migration in Core-shell Nanoparticles. Nat. Mater. 2011, 10, 968−973.
(7) Zhong, Y.; Rostami, I.; Wang, Z.; Dai, H.; Hu, Z. Energy Migration Engineering of Bright Rare-Earth Upconversion Nano-particles for Excitation by Light-Emitting Diodes. Adv. Mater. 2015, 27, 6418−6422.
(8) Li, X.; Liu, X.; Chevrier, D. M.; Qin, X.; Xie, X.; Song, S.; Zhang, H.; Zhang, P.; Liu, X. Energy Migration Upconversion in
Manganese-(II)-Doped Nanoparticles. Angew. Chem., Int. Ed. 2015, 54, 13312− 13317.
(9) Shen, J.; Chen, G.; Vu, A.-M.; Fan, W.; Bilsel, O. S.; Chang, C.-C.; Han, G. Engineering the Upconversion Nanoparticle Excitation Wavelength: Cascade Sensitization of Tri-doped Upconversion Colloidal Nanoparticles at 800 nm. Adv. Opt. Mater. 2013, 1, 644− 650.
(10) Tu, L.; Liu, X.; Wu, F.; Zhang, H. Excitation Energy Migration Dynamics in Upconversion Nanomaterials. Chem. Soc. Rev. 2015, 44, 1331−1345.
(11) Wang, X.; Xu, T.; Bu, Y.; Yan, X. Giant Enhancement of Upconversion Emission in NaYF4:Er3+@NaYF4:Yb3+ Active-core/
Active-shell Nanoparticles. RSC Adv. 2016, 6, 22845−22851. (12) Quintanilla, M.; Ren, F.; Ma, D.; Vetrone, F. Light Management in Upconverting Nanoparticles: Ultrasmall Core/Shell Architectures to Tune the Emission Color. ACS Photonics 2014, 1, 662−669.
(13) Xie, X.; Gao, N.; Deng, R.; Sun, Q.; Xu, Q.-H.; Liu, X. Mechanistic Investigation of Photon Upconversion in Nd3+
-Sensitized Core-Shell Nanoparticles. J. Am. Chem. Soc. 2013, 135, 12608−12611.
(14) Zhou, B.; Yang, W.; Han, S.; Sun, Q.; Liu, X. Photon Upconversion Through Tb3+-Mediated Interfacial Energy Transfer.
Adv. Mater. 2015, 27, 6208−6212.
(15) Chan, E. M.; Levy, E. S.; Cohen, B. E. Rationally Designed Energy Transfer in Upconverting Nanoparticles. Adv. Mater. 2015, 27, 5753−5761.
(16) Su, Q.; Han, S.; Xie, X.; Zhu, H.; Chen, H.; Chen, C.-K.; Liu, R.-S.; Chen, X.; Wang, F.; Liu, X. The Effect of Surface Coating on Energy Migration-Mediated Upconversion. J. Am. Chem. Soc. 2012, 134, 20849−20857.
(17) Huang, Q.; Yu, H.; Zhang, X.; Cao, W.; Yu, J. Upconversion Performance Enhancement of NaYF4:Yb/Tm by Codoping Hf4+ as
Energy Migrator. Huaxue Xuebao 2016, 74, 191−198.
(18) Wen, H.; Zhu, H.; Chen, X.; Hung, T. F.; Wang, B.; Zhu, G.; Yu, S. F.; Wang, F. Upconverting Near-Infrared Light through Energy Management in Core-Shell-Shell Nanoparticles. Angew. Chem., Int. Ed. 2013, 52, 13419−13423.
(19) Villanueva-Delgado, P.; Krämer, K. W.; Valiente, R. Simulating Energy Transfer and Upconversion in β-NaYF4:Yb3+, Tm3+. J. Phys.
Chem. C 2015, 119, 23648−23657.
(20) Chen, X. Y.; Zhuang, H. Z.; Liu, G. K.; Li, S.; Niedbala, R. S. Confinement on Energy Transfer Between Luminescent Centers in Nanocrystals. J. Appl. Phys. 2003, 94, 5559−5565.
(21) Pawlik, G.; Niczyj, J.; Noculak, A.; Radosz, W.; Podhorodecki, A. Multiband Monte Carlo Modeling of Upconversion Emission in Sub 10 nm β-NaGdF4:Yb3+/Er3+ Nanocrystals - Effect of Yb3+
Content. J. Chem. Phys. 2017, 146, 244111.
(22) Wang, J.; Deng, R.; MacDonald, M. A.; Chen, B.; Yuan, J.; Wang, F.; Chi, D.; Hor, T. S. A.; Zhang, P.; Liu, G.; et al. Enhancing Multiphoton Upconversion Through Energy Clustering at Sublattice Level. Nat. Mater. 2013, 13, 157−162.
(23) Liu, Y.; Lu, Y.; Yang, X.; Zheng, X.; Wen, S.; Wang, F.; Vidal, X.; Zhao, J.; Liu, D.; Zhou, Z.; et al. Amplified Stimulated Emission in Upconversion Nanoparticles for Super-Resolution Nanoscopy. Nature 2017, 543, 229−233.
(24) Forster, T. Zwischenmolekulare Energiewanderung und Fluoreszenz. Ann. Phys. (Berlin, Ger.) 1948, 437, 55−75.
(25) Kiliaan, H. S.; Kotte, J. F. A. K.; Blasse, G. Energy Transfer in the Luminescent System Na(Y,Gd)F4:Ce,Tb. J. Electrochem. Soc.
1987, 134, 2359−2364.
(26) Grzechnik, A.; Friese, K. Crystal Structures and Stability of NaLnF4 (Ln = La, Ce, Pr, Nd, Sm and Gd) Studied with Synchrotron Single-crystal and Powder Diffraction. Dalton Trans. 2012, 41, 10258−10266.
(27) Zhang, X.; Wang, M.; Ding, J.; Gao, D.; Shi, Y.; Song, X. The Novel Upconversion Properties of LiYbF4:Er Microcrystals
Com-pared to the Na Counterpart. CrystEngComm 2012, 14, 8357−8360.
DOI:10.1021/acs.jpcc.7b10113
J. Phys. Chem. C XXXX, XXX, XXX−XXX
(28) Fournier, M. T.; Zakaria, D.; Arbus, A.; Cousseins, J. C. Fluorescence Dynamics of the Tb3+Ion in Hexagonal NaYF
4. J.
Less-Common Met. 1989, 153, 79−87.
(29) Blasse, G.; Grabmaier, B. C. Luminescent Materials; Springer: Berlin, 1994.
(30) Wang, W.; Li, Y.; Kang, Z.; Wang, F.; Yu, J. C. A NIR-driven Photocatalyst Based on α-NaYF4:Yb,Tm@TiO2Core-shell Structure
Supported on Reduced Graphene Oxide. Appl. Catal., B 2016, 182, 184−192.
(31) Tang, Y.; Di, W.; Zhai, X.; Yang, R.; Qin, W. NIR-Responsive Photocatalytic Activity and Mechanism of NaYF4:Yb,Tm@TiO2
Core-Shell Nanoparticles. ACS Catal. 2013, 3, 405−412.
(32) Wang, W.; Ding, M.; Lu, C.; Ni, Y.; Xu, Z. A Study on Upconversion UV-vis-NIR Responsive Photocatalytic Activity and Mechanisms of Hexagonal Phase NaYF4:Yb3+,Tm3+@TiO2Core-shell
Structured Photocatalyst. Appl. Catal., B 2014, 144, 379−385. (33) Zhang, Y.; Hong, Z. Synthesis of Lanthanide-doped NaYF4@
TiO2 Core-shell Composites with Highly Crystalline and Tunable
TiO2 Shells Under Mild Conditions and their Upconversion-based
Photocatalysis. Nanoscale 2013, 5, 8930−8933.
(34) Ullah, S.; Hazra, C.; Ferreira-Neto, E. P.; Silva, T. C.; Rodrigues-Filho, U. P.; Ribeiro, S. J. L. Microwave-assisted Synthesis of NaYF4:Yb3+/Tm3+Upconversion Particles with Tailored
Morphol-ogy and Phase for the Design of UV/NIR-active NaYF4:Yb3+/Tm3+@
TiO2 Core@shell Photocatalysts. CrystEngComm 2017, 19, 3465−
3475.
(35) Chen, Y.; Mishra, S.; Ledoux, G.; Jeanneau, E.; Daniel, M.; Zhang, J.; Daniele, S. Direct Synthesis of Hexagonal NaGdF4
Nanocrystals from a Single-Source Precursor: Upconverting NaGd-F4:Yb3+,Tm3+ and Its Composites with TiO2 for Near-IR-Driven
Photocatalysis. Chem. - Asian J. 2014, 9, 2415−2421.
The Journal of Physical Chemistry C Article
DOI:10.1021/acs.jpcc.7b10113
J. Phys. Chem. C XXXX, XXX, XXX−XXX