Contrasting responses within a single neuron
class enable sex-specific attraction in
The MIT Faculty has made this article openly available.
Please share
how this access benefits you. Your story matters.
Citation
Narayan, Anusha; Venkatachalam, Vivek; Durak, Omer; Reilly,
Douglas K.; Bose, Neelanjan; Schroeder, Frank C.; Samuel,
Aravinthan D. T.; Srinivasan, Jagan and Sternberg, Paul W. “
Contrasting Responses Within a Single Neuron Class Enable
Sex-Specific Attraction in Caenorhabditis Elegans .” Proceedings of the
National Academy of Sciences USA 113, no. 10 (February 22, 2016):
E1392–E1401.© 2016 National Academy of Sciences.
As Published
http://dx.doi.org/10.1073/pnas.1600786113
Publisher
National Academy of Sciences
Version
Final published version
Citable link
http://hdl.handle.net/1721.1/108072
Terms of Use
Article is made available in accordance with the publisher's
policy and may be subject to US copyright law. Please refer to the
publisher's site for terms of use.
Contrasting responses within a single neuron
class enable sex-specific attraction in
Caenorhabditis elegans
Anusha Narayan
a,b,c, Vivek Venkatachalam
d, Omer Durak
a,b,e, Douglas K. Reilly
f, Neelanjan Bose
g, Frank C. Schroeder
g,
Aravinthan D. T. Samuel
d, Jagan Srinivasan
a,b,f,1, and Paul W. Sternberg
a,b,1aHoward Hughes Medical Institute, California Institute of Technology, Pasadena, CA 91125;bDivision of Biology and Biological Engineering, California
Institute of Technology, Pasadena, CA 91125;cDepartment of Brain and Cognitive Sciences, McGovern Institute for Brain Research, Massachusetts Institute
of Technology, Cambridge, MA 02139;dCenter for Brain Science and Department of Physics, Harvard University, Cambridge, MA 02138;eNeuroscience
Graduate Program, Massachusetts Institute of Technology, Cambridge, MA 02139;fDepartment of Biology and Biotechnology, Worcester Polytechnic
Institute, Worcester, MA 01609; andgBoyce Thompson Institute and Department of Chemistry and Chemical Biology, Cornell University, Ithaca, NY 14853
Contributed by Paul W. Sternberg, January 22, 2016 (sent for review July 5, 2015; reviewed by Mala Murthy and Douglas Portman) Animals find mates and food, and avoid predators, by navigating
to regions within a favorable range of available sensory cues. How are these ranges set and recognized? Here we show that male Caenorhabditis elegans exhibit strong concentration preferences for sex-specific small molecule cues secreted by hermaphrodites, and that these preferences emerge from the collective dynamics of a single male-specific class of neurons, the cephalic sensory neu-rons (CEMs). Within a single worm, CEM responses are dissimilar, not determined by anatomical classification and can be excitatory or inhibitory. Response kinetics vary by concentration, suggesting a mechanism for establishing preferences. CEM responses are en-hanced in the absence of synaptic transmission, and worms with only one intact CEM show nonpreferential attraction to all con-centrations of ascaroside for which CEM is the primary sensor, suggesting that synaptic modulation of CEM responses is neces-sary for establishing preferences. A heterogeneous concentration-dependent sensory representation thus appears to allow a single neural class to set behavioral preferences and recognize ranges of sensory cues.
population coding
|
electrophysiology|
chemosensation|
calcium imaging
|
animal behaviorT
he chemical senses of taste and smell are an important source
of sensory input for organisms from worms to humans, and
elements of the olfactory system are evolutionarily conserved
across metazoa (1, 2). The neural mechanisms of olfactory
pro-cessing are a subject of active research (3), and much is known
about the encoding of odor identity and concentration (4–6).
However, the issue of ranges of favorable odor concentrations
has been less studied. A reasonable general hypothesis is that
physical sensory limitations set perceptual boundaries, limiting
the range of an animal to respond favorably. However, there are
instances where differences in odor concentrations can have
different meanings: For example, both male and female rodents
produce the same pheromone at different concentrations (7),
and so males need to be able to distinguish between low and high
concentrations. Similarly, a very high concentration might signal
an adverse environment with overcrowding, in which case the
animal is better off looking elsewhere. In such cases, the
con-centration preferences of the animals are tuned to some optimal
value that has a higher probability of a successful outcome. Here,
we show that Caenorhabditis elegans exhibits a striking tuning of
pheromone concentration preferences, and that this
concentra-tion tuning is actively built and maintained by a single class of
male-specific neurons, the cephalic sensory neurons (CEMs).
The nervous system of C. elegans is famously compact, with
302 hermaphrodite neurons grouped into 118 classes based on
morphology and connectivity (8), and 385 male neurons (9–11).
Some classes of neurons are sex-specific (Fig. 1A). Members of a
class are typically distinguished from each other by their relative
anatomical position, such as left/right and dorsal/ventral.
Al-though initially it was Al-thought that members of a class were
functionally similar, several studies have revealed asymmetry in
the responses of members of a class, in particular the sensory
neurons (12, 13).
The four male-specific CEM neurons are considered members
of a single class based on substantial evidence: their fourfold
symmetric location of cell bodies (14), the morphology of their
processes (15), the morphology of their nuclei (16) and their cilia
(17), and their gene expression (15, 18, 19). Presumptive CEMs
die in the hermaphrodite (20) and are under coordinated genetic
control, although the ventral CEMs are less sensitive to
sex-specific apoptosis (16).
Chemical analyses of hermaphrodite secretions by mass
spec-troscopy and 2D NMR specspec-troscopy have discovered a novel
family of small molecules called ascarosides (21–23), which serve
diverse biological functions (24). Certain ascarosides secreted by
hermaphrodites are attractive exclusively to males, which exhibit
strong concentration preferences (23). We mapped the
behav-ioral concentration tuning curve and ablated individual neurons
to identify the mediators of this response. We next performed
electrophysiological, calcium imaging, and genetic analyses to
uncover the sensory coding strategy that allows C. elegans to
Significance
Roundworms carry out crucial sensory behaviors with a rela-tively small number of neurons. We find that male round-worms have strong preferences for particular concentrations of sex-specific small molecule cues secreted by their potential mates. These preferences emerge from the dynamics of a population of four apparently identical male-specific neurons. The response of these sensory neurons is not uniform, with some being excitatory and others inhibitory, and the timing of response varies with concentration. These features allow this single neuronal class to prefer a concentration, and potentially to calculate a derivative of chemical concentration. This pre-viously uncharacterized neural coding strategy might allow nematodes to efficiently use a small number of cells to carry out a crucial computation to enact innate social behaviors.
Author contributions: A.N. and J.S. designed research; A.N., O.D., D.K.R., N.B., F.C.S., and J.S. performed research; A.N., V.V., A.D.T.S., J.S., and P.W.S. analyzed data; A.N., V.V., A.D.T.S., J.S., and P.W.S. wrote the paper; and N.B. and F.C.S. synthesized ascr#3 and #8. Reviewers: M.M., Princeton University; and D.P., University of Rochester Medical Center. The authors declare no conflict of interest.
1To whom correspondence may be addressed. Email: [email protected] or jsrinivasan@
wpi.edu.
This article contains supporting information online atwww.pnas.org/lookup/suppl/doi:10. 1073/pnas.1600786113/-/DCSupplemental.
develop and maintain its concentration preferences. We find
that C. elegans employs a novel mechanism of heterogeneous
responses combined with concentration-dependent kinetics
within a primary sensory neuron class to build a concentration
tuning curve and likely uses synaptic modulation to do so.
Results
Male-Specific CEM Neurons Respond to Both ascr#3 and 8.
Of the
ascarosides tested, we found male C. elegans have the strongest
responses to ascarosides #3 and #8 (ascr#3 and ascr#8,
re-spectively; Fig. 1B), in a two-choice behavioral assay (Fig. 1C).
Mock CEM
Ascaroside
+
+
1 μM ascr#8
A
B
F
E. coliOP50 lawn
5 mm Control Sample Worms Worms O H3C H3C HO HO O O O OH OH O H N CO2H
ascr#8
ascr#3
C
D
0 20 40 60 80 100 120 140 0.1 1 10 100 1000 10000 100000 1000000ascr#8
Control
Ascaroside concn (nM)
Mean Behavioral Dwell time (s)
0 50 100 150 200 250 0.1 1 10 100 1000 10000 100000 1000000
ascr#3
Control
Mean Behavioral Dwell time (s)
Ascaroside (nM)
E
H
*** *** *** *** *** *** *** *** *** Cells ablatedG
Mean Behavioral Dwell time (s)
Mock CEM ASK CEM;
ASK + + + +
1 μM ascr#3
0 100 200 300 400 * *P
A
** ** HSNL HSNR VC1 VC5 VC6 VC4 VC2 VC3 CEMDLCEMDR CEMVL CEMVRCP0 CP1 CP2 CP3 CP4 CP5 CP6 CP7 CP8 CP9 CA1CA2CA3CA4 CA5
CA6 CA7
CA8
CA9Ray Neurons
Inter and Motor Neurons 0 50 100 150 200 250 20 mV 5 s
100 nM ascr#8 10 nM ascr#3 Water
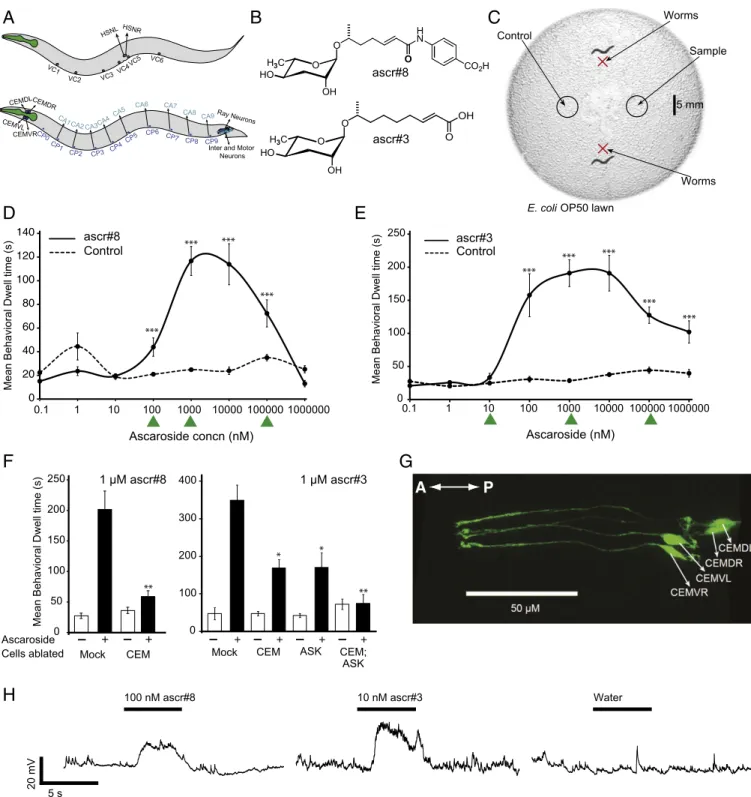
Fig. 1. Male-specific CEM neurons respond to multiple sex-specific ascarosides. (A) Sex-specific neurons in hermaphrodites (Top) and male C. elegans
(Bottom). (B) Two ascarosides that are produced by the hermaphrodite, ascr#8 and ascr#3. (C) Behavioral assay used to determine attractiveness of ascarosides. (D and E) Behavioral tuning curve showing the mean behavioral dwell time at different concentrations of ascr#8 and ascr#3, respectively.
As-terisks indicate responses significantly greater than controls with buffer, P< 0.0001, Student’s t test. Concentrations without asterisks were not significantly
different from controls. Green arrowheads indicate concentrations of ascaroside used for electrophysiological analyses. (F) Ablation of male-specific CEM neurons abolishes attraction to ascr#8 (Left) and reduces attraction to ascr#3 (Right). Data for ascr#3 has been reported by us (23). (G) CEM neurons labeled with green fluorescent protein (GFP) in adult male worm expressing pkd-2::gfp. (H) CEM neurons show responses to ascr#8 and ascr#3 but not to water. Black, example traces.
NEUROSCI
ENCE
Worms had strong preferences for specific concentrations of the
ascarosides, resulting in characteristic behavioral tuning curves
(Fig. 1 D and E). Our cell ablation experiments indicated that
male response to ascr#3 requires two classes of neurons, amphid
sensory neuron class K (ASK) and CEM (Fig. 1F, Right) (23).
ASK is common to both sexes, whereas CEM is a set of four
male-specific cephalic sensory neurons (CEM dorsal/ventral,
left/right; Fig. 1G). Additional ablation experiments indicate that
the response to ascr#8 is mediated primarily by CEMs (Fig. 1F,
Left). We established a whole-cell patch clamp preparation (25,
26) for the CEMs and performed electrophysiological
record-ings. We confirmed that the CEMs responded to both ascr#3
and ascr#8 but not to water (Fig. 1H).
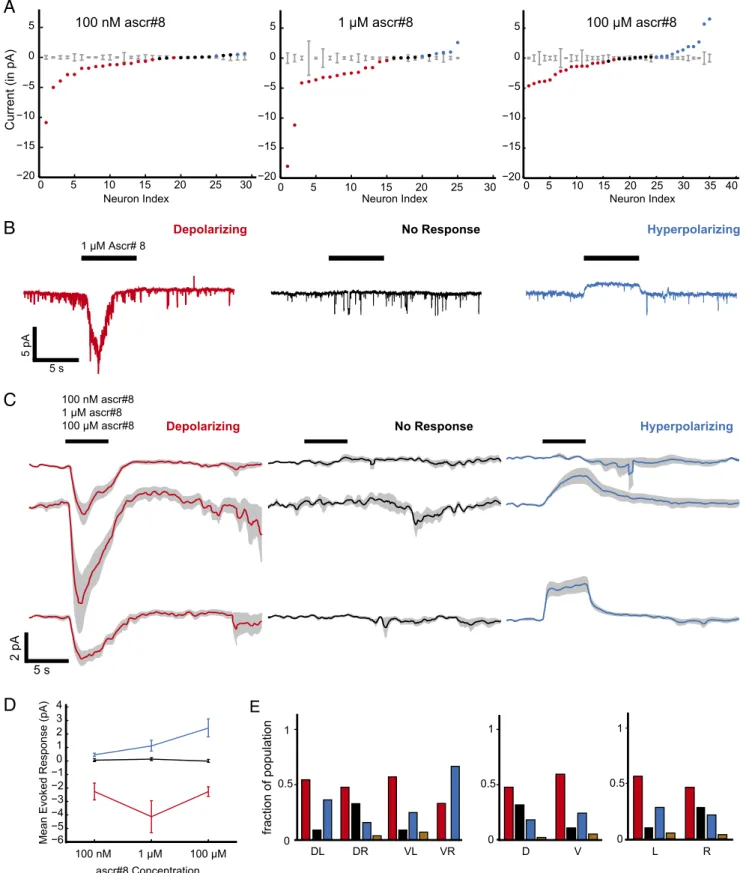
CEM Neurons Show Three Modes of Responses to Ascarosides.
To
measure the evoked electrical currents in CEMs in response to
different concentrations of ascr#8, we performed voltage clamp
recordings. CEM responses fell on a continuum that crosses
zero: while individually recorded neurons had stereotyped
re-sponses, the responses across the population varied in magnitude
and sign (Fig. 2A and
SI Appendix, Fig. S1 A and B
). We
clas-sified the responses as depolarizing, hyperpolarizing, or no
re-sponse (population averaged trials shown in Fig. 2C; example
traces in Fig. 2B and
SI Appendix, Fig. S2
). The depolarizing and
hyperpolarizing responses do not covary across concentration:
The depolarizing current peaks at intermediate concentration of
ascr#8, which is the behaviorally most attractive, whereas the
hyperpolarizing current is strongest at the highest tested
con-centration, which is behaviorally less attractive (Figs. 1D and
2D). The mode of response was depolarizing for approximately
half the cells, regardless of the neuron’s anatomical identity (Fig.
2E; see also
SI Appendix, Fig. S3
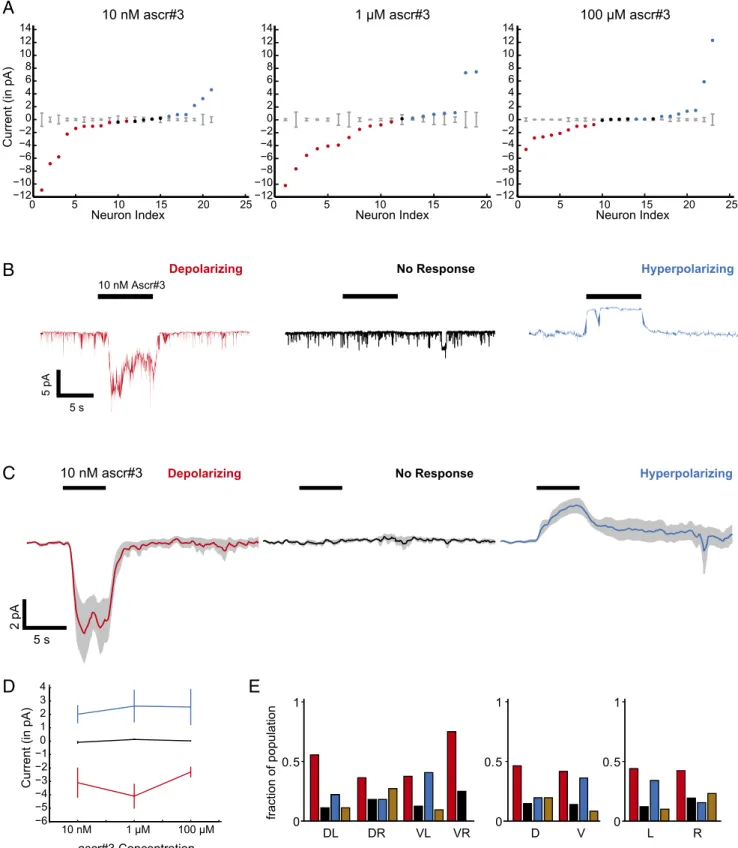
). Similarly, CEM responses to
ascr#3 fall on a continuum crossing zero, and also can be
clas-sified into three modes (Fig. 3 A and C and
SI Appendix, Fig. S1
C and D
; example traces in Fig. 3B and
SI Appendix, Fig. S4
)
uncorrelated with the anatomical identity of the recorded CEM
(Fig. 3D and
SI Appendix, Fig. S5
). The depolarizing current also
peaks at intermediate concentrations corresponding to the
be-havioral tuning curve (Figs. 1E and 3D).
A few neurons had complex responses with both depolarizing
and hyperpolarizing responses, sometimes within the same trial
and sometimes on successive trials (ascr#8, 4/114 neurons, 3.5%
of dataset; ascr#3, 11/90 neurons, 12% of dataset, example
neurons
SI Appendix, Figs. S6 and S7
). To observe membrane
voltage fluctuations evoked by ascaroside application, we
per-formed current clamp recordings of CEMs. We observed large
depolarizations and hyperpolarizations (20–40 mV changes) as
well as fast transient events (Fig. 1 and
SI Appendix, Fig. S8
).
Intact Worms Have Access to Both Depolarizing and Hyperpolarizing CEM Signals.To test whether a given worm could potentially have
access to both depolarizing and hyperpolarizing CEM signals, we
recorded responses to ascr#8 from two different CEMs in the
same worm (
SI Appendix, Fig. S9
), and found that in fact,
dif-ferent neurons in the same worm have difdif-ferent modes of
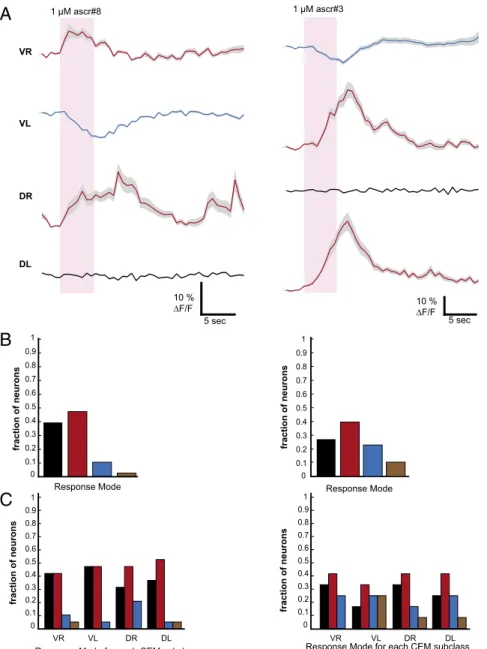
re-sponse in two-thirds of all cases. To confirm that an intact worm
can have simultaneous access to differently signed CEM signals,
we imaged the ascaroside responses of all four CEMs from
dividual worms expressing the genetically encoded calcium
in-dicator GCaMP (Fig. 4 and
SI Appendix, Figs. S10–S13
and
Movies S1
and
S2
). Individual CEMs from a single worm did not
all have the same mode of response to ascaroside (Fig. 4 A and B
and
SI Appendix, Fig. S14
). There were approximately twice as
many cells exhibiting an ascaroside-evoked Ca
2+increase as
there were exhibiting an ascaroside-evoked Ca
2+decrease.
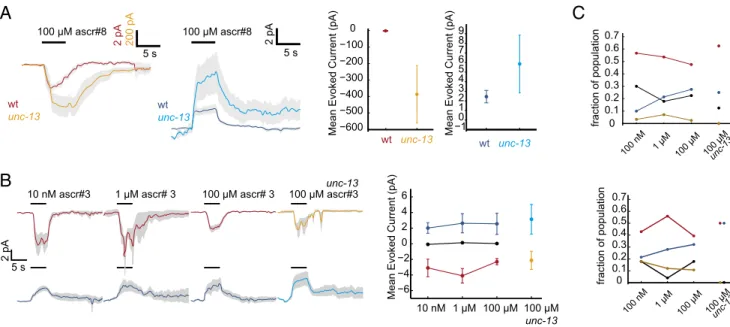
CEM Responses Are Shaped by Synaptic Input.
To test whether
network synaptic input played a role in generating
heteroge-neous CEM responses, we recorded CEM responses to the high
concentrations of ascarosides in worms deficient in UNC-13,
a syntaxin-binding protein that is necessary for fast synaptic
transmission. We used the unc-13(s69) mutant that lacks both
isoforms of UNC-13 and has virtually no fast synaptic
trans-mission (27). We found that the depolarizing responses to
ascr#8 were enhanced in the absence of fast synaptic
trans-mission, confirming our hypothesis that synaptic feedback plays a
role in ascaroside representation (Fig. 5A). Further, we note that
the depolarizing unc-13 responses to ascr#8 were orders of
magnitude larger than wild-type ascr#8 responses, responses to
ascr#3, and nondepolarizing unc-13 responses (Fig. 5A and
SI Appendix, Figs. S2, S4, and S15
). This range suggests that
there could be large-scale synaptic feedback in the processing of
ascr#8 responses.
The hyperpolarizing responses to ascr#8 were also enhanced
by the removal of synaptic transmission, although not to the
same extent as the depolarizing responses (Fig. 5A and
SI Appendix, Figs. S2 and S15A
). This enhancement suggests that
the hyperpolarizing mode of response is not entirely due to fast
synaptic transmission. The hyperpolarizing response could be the
result of specific properties of ascaroside receptors, arise from
peptidergic synaptic transmission, or arise from electrical coupling.
Responses to ascr#3 were sculpted by synaptic input of
op-posing signs although the magnitude of responses was unchanged
(Fig. 5B and
SI Appendix, Fig. S15
). It thus appears that while
processing ascr#3, CEMs could receive both excitatory and
in-hibitory fast synaptic input that is in opposition to the
“mode” of
the neuronal response (
SI Appendix, Fig. S15E
shows the average
synaptic currents). Further, there were only two types of ascr#3
responses recorded in unc-13 animals—depolarizing and
hyper-polarizing (Fig. 5C).
A Single CEM Alone Cannot Generate the Behavioral Tuning Curve.
The mean behavioral dwell time (Fig. 1 D and E) conflates two
factors: one, how much time worms as a group spend in the
ascaroside sample versus the control sample (which can be
dominated by individual dwell-time values) and two, the number
of worms significantly attracted to the chemical. We attempted
to separate these two variables to better understand the
behav-ior. First, to calculate the overall group attraction of worms to
ascaroside versus control, we computed an Attraction Index, by
computing the fraction of time spent in the ascaroside sample of
the entire time spent in sample and control spots for all of the
worms from a given behavioral session. As expected, this
mea-sure was consistently high across all concentrations for ascr#8
(
SI Appendix, Fig. S16A, Left
). Next, to estimate the fraction of
total worms tested that exhibit attraction to ascaroside, we
computed the percentage value of worm forays or runs into the
ascaroside sample that were attractive [i.e., time spent in sample
>
(average time spent in control
+ 2 SDs)]. At intermediate
con-centrations, almost 90% of worm forays into ascaroside zones
were significantly longer than forays into control zones, as
op-posed to only 30% of forays at other concentrations of ascr#8
(Fig. 6A, Left). These results suggest that animals are better able
to restrict their movement to the ascaroside zone for intermediate
concentrations compared with the others.
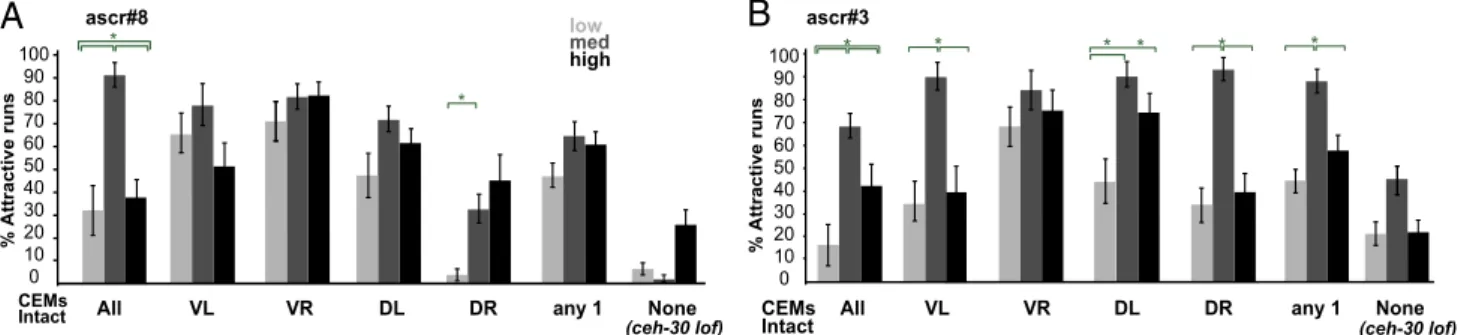
We tested the effect of eliminating all but one of the CEMs on
behavior at different concentrations of ascarosides (“low,”
“medium,” and “high”; green arrows in Fig. 1 D and E). We
found that animals having only one surviving CEM had improved
ascaroside attraction, but a flattened tuning curve—they were
more attracted at low and high concentrations of ascaroside,
rather than less attracted at all concentrations of ascr#8 (Fig. 6A
and
SI Appendix, Figs. S16A and S17
). Having all four CEMs
intact, in effect, appears to allow the worm to effectively locate
an intermediate, possibly preferred concentration, resulting in
100 nM ascr#8 1 μM ascr#8 100 μM ascr#8
A
C
E
100 μM ascr#8
100 nM ascr#8
1 μM ascr#8
5 s
2 pA
0 5 10 15 20 25 30 −20 −15 −10 −5 0 5 0 5 10 15 20 25 30 −20 −15 −10 −5 0 5 0 5 10 15 20 25 30 35 40 −20 −15 −10 −5 0 5 Neuron IndexCurrent (in pA)
Neuron Index Neuron Index
D
Mean Evoked Response (pA) −6 −5 −4 −3 −2 −1 0 1 2 3 4 100 nM 1 μM 100 μM ascr#8 Concentration DL DR VL VR 0 1 D V 0 1 L R
fraction of population
0.5 0.5 0 1 0.5Depolarizing
No Response
Hyperpolarizing
5 s
5 pA
1 μM Ascr# 8
B
Depolarizing
No Response
Hyperpolarizing
Fig. 2. CEM shows three modes of responses to ascr#8. (A) Mean-evoked current responses of neurons to 100 nM, 1μM, and 100 μM concentrations of ascr#8
(columns). Each animal was only tested for a single concentration of ascaroside. A given neuron’s response was classified as depolarizing (red),
hyper-polarizing (blue), or not responsive (black), based on whether the average neural response over the duration of the stimulus exceeded 2× SD of the baseline
(computed over 4 s before stimulus, shown in gray) for that neuron. (B) Example traces of different modes of response for 1μM ascr#8, (C) Average evoked
response over all cells for each mode of response (columns, colors as described for A) at 100 nM, 1μM, and 100 μM concentrations of ascr#8 (rows). Solid line,
population mean traces, gray, SEM. (D) Mean evoked current in each mode at different concentrations of ascr#8. (E) Neural response modes, pooled across concentrations. (Left) Grouped by individual CEM subclass. (Middle) Grouped into dorsal and ventral neurons. (Right) Grouped into left and right neurons. Brown bar represents complex responses (4 of 114 neurons in total).
NEUROSCI
ENCE
10 nM ascr#3
A
C
100 μM ascr#3
10 nM ascr#3
1 μM ascr#3
E
2 pA
5 s
0 5 10 15 20 25 −12 −10 −8 −6 −4 −2 0 2 4 6 8 10 12 14Neuron Index
5Neuron Index
10 15 20 0 5 10 15 20 25−12 −10 −8 −6 −4 −2 0 2 4 6 8 10 12 14
Neuron Index
Current (in pA)
D
−5 −4 −3 −2 −1 0 1 2 3 4 −6 10 nM 1 μM 100 μMCurrent (in pA)
ascr#3 Concentration
L
R
0
0.5
1
D
V
0
0.5
1
DL
DR
VL
VR
0
0.5
1
fraction of population
0 −12 −10 −8 −6 −4 −20 2 4 6 8 10 12 14Depolarizing
No Response
Hyperpolarizing
10 nM Ascr#3
5 s
5 pA
Depolarizing
No Response
Hyperpolarizing
B
Fig. 3. CEM also shows three modes of responses to ascr#3. (A) Mean evoked current responses of neurons to 10 nM, 1μM, and 100 μM concentrations of
ascr#3 (columns). Each animal was only tested for a single concentration of ascaroside. A given neuron’s response was classified as depolarizing (red),
hyperpolarizing (blue), or not responsive (black), based on whether the average neural response over the duration of the stimulus exceeded 2× SD of the
baseline (computed over 4 s before stimulus, shown in gray) for that neuron. (B) Example traces of different modes of response for 10 nM ascr#3, (C ) Average evoked response over all cells for each mode of response (columns) at 10 nM ascr#3. Solid line, population mean traces, gray, SEM. (D) Mean evoked current in each mode at different concentrations of ascr#3. (E ) Neural response modes, pooled across concentrations. (Left) Grouped by individual CEM subclass. (Middle) Grouped into dorsal and ventral neurons. (Right) Grouped into left and right neurons. Brown bar represents complex responses (11 of 90 neurons in total).
the observed concentration-tuning curve. Animals with no intact
CEMs showed little to no response to ascr#8 (Fig. 6A, Right).
We computed similar behavioral metrics for ascr#3 (Fig. 6B
and
SI Appendix, Figs. S16B and S18
). For ascr#3, the tuning
curves are not as disrupted in worms with only one intact CEM
(Fig. 6B, Middle and
SI Appendix, Figs. S16B and S18
). Further,
animals with no intact CEMs show a diminished but intact tuning
curve to ascr#3 (Fig. 6B, Right). This retained tuning possibly
because the male response to ascr#3 is mediated both by CEMs
and another sensory neuron class, ASK (Fig. 1F).
Previous work (28) using a different assay indicated that in
concentrations ranges less than 50 pM, worms can chemotax
in an ascr#3 gradient but not an ascr#8 gradient. This finding
corroborates our results for ascr#8, because we show that the
preferred concentration range for ascr#8 is 1
μM. The fact that
worms can sense an ascr#3 gradient at low concentration further
strengthens our hypothesis that the response to ascr#3 is more
complex, involving other pathways, for instance ones originating
from the neuron ASK.
Given that worms with one intact CEM are no longer able to
distinguish concentrations, it is possible that the combined
het-erogeneous representation of the pheromone across all CEMS
contributes to the encoding of concentration. We analyzed the
kinetics of the CEM responses, by calculating the rise times (time
for current to go from 10 to 90% of peak value) and the
half-widths (interval elapsed between 50% of peak response on rising
and falling phases of response). The hyperpolarizing response
significantly lagged the depolarizing response at intermediate
concentrations of ascr#8, but not at other concentrations (
SI
Appendix, Fig. S19A
). For ascr#3, there is no significant lag
1 μM ascr#8 VR 10 % ∆F/F 5 sec 10 % ∆F/F 5 sec VL DR DL 1 μM ascr#3 0 0.1 0.2 0.3 0.4 0.5 0.6 0.7 0.8 0.9 1 0 0.1 0.2 0.3 0.4 0.5 0.6 0.7 0.8 0.9 1 0 0.1 0.2 0.3 0.4 0.5 0.6 0.7 0.8 0.9 1 0 0.1 0.2 0.3 0.4 0.5 0.6 0.7 0.8 0.9 1A
B
fraction of neurons fraction of neurons
fraction of neurons
fraction of neurons
VR VL DR DL VR VL DR DL
C
Response Mode Response Mode
Response Mode for each CEM subclass Response Mode for each CEM subclass
Fig. 4. GCaMP imaging corroborates heterogeneity of CEM responses to ascarosides within individual worms and within CEM subclasses. (A) Example calcium
transients recorded simultaneously from all four CEMs in one animal exposed to 1μM ascr#8 (Left) and responses of another animal to 1 μM ascr#3 (Right).
A given neuron’s response was classified as depolarizing (red), hyperpolarizing (blue), or not response (black) based on whether the average ΔF/F over the
duration of the stimulus exceeded the average baselineΔF/F + 2× SD preceding stimulus. Solid line, average over 10 trials; gray, SEM. Some cells are
depolarized, whereas others are hyperpolarized. Neural response modes, pooled across animals (B) and grouped by individual CEM subclass (C), for ascr#8
(Left; n= 72 CEMs from 18 worms) and ascr#3 (Right; n = 48 CEMs from 12 worms). Brown bar represents fraction of cells that showed both depolarizing and
hyperpolarizing responses in different subcellular compartments (see Methods for analysis details).
NEUROSCI
ENCE
between depolarizing and hyperpolarizing rise times at
inter-mediate concentrations (
SI Appendix, Fig. S20
).
Discussion
Receptor neurons in a variety of vertebrates and invertebrates
have shown both odor-evoked excitation and inhibition (1, 29,
30), but this finding has not hitherto been reported in C. elegans.
We show that a given ascaroside can evoke both excitation and
inhibition in a single neuron class with some neurons exhibiting
both or neither. The underlying response continuum (Figs. 2A
and 3A) could be generated by ascaroside-evoked currents
sum-ming with oppositely signed synaptic feedback. Variation in the
delay with which the feedback is received at a given CEM could
generate complex or nonresponsive cells. unc-13 mutants, in fact,
have virtually no nonresponsive or complex cells (Fig. 5C and
SI Appendix, Fig. S15F
), supporting the idea of such feedback
summation. However, unc-13-mediated input does not account
for the existence of hyperpolarizing responses in the first place.
We show that peptidergic transmission may play a role, but we
cannot rule out the existence of different ascaroside receptors,
or second-messenger cascades (as in the lobster; ref. 31).
Com-paring response mode probabilities between wild-type and unc-13
animals allows us to estimate the number of CEMs that are
fundamentally depolarizing or hyperpolarizing for each
ascaro-side, and then indicate the manner in which unc-13 input could
change the response mode of these cells (Fig. 7A).
CEM response modes appear to be uncorrelated with
ana-tomical identity. This lack of correlation suggests two possibilities.
One, that CEMs are not members of a single class, However, as
we discussed earlier in the Introduction, there is substantial
ana-tomical and developmental evidence for CEMs to be considered
a single class. The other possibility is that of stochastic expression
of receptors (or other genetically encoded physiological
proper-ties) across the four CEMs in a single worm, as seen elsewhere in
the C. elegans sensory network (13).
We show that synaptic feedback strongly inhibits the CEM
response, and that the absence of three of four CEMs strongly
increases ascaroside attraction at previously nonpreferred
con-centrations. This finding suggests that the CEMs might inhibit
each other. In the current version of the male C. elegans connectome,
the CEMs are not recurrently interconnected (
wormwiring.hpc.
einstein.yu.edu/male/male.php
). However, almost all other classes
of neurons in C. elegans have intraclass gap junctions and there
is extensive recurrent multisynaptic connectivity (8, 32, 33), so a
recurrent inhibition mechanism is not inconceivable.
The concentration tuning curves for C. elegans males thus
appears to be actively set as a result of the combined responses
of the CEM network. Concentration preferences can reflect
important environmental cues and constraints. Very low and very
high concentrations could imply limited resources or overcrowding.
Further, both males and females could produce different levels
of the same pheromone, as seen in mice (7), making some
threshold selection mechanism necessary. In fact, we now have
evidence that male C. elegans also produce some ascr#3 at a
lower concentration (21).
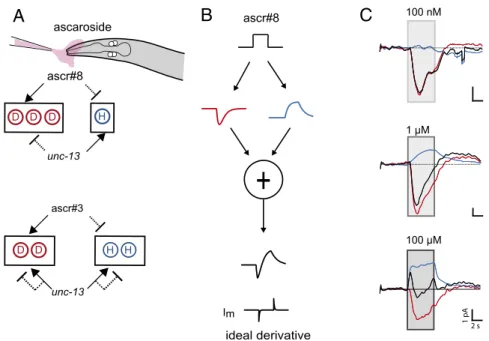
Our analyses of response kinetics show that depolarizing
re-sponses are faster than hyperpolarizing rere-sponses at
intermedi-ate concentrations of ascr#8. Such a combination of fast
excitation followed by slow inhibition could provide a derivative
of the input signal (Fig. 7B), provided that a given worm has
access to both the depolarizing and hyperpolarizing CEM signals
(which we have shown is possible). We found that the composite
CEM response (summing excitatory and inhibitory responses)
resembled a derivative (Fig. 7C) at intermediate but not high or
low concentrations. If the kinetics of heterogeneous CEM
re-sponses at intermediate concentrations allow the computation of
a derivative when the odor turns on or off in time, it could
po-tentially also allow it to detect equivalent on and off boundaries
in space. A worm would then be able to better determine when it
enters and leaves the ascaroside zone and, thus, stay within the
intermediate concentration zone (or on the scent track of a
hermaphrodite). Computing a sensory derivative has been shown
to allow Drosophila larvae to navigate odor gradients (34). A
differentiator motif comprising a fast sensor in an excitatory
pathway and a slow one in an inhibitory pathway has been
de-scribed (35) and has been shown to be a viable strategy in
100 μM 10 nM ascr#3
100 μM ascr#8
1 μM ascr# 3 100 μM ascr# 3 100 μM ascr#3
5 s 2 pA 5 s 2 pA 200 pA 2 pA 5 s wt unc-13 10 nM 1 μM 100 μM unc-13 −6 −4 −2 0 2 4 6
Mean Evoked Current (pA)
−10 1 2 3 4 5 6 7 8 9
Mean Evoked Current (pA)
−600 −500 −400 −300 −200 −100 0
Mean Evoked Current (pA)
B
wt unc-13 100 μM ascr#8A
100 nM 1 μM 100 μM 100 μM unc-13 0 0.1 0.2 0.3 0.4 0.5 0.6 0.7 fraction of population 0 0.1 0.2 0.3 0.4 0.5 0.6 0.7 fraction of population wt unc-13 wt unc-13 unc-13 100 nM 1 μM 100 μM 100 μM unc-13C
Fig. 5. CEM responses are shaped by synaptic input. (A) Lack of synaptic input enhances the ascaroside responses of both depolarizing and hyperpolarizing
CEMs. Blue, wild-type hyperpolarizing response; cyan, unc-13 hyperpolarizing response; orange, unc-13 depolarizing response; red, wild-type depolarizing response. (B) Absence of synaptic input changes the shape but not magnitude of the neuronal response to ascr#3. Mean depolarizing response to ascr#3 shows a double-peaked structure (Top, first and second columns) that vanishes at high concentrations (third column) but reappears in unc-13 animals. In neurons showing a hyperpolarizing response, the double-peaked structure vanishes in unc-13 mutants. (C) Population fraction of each response mode at different concentrations. black, no response mode; blue, hyperpolarizing mode; brown, complex response mode; red, depolarizing mode.
computational models of C. elegans chemotaxis (36). The
com-posite response of CEMs could be faithfully transmitted to the
next stage of processing were the synaptic transfer function
be-tween CEMs and downstream neuron(s) to be graded and tonic,
something that we and others have shown to be the case at other
C. elegans synapses (26, 37). Further, given the variability in
in-dividual response kinetics and synaptic gain, it is probable that
the differentiator
“response” in each worm is slightly different,
possibly leading to a variation in behavioral preferences. Such a
natural variation could be beneficial for the population as a
whole, allowing a more efficient exploration of parameter space.
This pattern is not evident for ascr#3; in particular, the tuning
curves are not as disrupted in worms with only one intact CEM
(Fig. 6B), there is no significant lag between depolarizing and
hyperpolarizing rise times at intermediate concentrations, nor
are the summed CEM responses highly similar to derivatives of
step functions (
SI Appendix, Fig. S20
). As discussed previously,
this lack of disruption in response to ascr#3 could be due to the
fact that the ascr#3 sensing pathway is redundant, including both
CEM and ASK.
For certain odors, it has been shown that the encoding of
concentration in C. elegans is consistent with a labeled-line
hy-pothesis, where different neurons respond to different
concentra-tions (38). Our data suggest a previously uncharacterized strategy
for pheromones, where the same set of four CEMs encode
dif-ferent concentrations in excitatory and inhibitory responses with
varying kinetics. In bacterial models of chemotaxis, it has been
shown that a biphasic response probability (with a short fast
in-crease and a slower depression) allows the bacterium to reconcile
the short-term goal of navigating up chemical gradients with the
long-term goal of aggregating at peaks (39). We propose that the
differences in the kinetics of the dissimilar CEM responses set up
a signal differentiator only at intermediate concentrations, which
could allow the animal to be attracted by all concentrations, yet
actively prefer an intermediate one. Encoding different
con-centrations in dissimilar responses within a single neuronal class
appears to be yet another method (13, 40, 41) by which
nema-todes, with their compact nervous systems, break symmetry to
increase coding capacity.
Methods
Strains. CB1490 him-5(e1490) males were used in our bioassays and in neu-ron ablation experiments. This him-5 mutant segregates XO male progeny by X chromosome nondisjunction during meiosis (42). The CB1490 males were not different from wild-type males in our bioassays. We used strain
CU607 smIs23 [pkd-2::gfp+ pBX]; him-5(e1490) (43) to record responses from
GFP-labeled CEM neurons. We crossed this smIs23 transgene into BC168 [unc-13(s69)] to obtain strain PS6327, used to record responses in the unc-13 synaptic mutant background. To perform calcium imaging experiments, we
used a ppkd-2::GCAMP6 strain; fkEx98[Ppkd-2::GCaMP::SL2::dsRED+ pBX-1];
pha-1(e2123ts); him-5(e1490); lite-1(ce314).
Spot Retention Assays. Assays were done as described (23). For both C.
ele-gans hermaphrodites and males, we harvested 50–60 worms daily at the
fourth larval stage (L4) and stored them segregated by sex at 20 °C overnight to be used as young adults the following day. Because both ascr#3 and ascr#8 are water soluble, we made working solutions of these chemicals in
double distilled water and stored aliquots at −20 °C in 20-μL tubes. As
control, we used double distilled water.
Laser Ablations and Behavioral Assays. We used the late L2 larva stage for ablations of CEM neurons. We chose this larval stage because we were able to identify the cell body of CEM neurons robustly. Males were identified by checking for the presence of the B cell in the tail region (20), and CEM ab-lations were performed as described (23). A successful ablation was con-firmed a few hours after recovery and did not exhibit any damage to neighboring neurons. We ablated CEM neurons at the L4 stage because it has been reported that CEM neurons undergo developmental changes during development (44). We did not observe any difference in response to ascr#3 and ascr#8 by CEM ablations at the L2 or the L4 stage.
We tested 10 ablated individuals in our spot retention assay four times. After each assay, we transferred the ablated animals from the assay plates onto plates containing copper rings for 1 h to reacclimatize. The same procedure was used for the mock-treated animals. The mean time spent in scoring region was computed for both sets of animals. Each ablation set was repeated at least on two separate days.
Electrophysiology. Worms were maintained in well-fed conditions at 20 °C.
Experiments were performed at room temperature (∼20 °C). Approximately
300 adult male C. elegans were picked to a fresh agar plate seeded with
OP50E. coli the day before each recording session. Worms were prepared for
electrophysiology as described (25, 26). A glass pipette filled with ascaroside
(or water for controls) and 9μM sulforhodamine (for visualization) was
positioned near the buccal cavity of the worm, and was connected to a Picopump (WPI) to deliver timed stimulus pulses adjacent to the head of the animal.
Whole-cell patch clamp recordings from 209 neurons (summed across all experiments) are included in this study. Each neuron was only tested for one pheromone condition. Only one neuron was recorded from each worm,
except in the case of a subset (n= 9 worms) where we recorded from 2 CEMs.
Only the first recorded CEM was included in the quantitative analyses to maintain comparability.
Before analysis, we discarded recordings according to the following quality criteria: (i) cell damage or stimulus delivery malfunction (assessed by visual
inspection), (ii ) poor seal resistance values (threshold>1 Gohm), and
(iii) unstable baseline, as measured by the SD of the baseline noise. Recordings where the baseline (4 s before stimulus onset) SD was greater than twice that of the mean population were eliminated.
Solutions: Internal buffer: 143 mM KAsp, 0.1 mM CaCl2, 1.1 mM EGTA,
10 mM Hepes, 15μM sulforhodamine, 4 mM MgATP, 0.5 mM Na3GTP, pH 7.2,
osmolarity∼310 mOsm. External buffer: 145 mM NaCl, 5 mM KCl, 5 mM MgCl2,
1 mM CaCl2, 10 mM Hepes, pH 7.2, osmolarity∼320 mOsm.
Patch electrodes were pressure-polished for a tip resistance of 5–15 MΩ. Recordings were not corrected for junction potential (calculated to be 17 mV for the control solutions used) and series resistance. Clamp voltage for voltage
clamp experiments was−65 mV.
A
B
* 0 10 20 30 40 50 60 70 80 90 100 s n ur e vi t c ar tt A %All VL VR DL DR any 1 None
(ceh-30 lof) (ceh-30 lof)
* CEMs Intact * * * * * * 0 10 20 30 40 50 60 70 80 90 100
All VL VR DL DR any 1 None
CEMs Intact s n ur e vi t c ar tt A % low med high ascr#8 ascr#3
Fig. 6. A single CEM alone cannot generate the behavioral tuning curve. (A) Percentage of all forays that were attractive for ascr#8. From left to right, the
conditions were as follows: intact worms, worms with only one of four CEMs intact (groups 2–5) and the average of all ablated worms, and worms with no
intact CEMs. (B) Similarly organized data for ascr#3. All values mean± SEM. All statistical comparisons performed by using one-way ANOVA with P < 0.05
followed by Tukey’s HSD test for multiple comparisons. See Methods for statistical values.
NEUROSCI
ENCE
Data were acquired at 15 kHz by using the Patchmaster program and a HEKA EPC-10 patch clamp amplifier, and filtered at 3 kHz. Analysis was performed by using custom software written in MATLAB.
Calcium Imaging. We used an inverted spinning disk confocal microscope with a 488-nm laser to image changes in fluorescence in worms expressing
GCaMP6s under the control of pkd-2 5′ regulatory sequences in CEM neurons
fkEx98[Ppkd-2::GCaMP::SL2::dsRED+ pBX-1]; pha-1(e2123ts); him-5(e1490);
lite-1(ce314). Worms were washed in Nematode Growth Medium (NGM) buffer and restrained in a modified version of the microfluidic chip described in ref. 45, with a smaller channel to accommodate male worms. Further im-mobilization to enable the image segmentation of individual CEM neurons and minimize motion artifacts was achieved by adding 100 nM tetramisole to the NGM buffer. Odors were delivered by using a valve manifold with
switching times on the order of 5–10 ms. Worms were stimulated by using
different ascaroside solutions, containing an additional 150 nM fluorescein sodium to visualize the stimulus pulse.
We recorded calcium responses from 34 worms. In each worm, we imaged
a volume 30μm deep encompassing all four CEMs and their processes. To
analyze the fluorescence intensity changes, each movie was annotated for features of interest. Up to four features were annotated for each CEM (dendrite tip, dendrite, soma, and ring neurite), for a total of up to 16 possible features from each worm. Feature volumes of interest were tracked across successive time steps to correct for motion by using custom software written in MATLAB. The fluorescence intensity was computed as the average pixel intensity of the 10 brightest pixels from each frame for each feature. Trials were then stimulus aligned, and each feature was classified as showing
excitation, inhibition, or no response based on whether the average CaΔF/F
over the duration of stimulation exceeded 2 SD of the mean-subtracted baseline. Worms where no features showed any sign of activation across all cells were excluded from further analysis (4 of 34 worms). Each cell was then assigned a response mode as follows. A cell that had nonresponsive features and depolarizing (hyperpolarizing) features was classified as depolarizing (hyperpolarizing). A cell that had both depolarizing and hyperpolarizing features was classified as complex. Example intensity traces described in Fig. 6 are from individual features.
Statistical Analyses. Statistical comparisons were made by one-way analysis
of variance with significance level set at 0.05, followed by post hoc Tukey’s
Honest Significant Difference (HSD) tests. We used unpaired Student’s t tests
with Welch’s correction for comparing attraction of males on the different
ascarosides, *P< 0.01, **P < 0.001, ***P < 0.0001.
Statistical Values for Behavioral Comparisons fromSI Appendix, Fig. S9.
Attraction Index, ascr#8 (SI Appendix, Fig. S14A). There was no significant difference
between attractive indices across concentrations for intact animals at the P<
0.05 level [F(2,37)= 1.73, P = 0.19], animals with only dorsal left (DL) intact
[F(2,40)= 0.49, P = 0.61], only dorsal right (DR) intact [F(2,39) = 2.13, P = 0.13],
only ventral left (VL) intact [F(2,40)= 2.54, P = 0.09], only ventral right (VR) intact
[F(2,40)= 0.19, P = 0.83], or pooled across ablations [F(2,125) = 1.43, P = 0.24].
%Attractive Runs, ascr#8 (Fig. 6A). There was a significant difference for intact
animals across concentrations of ascr#8 at P< 0.05 [F(2, 36) = 44.79 value, P =
1.7e−10]. Post hoc Tukey’s HSD test showed that the %attractive run values
at all concentrations were significantly different from each other. There was
no significant difference for animals with only 1 DL intact [F(2,40)= 1.38, P =
0.2641], 1 VL intact [F(2,40)= 2.19, P = 0.1254] or 1 VR intact [F(2,40) = 0.69,
P= 0.5075). There was a significant difference for animals with only one DR
intact [F(2,39)= 7.12, P = 0.0023]. Post hoc Tukey’s HSD test showed a
sig-nificant difference between concentrations 1 and 2 and concentrations 1 and 3, but not concentrations 2 and 3. Pooling all of the ablations showed a
significant difference at P< 0.05 [F(2,125) = 3.49, P = 0.03]. Post hoc Tukey’s
HSD test showed that there was a significant difference between concen-trations 1 and 2, but none of the other pairs.
Attraction Index, ascr#3 (SI Appendix, Fig. S14B). There was a significant
differ-ence in AI for intact ascr#3 at P< 0.05 [F(2, 88) = 9.76, P = 0.0001]. Post hoc
Tukey’s HSD test showed that the AI values at medium concentrations were
significantly different from both low and high. There was a significant
dif-ference for animals with only 1 DL intact [F(2,42)= 9.61, P = 0.0004]. Post hoc
Tukey’s HSD test showed that the AI values at low concentrations were
significantly different from the medium concentrations. There was a
sig-nificant difference for animals with only 1 DR intact [F(2,42)= 14.55, P =
1.57e-05]. Post hoc Tukey’s HSD test showed that the AI values at medium
concentrations were significantly different from the low as well as high concentrations. There was a significant difference for animals with only 1 VL
intact [F(2,42)= 8.49, P = 0.0008]. Post hoc Tukey’s HSD test showed that
the Attraction Index (AI) values at medium concentrations were significantly different from the low as well as high concentrations. There was no
signif-icant difference for animals with only 1 VR intact [F(2,40)= 1.2, P = 0.3125.
Pooling all of the ablations showed a significant difference at P< 0.05
[F(2,132)= 22.13, P = 5.14e–9]. Post hoc Tukey’s HSD test showed that AI
values at medium concentrations were significantly different from the low as well as high concentrations.
% of Attractive Runs, ascr#3 (Fig. 6B). There was a significant difference in
%Attractive runs for intact animals across concentrations of Ascr#3 at P<
0.05 [F(2, 88)= 16.67, P = 7.26e−7]. Post hoc Tukey’s HSD test showed that the
C
B
ideal derivative
ascr#8
+
Im 100 nM 1 μM 100 μM 1 pA 2 s D D H H unc-13 ascr#3ascaroside
D D D H unc-13ascr#8
A
Fig. 7. A combination of fast excitation and slow inhibition could allow CEM to serve as a signal differentiator at optimal concentrations. (A) Model showing
the grouping of cells and the effect of ascarosides #8 and #3 along with synaptic input. D and H indicate individual CEMs that are hypothesized to be natively depolarized or hyperpolarized in the absence of fast synaptic input. (B) The combination of fast excitation and slow inhibition suggests a role for the CEM class as a signal differentiator. (C) The effective CEM output looks most like a derivative of the input at intermediate concentrations, to which the worm is most attracted. Black traces, sum of the excitatory and inhibitory responses; blue, averaged inhibitory response; red traces, averaged excitatory response.
%attractive run values at all concentrations were significantly different from each other. There was a significant difference for animals with only 1 DL
intact [F(2,42)= 8.05, P = 0.0011]. Post hoc Tukey’s HSD test showed that the
%attractive run values at low concentrations were significantly different from the medium and high concentrations. There was a significant
differ-ence for animals with only 1 DR intact [F(2,42)= 16.08, P = 5.81e−6]. Post hoc
Tukey’s HSD test showed that the %attractive run values at medium
con-centrations were significantly different from the low and high concentra-tions. There was a significant difference for animals with only 1 VL intact
[F(2,42)= 10.53, P = 0.0002]. Post hoc Tukey’s HSD test showed that the
%attractive run values at medium concentrations were significantly different from the low as well as high concentrations. There was no significant
dif-ference for animals with only 1 VR intact [F(2,40)= 0.56, P = 0.5733]. Pooling
all of the ablations showed a significant difference at P< 0.05 [F(2,132) =
30.01, P= 1.8e−11]. Post hoc Tukey’s HSD test showed that % attractive run
values at medium concentrations were significantly different from the low as well as high concentrations.
ACKNOWLEDGMENTS. We thank Ofer Mazor, Michale Fee, and Vivek Jayaraman for helpful suggestions; Scott Emmons for sharing unpublished information on the male connectome; and Robyn Lints for the generous gift of the ppkd-2::GCAMP6 strain. This work was supported in part by National Science Foundation Grant PHY-0957185 and National Institutes of Health (NIH) Grant 8DP1GM105383-05 (to A.D.T.S.), startup funds from Worcester Polytechnic Institute (to J.S.), NIH Grant GM085285 (to F.C.S. and P.W.S.), and the Howard Hughes Medical Institute, with which P.W.S. is an Investigator.
1. Ache BW, Young JM (2005) Olfaction: Diverse species, conserved principles. Neuron 48(3):417–430.
2. Bargmann CI (2006) Comparative chemosensation from receptors to ecology. Nature 444(7117):295–301.
3. Wilson RI (2008) Neural and behavioral mechanisms of olfactory perception. Curr Opin Neurobiol 18(4):408–412.
4. Jayaraman V, Laurent G (2009) Olfactory system: Circuit dynamics and neural coding in the locust. Encyclopedia of Neuroscience, ed Squire LR (Academic, Oxford), pp 187–196. 5. Mori K, Nagao H, Yoshihara Y (1999) The olfactory bulb: Coding and processing of
odor molecule information. Science 286(5440):711–715.
6. Soucy ER, Albeanu DF, Fantana AL, Murthy VN, Meister M (2009) Precision and di-versity in an odor map on the olfactory bulb. Nat Neurosci 12(2):210–220. 7. Brennan PA, Keverne EB (2004) Something in the air? New insights into mammalian
pheromones. Curr Biol 14(2):R81–R89.
8. White JG, Southgate E, Thomson JN, Brenner S (1986) The structure of the nervous system of the nematode Caenorhabditis elegans. Philos Trans R Soc Lond B Biol Sci 314(1165):1–340.
9. Jarrell TA, et al. (2012) The connectome of a decision-making neural network. Science 337(6093):437–444.
10. Sammut M, et al. (2015) Glia-derived neurons are required for sex-specific learning in C. elegans. Nature 526(7573):385–390.
11. Sulston JE, Horvitz HR (1981) Abnormal cell lineages in mutants of the nematode Caenorhabditis elegans. Dev Biol 82(1):41–55.
12. Suzuki H, et al. (2008) Functional asymmetry in Caenorhabditis elegans taste neurons and its computational role in chemotaxis. Nature 454(7200):114–117.
13. Wes PD, Bargmann CI (2001) C. elegans odour discrimination requires asymmetric diversity in olfactory neurons. Nature 410(6829):698–701.
14. Sulston JE, Schierenberg E, White JG, Thomson JN (1983) The embryonic cell lineage of the nematode Caenorhabditis elegans. Dev Biol 100(1):64–119.
15. Barr MM, et al. (2001) The Caenorhabditis elegans autosomal dominant polycystic kidney disease gene homologs lov-1 and pkd-2 act in the same pathway. Curr Biol 11(17):1341–1346.
16. Schwartz HT, Horvitz HR (2007) The C. elegans protein CEH-30 protects male-specific neurons from apoptosis independently of the Bcl-2 homolog CED-9. Genes Dev 21(23):3181–3194.
17. Hurd DD, Miller RM, Núñez L, Portman DS (2010) Specific alpha- and beta-tubulin isotypes optimize the functions of sensory Cilia in Caenorhabditis elegans. Genetics 185(3):883–896.
18. Barr MM, Sternberg PW (1999) A polycystic kidney-disease gene homologue required for male mating behaviour in C. elegans. Nature 401(6751):386–389.
19. Wang J, et al. (2015) Cell-specific transcriptional profiling of ciliated sensory neurons reveals regulators of behavior and extracellular vesicle biogenesis. Curr Biol 25(24): 3232–3238.
20. Sulston JE, Horvitz HR (1977) Post-embryonic cell lineages of the nematode, Caeno-rhabditis elegans. Dev Biol 56(1):110–156.
21. Izrayelit Y, et al. (2012) Targeted metabolomics reveals a male pheromone and sex-specific ascaroside biosynthesis in Caenorhabditis elegans. ACS Chem Biol 7(8):1321–1325.
22. von Reuss SH, et al. (2012) Comparative metabolomics reveals biogenesis of ascaro-sides, a modular library of small-molecule signals in C. elegans. J Am Chem Soc 134(3): 1817–1824.
23. Srinivasan J, et al. (2008) A blend of small molecules regulates both mating and de-velopment in Caenorhabditis elegans. Nature 454(7208):1115–1118.
24. Ludewig AH, Schroeder FC (2013) Ascaroside signaling in C. elegans. WormBook 1–22. 25. Goodman MB, Hall DH, Avery L, Lockery SR (1998) Active currents regulate sensitivity
and dynamic range in C. elegans neurons. Neuron 20(4):763–772.
26. Narayan A, Laurent G, Sternberg PW (2011) Transfer characteristics of a thermo-sensory synapse in Caenorhabditis elegans. Proc Natl Acad Sci USA 108(23):9667–9672. 27. Richmond JE, Davis WS, Jorgensen EM (1999) UNC-13 is required for synaptic vesicle
fusion in C. elegans. Nat Neurosci 2(11):959–964.
28. Choe A, et al. (2012) Ascaroside signaling is widely conserved among nematodes. Curr Biol 22(9):772–780.
29. Ache BW (2010) Odorant-specific modes of signaling in mammalian olfaction. Chem Senses 35(7):533–539.
30. Buck LB (1996) Information coding in the vertebrate olfactory system. Annu Rev Neurosci 19:517–544.
31. Boekhoff I, Michel WC, Breer H, Ache BW (1994) Single odors differentially stimulate dual second messenger pathways in lobster olfactory receptor cells. J Neurosci 14(5 Pt 2): 3304–3309.
32. Chen BL, Hall DH, Chklovskii DB (2006) Wiring optimization can relate neuronal structure and function. Proc Natl Acad Sci USA 103(12):4723–4728.
33. Reigl M, Alon U, Chklovskii DB (2004) Search for computational modules in the C. elegans brain. BMC Biol 2:25.
34. Schulze A, et al. (2015) Dynamical feature extraction at the sensory periphery guides chemotaxis. eLife 4:4.
35. Goentoro L, Shoval O, Kirschner MW, Alon U (2009) The incoherent feedforward loop can provide fold-change detection in gene regulation. Mol Cell 36(5):894–899. 36. Dunn NA, Conery JS, Lockery SR (2007) Circuit motifs for spatial orientation behaviors
identified by neural network optimization. J Neurophysiol 98(2):888–897. 37. Lindsay TH, Thiele TR, Lockery SR (2011) Optogenetic analysis of synaptic transmission
in the central nervous system of the nematode Caenorhabditis elegans. Nat Commun 2:306.
38. Yoshida K, et al. (2012) Odour concentration-dependent olfactory preference change in C. elegans. Nat Commun 3:739.
39. Clark DA, Grant LC (2005) The bacterial chemotactic response reflects a compromise between transient and steady-state behavior. Proc Natl Acad Sci USA 102(26): 9150–9155.
40. Pierce-Shimomura JT, Faumont S, Gaston MR, Pearson BJ, Lockery SR (2001) The homeobox gene lim-6 is required for distinct chemosensory representations in C. elegans. Nature 410(6829):694–698.
41. Yu S, Avery L, Baude E, Garbers DL (1997) Guanylyl cyclase expression in specific sensory neurons: A new family of chemosensory receptors. Proc Natl Acad Sci USA 94(7):3384–3387.
42. Hodgkin J, Horvitz HR, Brenner S (1979) Nondisjunction mutants of the nematode Caenorhabditis elegans. Genetics 91(1):67–94.
43. Peden E, Kimberly E, Gengyo-Ando K, Mitani S, Xue D (2007) Control of sex-specific apoptosis in C. elegans by the BarH homeodomain protein CEH-30 and the tran-scriptional repressor UNC-37/Groucho. Genes Dev 21(23):3195–3207.
44. White JQ, et al. (2007) The sensory circuitry for sexual attraction in C. elegans males. Curr Biol 17(21):1847–1857.
45. Chronis N, Zimmer M, Bargmann CI (2007) Microfluidics for in vivo imaging of neu-ronal and behavioral activity in Caenorhabditis elegans. Nat Methods 4(9):727–731.
NEUROSCI
ENCE