HAL Id: hal-01965455
https://hal-amu.archives-ouvertes.fr/hal-01965455
Submitted on 26 Dec 2018HAL is a multi-disciplinary open access archive for the deposit and dissemination of sci-entific research documents, whether they are pub-lished or not. The documents may come from teaching and research institutions in France or abroad, or from public or private research centers.
L’archive ouverte pluridisciplinaire HAL, est destinée au dépôt et à la diffusion de documents scientifiques de niveau recherche, publiés ou non, émanant des établissements d’enseignement et de recherche français ou étrangers, des laboratoires publics ou privés.
Distributed under a Creative Commons Attribution| 4.0 International License
The effect of hydrogen bonding on the nonadiabatic
dynamics of a thymine-water cluster
Hans Lischka, Mario Barbatti, Farhan Siddique, Anita Das, Adelia J.A.
Aquino
To cite this version:
Hans Lischka, Mario Barbatti, Farhan Siddique, Anita Das, Adelia J.A. Aquino. The effect of hydrogen bonding on the nonadiabatic dynamics of a thymine-water cluster. Chemical Physics, Elsevier, 2018, 515, pp.472-479. �10.1016/j.chemphys.2018.07.050�. �hal-01965455�
1
The effect of hydrogen bonding on the nonadiabatic dynamics of a thymine-water cluster
Hans Lischka,1* Mario Barbatti,2 Farhan Siddique,1 Anita Das,1 Adelia J. A. Aquino1*
1School of Pharmaceutical Sciences and Technology, Tianjin University, Tianjin 300072, P.R. China
2 ABSTRACT
Surface hopping photodynamics simulations have been performed on a cluster of thymine interacting with six water molecules (T(H2O)6). The second-order algebraic diagrammatic construction method (ADC(2)) has been used for calculating the required electronic energies and excited state gradients. Comparison with the previously performed photodynamics for the isolated thymine (Molecules 21 (2016) 1603) shows a similar global behavior and the central role of the S1(nπ*) minimum for further long-term dynamics. The main difference comes from the destabilization of the nπ* state by hydrogen bonding, which leads to a significantly enhanced conversion rate from the bright S2(ππ*) state to S1(nπ*) for the T(H2O)6 cluster. On the other hand, the decay time to S0 and the trapping in S1 is significantly increased. Due to the localized character of the lone pair orbital involved in the nπ* transition at one oxygen atom, specific changes in the structure of the hydrogen bonded network are observed. Since the hydrogen bonding of the water molecules connected to that oxygen atom is specifically weakened, they show dissociations from thymine during the photodynamics, starting within 30 fs after electronic excitation of thymine.
3
1. Introduction
The photodynamics of the DNA nucleobase thymine (T) still poses many puzzling questions concerning the origin of the experimentally observed decay processes. Most common is a scheme based on three time constants, one describing a short sub-picosecond process, a second one of about 6 ps, and a third one with about 300 ns [1-10]. Mechanistic investigations based on theoretical calculations do not provide the desired clarity since several strongly differing explanations have been offered. Because of the long ps time constant as compared to the other nucleobases, the search for “trapping states” characterizes many of the mentioned investigations.
In the gas phase, the thymine UV spectrum is characterized by a bright S2 (ππ*) state with a dark S1 (nπ*) state below. The most popular model for explaining the different time constant assigns the fast one to the transition from the S2 (ππ*) to the S1 (nπ*) state with trapping in the latter state [11, 12]. An additional trapping step in the S2 state has been proposed based on the complete active space self-consistent field (CASSCF) surfaces and multiple spawning dynamics [13]. Surface hopping dynamics simulations based on CASSCF surfaces confirmed this trapping in the S2 (ππ*) state [14, 15], but also demonstrated that this step itself would only account for a delay of about 2 ps. Even though CASSCF should describe conical intersections correctly, it is considered to overestimate the stability of the S2 state and thus, the reported delay time of 2 ps is certainly much too long. An alternative explanation for the fast time step has been put forward already with a direct conversion of the S2 (ππ*) state to the ground state based on the analysis of ab initio potential surfaces [16, 17] and surface hopping dynamics using semi-empirical methods [18]. However, interpretations diverged for the ps step that was predicted to be a delayed S2 (ππ*) deactivation [16] or a sequential S2 (ππ*) S1 (nπ*) S0 deactivation [17] by the ab initio calculations. In the semiempirical simulations [18], a S2 (ππ*) S1 (nπ*) S0 step was found as well, but it was predicted to occur at the sub-ps time scale. The probably most balanced photodynamical simulation has been reported by Stojanović et al. [19] based on the second-order algebraic diagrammatic construction (ADC(2)) method. A long-lived triplet ππ* state has been invoked to explain the ns process [1, 9, 20-22], which will not be considered further on here.
4 The above characterization has been given primarily for the gas phase. It is of great interest to know in which way these processes are also of relevance in condensed phase or for thymine/water clusters. In the femtosecond transient absorption study of pyrimidine bases in aqueous solution by Hare et al. [23], two decay times have been found for thymine, a fast one at 0.72 and 2.8 ps depending on the probe wavelength and a slow one of 30 ps. The fast time step has been assigned to direct conversion to the ground state via a * relaxation. The second time step has been assigned to a dark state tentatively assigned to the nπ* state. Measurement of the decay times for aqueous thymine by means of fluorescence decay performed by Gustavsson et al. [24] show an ultrafast life time of 195 fs and a longer one at 6.33 ps.
Time-of-flight mass spectroscopy (TOF-MS) combined with pump-probe techniques have been used to investigate the deactivation properties of thymine/water clusters after UV excitation [5, 25-27]. The ns life time behavior was studied by He et al. [25] and Busker et al. [26]. González-Vázquez et al. [5] found in their experiments for thymine in the gas phase three time constants (1 100 fs, 2 = 7 ps, and 3 > 1 ns) and for the T(H2O)n (n =1,2) clusters a
dominating 100 fs time constant. The contribution of the 7 ps transient was small in TH2O and absent in T(H2O)2 clusters. No long-lived component was observed. Characteristic differences in the photodynamical behavior of complexes of 1-methylthymine (mT) with one water molecule bound via a pair of cyclic hydrogen bridges to different regions of mT were observed by Nosenko et al. [27].
A crucial role in the rationalization of the photodynamical behavior of T/water clusters is played by the relative location of the nπ* and ππ* states for the vertical excitation in the Franck-Condon region. The destabilization of the nπ* state in relation to the ππ* state by hydrogen bonding is well documented by several investigations [27-30]. The coupled cluster singles and approximate doubles (CC2) calculations of Ref. [29] show for the isolated thymine that the nπ* state is 0.29 eV lower than the ππ* state whereas in thymine surrounded by six water molecules the energetic ordering of the two states is reversed. The ππ* state is now 0.13 eV lower. It should be noted that by the interaction with water molecules not only the nπ* state is destabilized but that also the ππ* state is slightly stabilized. Since the nπ* state is an important intermediate for the triplet formation, its destabilization is expected to decrease the triplet
5 quantum yield. The sensitivity of the relative order of the nπ* and ππ* due to the hydrogen bonding and the photodynamical consequences thereof have been also discussed by Nosenko et al. [27] for mT and for 2-aminopurine by Lobsiger et al. [31] and Barbatti and Lischka [32]. Photodynamical simulations provide the most direct insight into the photodecay mechanisms and their time scales. The above-mentioned experience with CASSCF artifacts observed in multiple spawning [13] and surface hopping [14, 15] dynamics of thymine, as well as the problems with a large range of density functionals used in time-dependent density functional theory (TD-DFT) of adenine [33], demonstrate the care necessary in selecting an appropriate quantum chemical method to be used in the simulations.
Comparison with higher level methods and available spectroscopic data [32, 33] for nucleobases but also the good general performance for the calculation of excited states [34-36] led us to the conclusion that the ADC(2) method [37, 38] is a good candidate to perform photodynamical simulations [39]. The combination with the resolution-of-the-identity approximation (RI) [40, 41] gives a computationally efficient procedure that is well suited for on-the-fly photodynamics simulations. In using the ADC(2) method for photodynamic simulations, one should note that it is a single-reference method, which is able to describe the dynamic electron correlation well but does not take into account non-dynamic electron correlation effects. This deficiency will affect primarily the intersections S1/S0 where a single closed shell reference will not be adequate, and the dimensionality of the intersection seam is wrong [42]. Nevertheless, the excited-state nonadiabatic relaxation dynamics up to reaching the crossing to the ground state is usually reliable.
The afore-mentioned recent ADC(2) surface hopping dynamics calculations on the photodynamic decay of thymine [19] show a strongly reduced trapping in S2 as compared to the CASSCF simulations and a complex dynamics with two pathways to the ground state. A minor one via a S1(ππ*)/S0 intersection and a major one to a S1(nπ*) and partial conversion to
S0 via a S1(nπ*)/S0 intersection. In total, 30% of the population did not reach the ground state within the simulation time of 1 ps.
In this work, we are building on the positive experience obtained with ADC(2) calculations of nucleobases and want to investigate by means of surface hopping simulations the influence
6 of hydrogen bonding on the thymine photodynamics. For this purpose, a cluster model of six water molecules surrounding thymine (T(H2O)6) as developed previously by Etinski et al. [29] is used. In this model (Scheme 1), all thymine sites available to hydrogen bonding are in contact with at least one hydrogen bond.
Scheme 1. Structure of thymine with six water molecules (T(H2O)6).
2. Computational details
Geometry optimizations of the ground state and the first two excited states of thymine and the thymine-six water cluster (T(H2O)6) were performed with the ADC(2) method using the RI approach. The aug-cc-pVDZ basis set [43, 44] has been used for the heavy atoms whereas the cc-pVDZ basis was employed for the H atoms. This mixed basis set is denoted (aug-)cc-pVDZ in the text. The UV photoabsorption spectrum of the thymine/water cluster was performed in the framework of the nuclear ensemble approach [45, 46] using an ensemble of 1000 molecular geometries created by the harmonic-oscillator Wigner distribution based on normal modes in the ground state. Two vertical excitations covering the first absorption band of thymine were computed at each geometry. For the calculations of the vertical transitions, the T(H2O)6 cluster was embedded into a solvent continuum using the conductor-like screening model (COSMO) [47] with a relative dielectric constant of 80.2 for water .
Nonadiabatic surface hopping dynamics was performed on ADC(2)/(aug)cc-pVDZ energy surfaces. Initial conditions were selected from a pool of 1000 displaced geometries and corresponding momenta created in the same way as described in the preceding paragraph for the spectra calculations. The transitions to the ππ* state were selected according to an energy window located symmetrically with 0.13 eV around the simulated band maximum of 4.69 eV. In total 112 trajectories were run with a maximum propagation time of 1ps. Nonadiabatic events
7 between S2 and S1 were taken into account by the fewest switches algorithm [48] corrected for decoherence effects ( = 0.1 Hartree) [49]. Nonadiabatic interactions between S2 and S1 have been computed in terms of the wavefunction overlaps between consecutive time steps as proposed by Hammes-Schiffer and Tully [50] and following implementations according to Refs. [33, 51-53]. Because of the restrictions of ADC(2) to represent the multireference character of the ground states [42], a different procedure was chosen for estimating the crossing to S0 by means of stopping a trajectory whenever the S1/S0 energy gap dropped to 0.2 eV or below, and taking the corresponding time step as representative for the trajectory having reached the ground state. The velocity Verlet algorithm [54] with a time step of 0.5 fs was used for integrating Newton’s equations of motion. The semiclassical Schrödinger equation was integrated employing the 5th order Butcher algorithm [55] with a time step of 0.025 fs, using interpolated properties between the time steps of the classical dynamics.
The time constants for the internal conversion have been obtained by fitting the average
S1 occupation computed from the whole set of trajectories with the kinetic model presented in the Supplementary Material of Ref. [19]. According to this model, which has been developed specifically to take into account potential trapped populations in S1 and S2, the populations of these states should evolve according to
1 2 2 1 2 2 1 1 1 2 1 1 1 2 1 1 2 1 1 1 1 2 1 1 2 1 1 1 1 1 1 2 2 1 exp 1 1 exp exp exp 1 exp 1 exp 1 F S F S f t t f t t f t t t t t f t (1) where F if is the fast (ps) and fiS is the slow (trapping) component of the decay from state
Si (i = 1,2). i corresponds to the time constant for the fast depopulation of Si. The occupation
(fraction of trajectories as a function of time) of state Si is fitted with the full signal function
F S
i i i
f f f . Asymptotically, the population trapped in S2 is f2
f2
1 1 /
and in8 S1 is F2,1 1 f2
, while the fraction of the S1 occupation that decays fast to S0 is
1,0 1 1 2,1
F f F .
The margin of error of a sample average (t) for a given sample of data at time t is computed as [56]
st Z
N
(2)
where s is the standard deviation, N is the sample size and the factor Z depends on the confidence interval. For a 95% confidence interval the value of Z is 1.96.
The distortions of the thymine ring during the dynamics were characterized by means of the Cremer-Pople parameters [57] and classified according to the conformation scheme of Boeyens [58]. For a six-member ring, the CP analysis provides three parameters, Q, , and .
Q tells the degree of puckering (0 corresponds a planar ring), while the other two parameters
tell the kind of distortion (chair - C, envelope - E, boat - B, twist-boat - T, screw boat - S, and half chair - H). Natural transition orbitals (NTOs) [59] have been computed using the program package TheoDORE [60-62].
The ADC(2) calculations were performed with the TUBOMOLE suite of programs [63]. Spectra and dynamics were computed with the NEWTON-X/TURBOMOLE interface [64, 65]. Cremer-Pople parameters were determined using the PLATON program [66].
3. Results and discussion
3.1. Review of the gas phase photodynamics
The photodynamics of isolated thymine starts in the bright S2(ππ*) state. The most important structures characterizing the deactivation pathways from the Franck-Condon region to the ground state are the S2(ππ*) and S1(nπ*) minima and the X21(ππ*/nπ*), X10(ππ*/S0), and
X10(nπ*/S0) minima on the crossing seam. The subscripts in Xmn denote crossings between states
m and n. These structures have been extensively discussed in the literature before (see Ref. [19]
and references therein). A compact overview of the energy profiles as obtained from the gas phase photodynamics of thymine using the ADC(2) method [19] displaying the deactivation
9 pathways of thymine and respective time constants are presented in Figure 1.
Figure 1. Schematic view of the gas phase thymine dynamics as predicted by ADC(2) [19]. Figure copied from [19] based on a Creative Commons Attribution License (CC BY 4.0).
After Franck-Condon excitation to S2(ππ*), most of the trajectories (84%) switch to the S1 state with a time constant of 253 fs. 9% convert via the S1(ππ*)/S0 crossing to the ground state. 75% of the trajectories continue on S1 to the S1(nπ*) minimum and 61% decay to the ground state with a time constant of 391 fs. A total of 30% of the trajectories (16% in S2 and 14% in
S1) do not reach the ground state within the simulation time of 1 ps. The time constants for depopulation of S2 and S1 obtained from the ADC(2) gas phase dynamics [19] fitted by Eq. (1) are collected in Table 1. These simulations represent well the reduced trapping in S2 as compared to the surface-hopping dynamics based on CASSCF [14] but do not seem to explain completely the experimentally observed time constant of about 6 ps since 70% of the population decays to the ground state in the sub-picosecond time scale. Full spectral simulations would be necessary to determine whether the 30% remaining in S1 are sufficient to explain the experimentally observed few ps decay. However, because of the deficiencies of the single reference ADC(2) method in the region of the S1/S0, energetic over stabilization of that region cannot be excluded and shortcomings for determining the decay rate cannot be neglected. For more discussion on this topic we refer to Ref. [19].
10 Table 1. Time constants (fs) for the gas-phase thymine [19] and for thymine/water cluster dynamics.a F
i,i-1 is the fraction of the Si occupation decaying to Si-1 in the ultrafast regime (see
Computational Details).
Gas phase T(H2O)6 cluster
Fi,i-1 τi (fs) Fi,i-1 τi (fs)
S2 S1, i = 2 0.84 253 0.98 62 S1 S0, i = 1 0.70 391 0.61 602 a See Eq. (1) for the definition of the parameters.
3.2. Excited state properties of the T(H2O)6 cluster in comparison to the isolated thymine
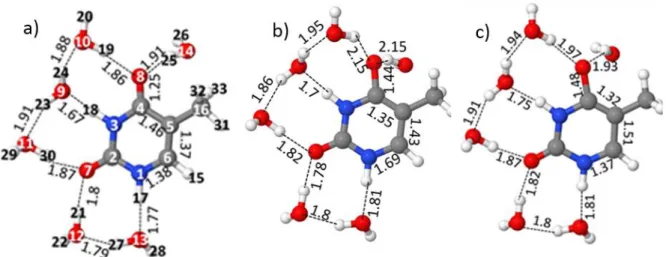
Atomic numbering and the hydrogen bonding network of the six water molecules in the (T(H2O)6) complex are shown in Figure 2. The figure shows a similar hydrogen bonded (HB) network extending from N1-H17 to C4-O8 for all three states. In S0, OH···O distances amount to about 1.8 – 1.9 Å. The NH···O distances are with 1.7 – 1.8 Å somewhat smaller. Two characteristic changes occur in the two excited states. In the S1(nπ*) state (Figure 2b), the two HB distances O8···HOH increase significantly from 1.9 Å to 2.15 Å. The C4-O8 bond distance increases as well from 1.25 Å to 1.44 Å. Important changes in the pyrimidine ring are also observed for S1: the C4-C5 bond is decreased whereas C5-C6 and N1-C6 increase in length. On excitation to S2(ππ*), the O8···HOH HB lengths are also stretched in comparison to the ground state, though to a lesser extent. The origin for the difference between the two excited states in terms of these two bond lengths will become clearer from the discussion of the electronic structure of these two states given below. Characteristic differences in the above-mentioned ring bond distances are observed for S2 as well. Notable is also the stretching of the C4-O8 bond distance to 1.48 Å which occurs since in the optimized structure for S2(ππ*) the ππ* excitation involves primarily the promotion of an electron from this bonding region (Figure 1S).
11 Figure 2. The structure of the T(H2O)6 cluster optimized for a) the ground state S0, b) the S1(nπ*) state and c) the S2(ππ*) state. In case of the S2(ππ*) state, the thymine was kept frozen at the optimized gas phase geometry.
The intersection structures X21 and X10 for the intersections S2/S1 and S1/S0, respectively, for T(H2O)6 are shown in Figure 3. In these cases, the optimization of the state intersection with the CIOpt program [67] used for the isolated thymine was not successful here. To get at least an informative view of the solvent structures at these points, we froze the thymine geometries at the gas phase values and optimized only the solvent structure. A similar procedure had been used also for the S2(ππ*) geometry optimization because of the close proximity of this state with the S1(nπ*) state. As most interesting observation with respect to the HB structure is the stretching of the bond O8H25 and O8H19 in the X21(ππ*/nπ*) and X10(nπ*/S0) structures (Figure 3) in comparison to the ground state.
12
X10(ππ*/S0) and c) X10(nπ*/S0) structures. The thymine was kept frozen at the optimized gas phase geometries of the respective intersection structures.
In Table 2, excitation energies for thymine in the gas phase and in the water complex are compared. One characteristic change is the destabilization of the nπ* state by the interaction with the water molecules, which amounts to 0.26 eV for the vertical excitation. At the same time, the ππ* state is stabilized by a slightly smaller amount (0.18 eV). Consequently, the
S1(nπ*) and S2(ππ*) are almost degenerate at this point. Inclusion of continuum solvation within the COSMO approach (Table 2) destabilizes the nπ* further so that it is higher in energy by ~0.3 eV than the ππ* state. Similar effects have been observed by Etinski and Marian [29] in their coupled cluster singles and approximate doubles (CC2) calculations. In this case, the
nπ* state is located even 0.13 eV above the ππ* state. The S1(nπ*) minimum structure is destabilized with respect to the gas phase as well. Nevertheless, it is still located well below the vertically excited initial S2(ππ*) state and also below the S2(ππ*) minimum. The other structures listed in Table 2 are affected by solvation effects as well, but the overall energetic scheme is not modified in comparison to the gas phase.
Table 2. Excitation energies (eV) for thymine relative to the ground state minimum for different geometries.a Geometry State Isolated thymine ADC(2) [19] T(H2O)6 b S0 min S0 (cs) 0.0 0.0 S1(nO8π*) 4.56 4.82 (f=0.01) b [5.06]c S2(π56π*) 5.06 4.88 (f=0.21)b [4.79]c S1 min S0 (cs) 1.33 1.42 S1(nO8π*) 3.33 3.67 S2 min S0 (cs) 2.14 2.16
13 S1(nO8π*) 3.50 4.18 S2(πO8π*) 4.18 4.49 X21(ππ*/nπ*) S0 (cs) 3.37 3.73 S1(nO8π*) 4.21 4.63 S2(πO4π*)d 4.22 4.63 X10(ππ*/S0) S0 (cs) 3.82 3.89 S1(π56π*)d 3.82 4.03 X10(nπ*/S0) S0 (cs) 3.90 3.89 S1(nO8π*)d 3.90 4.20
a In the geometry optimizations of the T(H2O)6 complex for the S2(ππ*) minimum, the
X21(ππ*/nπ*), X10(ππ*/S0), and X10(nπ*/S0) state intersections, the thymine was kept frozen at the optimized gas phase geometries and for the state indicated the water structure was optimized. b Oscillator strengths in parentheses. c COSMO values in brackets. d The water structure was optimized for this state.
The electronic character of the excitations in thymine is not influenced significantly by the surrounding water molecules. Figure 4 shows the NTOs for the two lowest vertical transitions. The upper part shows a transition from an n orbital located at O8 to a π orbital with a node in the C5-C6 bond. In the ππ* transition (lower part), the π* orbital is the same as in the nπ* transition. The NTOs for the transitions of all structures listed in Table 2 are given in the Supporting Information (SI).
hole electron
S1(nπ*)
n = 0.87 n = 0.87
14 n = 0.90 n = 0.90
Figure 4. NTOs and occupation numbers n for the vertical transitions from the ground state minimum to the S1(nπ*) (top) and S2(ππ*) (bottom) states.
The vibrational envelope of the thymine spectrum computed with the nuclear ensemble approach is displayed in Figure 5 for the isolated thymine and for the T(H2O)6 cluster in comparison to experimental spectra in aqueous solution. The band maxima are found at 4.79 eV for the thymine-gas case and 4.66 eV for T(H2O)6. The observed red shift of 0.13 eV is in line with the one of 0.18 eV computed from the vertical excitations (Table 2). The T(H2O)6 spectrum shows good agreement with the experimental spectra for aqueous solution, especially with the spectrum given by Du et al. [68]. As has already been reported in analogous simulations of the UV spectra of the nucleobases [46], it is also found here that the vertical excitations lie about 0.2 eV higher than the corresponding band maxima.
Figure 5. Simulated spectra for thymine and the T(H2O)6 cluster in comparison to experimental spectra; Du et al. [68], Middleton et al. [69].
15
3.3. Photodynamics of the T(H2O)6 cluster
The state occupation diagram computed as an average over all trajectories is shown in Figure 6. It displays a similar global overall characteristic in comparison to the gas phase counterpart [19]. There is, however, one major difference: the decay of the initial S2(ππ*) state is significantly faster in the T(H2O)6 cluster than in gas phase. Time constants for the formation and depletion of the S1 state were obtained from fitting the average state occupation curves shown in Figure 6 by Eq. (1). Comparison of the respective fitting data collected in Table 1 show these differences clearly. The S2 S1 decay time is 62 fs for the T(H2O)6 cluster and all trajectories switch to S1 state. For the gas phase, the S2 S1 decay time is much longer (253 fs) and only 84% of the trajectories make the transfer to S1, the rest stays in S2 until the end of the simulation time of 1ps. These differences obviously come from the fact that due to solvation the S1 and S2 states are closely spaced (see the vertical excitation energies listed in Table 2) as opposed to the gas phase case and, in the former case, the transition to S1 can start almost immediately. In case of the S1 dynamics, the time constant for decaying to the ground state is significantly larger (602 fs) for the T(H2O)6 cluster than the 391 fs for the gas phase. With 60%, the percentage of switching to S0 is also significantly smaller in the former case than for the gas phase (70%).
Figure 6. Average state occupation for the photodynamics of the T(H2O)6 cluster. Concerning the S2→S1 transition, the Cremer-Pople parameters at the hopping time (Figure 7a) shows that the hop can happen in most of the - space, indicating that the out-of-plane distortion plays a minor role for this internal conversion. This result also diverges from
16 the dynamics in the gas phase, where hops at the 3,6B conformation (boat with atoms N3 and C6 out of plane), near the minimum of the crossing seam, have a larger probability of occurrence [19]. According to Figure 7a, the nonadiabatic event tends to take place at quasi-planar geometries: 29% of hops took place for Q < 0.05 Å, and for the remaining 71%, the mean Q was 0.12 ± 0.04 Å. For comparison, in the gas phase, the corresponding mean value was 0.17 ± 0.08 Å [19]. All hops occur consistently in an early stage of the dynamics (Figure 7b) in agreement with the 62 fs time constant. In the case of the S1/S0 hops, only 8% of these events happened at semiplanar structures (Figure 7c). The mean value of Q for the 92% of the remaining hops happening at Q > 0.05 Å was 0.22 ± 0.12 Å. Although the hops can still happen in most of the - space, they now tend to cluster at > 90° and between 90° and 135° (Figure 7c). The most common conformations at the hopping time are 3,6B, 3T1 (twist-boat with N1 and N3 out of plane), and B4,1 (boat with N1 and C4 out of plane).
Analysis of the NTOs for the structures at the hopping structures showed for the S2/S1 hops that 36% passed from nπ* to ππ* and 64% from ππ* to nπ*. Subsequently, 60% of the trajectories hop to the ground state (54% via S1(nπ*)/S0 and 6% via S1(ππ*)/S0), and the remaining 40% stay in S1 until the end of the 1 ps simulation time. In comparison to the gas phase simulation, the fraction of trajectories passing through the S1(ππ*)/S0 intersection is somewhat reduced from 9% to 6%.
17 Figure 7. Polar plot showing the distribution of Cremer-Pople parameters and at the S2/S1 hopping geometries a) and b), and for the S1/S0 hopping geometries c) and d). Color coding indicates the non-planarity parameter Q and the hopping times, respectively.
The thymine bond distances C4O8, C4C5, and C5C6 show characteristic differences as has already been discussed in the context of the optimized structures in Section 3.2. The full time evolution of the averaged bond distances is displayed in Figure 2S. It shows a significant initial change from the respective ground-state value to the S2 value, including a certain overshooting and then gradual evolution to the S1 value. A similar behavior is found for the gas phase, as already discussed in Ref. [19]. It should be reminded at this point that the dynamics was stopped at the crossing to the ground state and, therefore, no trends toward ground state bond distances can be observed. Specifically, one finds in Figure 1S of the Supplementary Data (for comparison, see also Figure 2) that the C4O8 distance increases at the beginning toward 1.48 Å and then oscillates at an average value between the corresponding S1 and S2 minima. The C4C5 distance decreases initially and then proceeds oscillating around its S1 minimum value. For the C5C6 distance a similar analysis can be given. The mentioned close similarity to the evolution of these bond distances in the T(H2O)6 cluster to the behavior found for the gas phase clearly indicates the strong parallelism of the structural changes within thymine for the two cases.
3.4. The dynamics of the water network around thymine
The hydrogen bond lengths between the six water molecules and the thymine bonding sites serve as a sensitive indicator of the changes occurring in the electronic structure in thymine and the interaction with the surrounding water environment. The evolution of the averaged hydrogen bond lengths displayed in Figure 8 show the most significant effects for the interactions of thymine O8 with the water molecules. At about 30 fs, the O8H25 and O8H19 bonds start to increase steadily and show breaking of this hydrogen bond. Inspection of the optimized structures for the S1 and S2 states (Figure 2) confirms the observations from the dynamics simulations. As already mentioned above, the nπ* excitation involves the lone pair
18 on O8 (Figure 4, top) and leads to a significant increase of the hydrogen bond distances. A similar strong weakening of hydrogen bond lengths has already been observed for nπ* states from CASSCF calculation on 4-aminopyrimidine/water clusters [30]. In contrast, the lone pair of the other oxygen atom (O7) is not involved in the lowest nπ* excitation. A significantly reduced increase of hydrogen bond lengths sets in at later times, which can be explained by transfer of kinetic energy from thymine to the water molecules. The most stable hydrogen bonds are those to the hydrogen atoms of the two N-H bonds of thymine (O9H18) and O13H17).
19 Figure 8. Time evolution of the hydrogen bond distances averaged over all trajectories. The shaded areas show plus-minus the margin of error given in Eq. (2) around the mean value.
The evolution of the average kinetic energies of thymine and of H2O-14 are displayed in Figure 9. The behavior of the total average kinetic energy of the T(H2O)6 complex and of the remaining water molecules is shown in Figure 3S. The kinetic energy shows for thymine (Figure 9) and for the total kinetic energy (Figure 3S) a strong initial increase, which is mirrored by the geometrical relaxation and concomitant reduction in the potential energy after the vertical excitation. After the phase of increasing kinetic energy of thymine from 0 to 0.2 ps, a continuous decrease sets in, indicating the energy transfer to the water molecules. Between 0.2 and 1 ps, thymine loses about 1.6 eV, which seems to be approximately equally shared between all water molecules.
20 Figure 9. Time evolution of the averaged kinetic energy (a.u.) of a) thymine and b) of H2O-14 (black lines). The green lines show plus-minus the margin of error given in Eq. (2) around the mean value.
4. Discussion and Conclusions
The nonadiabatic photodynamics simulation of a T(H2O)6 cluster performed in this work (for an overview see Figure 10) shows a similar global behavior as the photodynamics carried out for the isolated thymine [19] (Figure 1), using comparable procedures such as the ADC(2) approach and surface hopping. However, it shows also specific differences and gives insight into the specific interaction of the hydrogen bonding to different sites in thymine.
21 Figure 10. Schematic view of the T(H2O)6 photodynamics based on ADC(2). Decay percentages are based on trajectory counts.
The similarities consist of the major decay pathway from the initial S2(ππ*) state to the
S1(nπ*) minimum and either further decay via a S1(nπ*)/S0 intersection to the ground state or trapping in S1 for at least 1 ps. The alternative pathway to the ground state via a S1(ππ*)/S0 intersection, even though energetically feasible, is in both cases very little populated. The differences in the two thymine dynamics simulations (gas phase vs. water cluster) can be rationalized by the shifts in the excitation energies. The nπ* state is destabilized by the interaction with the water molecules and the ππ* state is stabilized (Table 2). Due to the close proximity of the two states at the vertical excitation for the T(H2O)6 cluster, the decay from the bright S2(ππ*) state to S1 is much faster in this case (62 fs) as compared to the gas phase (253 fs) (Table 1). Thus there is no trapping in S2. On the other hand, the decay time for the cluster in S1 is significantly larger (602 fs) than for the gas phase (391 fs) and the amount of trapped trajectories is also larger (40%) in the T(H2O)6 cluster as compared to the gas phase (30% total). The present simulations for a hydrogen bonded thymine and the previous gas phase thymine calculations demonstrate a dominating role of the S1(nπ*) minimum as the central coordination point for the temporal evolution at longer time scales consisting either in further trapping in S1 or intersystem crossing to the triplet state. The dominance of the S1(nπ*) minimum sets also limits to changing the decay mechanism. In the calculations of Etinski and Marian, an even stronger destabilization of the nπ* state in comparison to the ππ* state has been reported [29]
22 with the latter more stable than the former by 0.4 eV. Such changes will certainly have an influence on the S2/S1 hopping process, but it probably will not remove the S1(nπ*) minimum so that one would expect, based on the present experience, that the overall decay mechanism will not be changed qualitatively.
Besides the comparison of thymine gas phase photodynamics and the one including hydrogen bonded interactions, specific structural effects of the water molecules are of interest. The electronic wavefunction of the nπ* state can be characterized at all important sections of the photodynamics as an excitation originating from a lone pair located at O8. Thus, the water molecules with O10 and O14 (Figure 2) are affected primarily by this fact, which is documented by the strong increase of the hydrogen bond distances (Figure 8ab) starting at about 30 fs. H2O-14 is especially volatile since it is in an edge position and actually loses all contact with thymine. Thus, this water molecule is prone to dissociate in molecular beams as has been discussed by Kim et al. [70] for hydrated adenine to explain the observed anomalously low intensity of the ion signal of the adenine-water clusters in comparison to unhydrated ones.
Acknowledgment
AJAA and HL acknowledge financial support from the School of Pharmaceutical Science and Technology, Tianjin University, China. MB work was supported by Excellence Initiative of Aix-Marseille University (A*MIDEX) and the project Equip@Meso (ANR-10-EQPX-29-01), both funded by the French Government “Investissements d’Avenir” program. MB also acknowledges funding from and of the WSPLIT project (ANR-17-CE05-0005-01).
Appendix A. Supplementary data
Supplementary data associated with this article can be found, in the online version, at “link to be filled in”
23
References
[1] H. Yu, J.A. Sanchez-Rodriguez, M. Pollum, C.E. Crespo-Hernandez, S. Mai, P. Marquetand, L. Gonzalez, S. Ullrich, Phys Chem Chem Phys 18 (2016) 20168-20176.
[2] H. Kang, K.T. Lee, B. Jung, Y.J. Ko, S.K. Kim, J Am Chem Soc 124 (2002) 12958-12959. [3] S. Ullrich, T. Schultz, M.Z. Zgierski, A. Stolow, Phys Chem Chem Phys 6 (2004) 2796-2801.
[4] B.K. McFarland, J.P. Farrell, S. Miyabe, F. Tarantelli, A. Aguilar, N. Berrah, C. Bostedt, J.D. Bozek, P.H. Bucksbaum, J.C. Castagna, R.N. Coffee, J.P. Cryan, L. Fang, R. Feifel, K.J. Gaffney, J.M. Glownia, T.J. Martinez, M. Mucke, B. Murphy, A. Natan, T. Osipov, V.S. Petrovic, S. Schorb, T. Schultz, L.S. Spector, M. Swiggers, I. Tenney, S. Wang, J.L. White, W. White, M. Guhr, Nat Commun 5 (2014) 4235.
[5] J. Gonzalez-Vazquez, L. Gonzalez, E. Samoylova, T. Schultz, Phys Chem Chem Phys 11 (2009) 3927-3934.
[6] N. Gador, E. Samoylova, V.R. Smith, A. Stolow, D.M. Rayner, W.G. Radloff, I.V. Hertel, T. Schultz, J Phys Chem A 111 (2007) 11743-11749.
[7] C. Canuel, M. Mons, F. Piuzzi, B. Tardivel, I. Dimicoli, M. Elhanine, J Chem Phys 122 (2005).
[8] E. Samoylova, T. Schultz, I.V. Hertel, W. Radloff, Chem Phys 347 (2008) 376-382.
[9] M. Ligare, F. Siouri, O. Bludsky, D. Nachtigallova, M.S. de Vries, Phys Chem Chem Phys 17 (2015) 24336-24341.
[10] E. Samoylova, H. Lippert, S. Ullrich, I.V. Hertel, W. Radloff, T. Schultz, J Am Chem Soc 127 (2005) 1782-1786.
[11] S. Perun, A.L. Sobolewski, W. Domcke, J Phys Chem A 110 (2006) 13238-13244. [12] G. Zechmann, M. Barbatti, J Phys Chem A 112 (2008) 8273-8279.
[13] H.R. Hudock, B.G. Levine, A.L. Thompson, H. Satzger, D. Townsend, N. Gador, S. Ullrich, A. Stolow, T.J. Martinez, J Phys Chem A 111 (2007) 8500-8508.
[14] J.J. Szymczak, M. Barbatti, J.T.S. Hoo, J.A. Adkins, T.L. Windus, D. Nachtigallova, H. Lischka, J Phys Chem A 113 (2009) 12686-12693.
[15] M. Barbatti, A.J.A. Aquino, J.J. Szymczak, D. Nachtigallova, P. Hobza, H. Lischka, P Natl Acad Sci USA 107 (2010) 21453-21458.
[16] M. Merchan, R. Gonzalez-Luque, T. Climent, L. Serrano-Andres, E. Rodriuguez, M. Reguero, D. Pelaez, J Phys Chem B 110 (2006) 26471-26476.
[17] D. Asturiol, B. Lasorne, M.A. Robb, L. Blancafort, J Phys Chem A 113 (2009) 10211-10218.
[18] Z.G. Lan, E. Fabiano, W. Thiel, J Phys Chem B 113 (2009) 3548-3555.
[19] L. Stojanovic, S. Bai, J. Nagesh, A.F. Izmaylov, R. Crespo-Otero, H. Lischka, M. Barbatti, Molecules 21 (2016) 1603.
[20] J.J. Serrano-Perez, R. Gonzalez-Luque, M. Merchan, L. Serrano-Andres, J Phys Chem B 111 (2007) 11880-11883.
[21] M. Etinski, T. Fleig, C.A. Marian, J Phys Chem A 113 (2009) 11809-11816. [22] S.M. Bai, M. Barbatti, J Phys Chem A 120 (2016) 6342-6350.
24 [23] P.M. Hare, C.E. Crespo-Hernandez, B. Kohler, P Natl Acad Sci USA 104 (2007) 435-440. [24] T. Gustavsson, A. Banyasz, E. Lazzarotto, D. Markovitsi, G. Scalmani, M.J. Frisch, V. Barone, R. Improta, J Am Chem Soc 128 (2006) 607-619.
[25] Y.G. He, C.Y. Wu, W. Kong, J Phys Chem A 108 (2004) 943-949.
[26] M. Busker, M. Nispel, T. Haber, K. Kleinermanns, M. Etinski, T. Fleig, Chemphyschem 9 (2008) 1570-1577.
[27] Y. Nosenko, M. Kunitski, B. Brutschy, J Phys Chem A 115 (2011) 9429-9439.
[28] R. Improta, V. Barone, A. Lami, F. Santoro, J Phys Chem B 113 (2009) 14491-14503. [29] M. Etinski, C.M. Marian, Phys Chem Chem Phys 12 (2010) 4915-4923.
[30] J.J. Szymczak, T. Müller, H. Lischka, Chem Phys 375 (2010) 110-117.
[31] S. Lobsiger, S. Blaser, R.K. Sinha, H.M. Frey, S. Leutwyler, Nat Chem 6 (2014) 989-993. [32] M. Barbatti, H. Lischka, Phys Chem Chem Phys 17 (2015) 15452-15459.
[33] F. Plasser, R. Crespo-Otero, M. Pederzoli, J. Pittner, H. Lischka, M. Barbatti, J Chem Theory Comput 10 (2014) 1395-1405.
[34] C. Hättig, Adv Quantum Chem 50 (2005) 37-60.
[35] A.J.A. Aquino, I. Borges, R. Nieman, A. Köhn, H. Lischka, Phys Chem Chem Phys 16 (2014) 20586-20597.
[36] T.M. Cardozo, A.J.A. Aquino, M. Barbatti, I. Borges, H. Lischka, J Phys Chem A 119 (2015) 1787-1795.
[37] A.B. Trofimov, J. Schirmer, J Phys B-at Mol Opt 28 (1995) 2299-2324. [38] J. Schirmer, Phys Rev A 26 (1982) 2395-2416.
[39] R. Crespo-Otero, M. Barbatti, Chemical Reviews (doi:10.1021/acs.chemrev.7b00577). [40] C. Hättig, J Chem Phys 118 (2003) 7751-7761.
[41] A. Köhn, C. Hättig, J Chem Phys 119 (2003) 5021-5036.
[42] D. Tuna, D. Lefrancois, L. Wolanski, S. Gozem, I. Schapiro, T. Andruniow, A. Dreuw, M. Olivucci, J Chem Theory Comput 11 (2015) 5758-5781.
[43] T.H. Dunning, J Chem Phys 90 (1989) 1007-1023.
[44] R.A. Kendall, T.H. Dunning, R.J. Harrison, J Chem Phys 96 (1992) 6796-6806. [45] R. Crespo-Otero, M. Barbatti, Theor Chem Acc 131 (2012) 1237.
[46] M. Barbatti, A.J.A. Aquino, H. Lischka, Phys Chem Chem Phys 12 (2010) 4959-4967. [47] A. Klamt, Wires Comput Mol Sci 1 (2011) 699-709.
[48] J.C. Tully, J Chem Phys 93 (1990) 1061-1071.
[49] G. Granucci, M. Persico, J Chem Phys 126 (2007) 134114.
[50] S. Hammes-Schiffer, J.C. Tully, J Chem Phys 101 (1994) 4657-4667. [51] J. Pittner, H. Lischka, M. Barbatti, Chem Phys 356 (2009) 147-152.
[52] U. Werner, R. Mitric, T. Suzuki, V. Bonacic-Koutecky, Chem Phys 349 (2008) 319-324. [53] E. Tapavicza, I. Tavernelli, U. Rothlisberger, Phys Rev Lett 98 (2007).
[54] W.C. Swope, H.C. Andersen, P.H. Berens, K.R. Wilson, J Chem Phys 76 (1982) 637-649. [55] J. Butcher, J. Assoc. Comput. Mach. 12 (1965) 124–135.
[56] D.S. Moore, G.P. McCabe, B.A. Craig, Introduction to the Practice of Statistics, Ch. 6, H. Freeman and Company, New York, 2006.
[57] D. Cremer, J. Pople, J Am Chem Soc 97 (1975) 1354–1358. [58] J.C.A. Boeyens, J Cryst Mol Struct 8 (1978) 317-320.
25 [59] R.L. Martin, J Chem Phys 118 (2003) 4775-4777.
[60] F. Plasser, H. Lischka, J Chem Theory Comput 8 (2012) 2777-2789. [61] F. Plasser, M. Wormit, A. Dreuw, J Chem Phys 141 (2014) 024106.
[62] TheoDORE (Theoretical Density, Orbital Relaxation and Exciton analysis) (1.4), 2016,
http://theodore-qc.sourceforge.net.
[63] R. Ahlrichs, M. Bär, M. Häser, H. Horn, C. Kölmel, Chem Phys Lett 162 (1989) 165-169. [64] M. Barbatti, M. Ruckenbauer, F. Plasser, J. Pittner, G. Granucci, M. Persico, H. Lischka, Wires Comput Mol Sci 4 (2014) 26-33.
[65] M. Barbatti, G. Granucci, M. Ruckenbauer, F. Plasser, R. Crespo-Otero, J. Pittner, M. Persico, H. Lischka, Newton-X: A Package for Newtonian Dynamics Close to the Crossing Seam. 2013. Available online: http://www.Newtonx.Org (accessed on 1 March 2018).
[66] A.L. Spek, J Appl Crystallogr 36 (2003) 7-13.
[67] B.G. Levine, J.D. Coe, T.J. Martinez, J Phys Chem B 112 (2008) 405-413.
[68] H. Du, R.C.A. Fuh, J.Z. Li, L.A. Corkan, J.S. Lindsey, Photochem Photobiol 68 (1998) 141-142.
[69] C.T. Middleton, K. de La Harpe, C. Su, Y.K. Law, C.E. Crespo-Hernandez, B. Kohler, Annu Rev Phys Chem 60 (2009) 217-239.
[70] N.J. Kim, H. Kang, G. Jeong, Y.S. Kim, K.T. Lee, S.K. Kim, J Phys Chem A 104 (2000) 6552-6557.
26 Graphical abstract
![Figure 1. Schematic view of the gas phase thymine dynamics as predicted by ADC(2) [19]](https://thumb-eu.123doks.com/thumbv2/123doknet/14473463.522792/10.892.261.646.190.445/figure-schematic-view-phase-thymine-dynamics-predicted-adc.webp)