HAL Id: hal-00880921
https://hal.archives-ouvertes.fr/hal-00880921
Submitted on 7 May 2014
HAL is a multi-disciplinary open access
archive for the deposit and dissemination of
sci-entific research documents, whether they are
pub-lished or not. The documents may come from
teaching and research institutions in France or
abroad, or from public or private research centers.
L’archive ouverte pluridisciplinaire HAL, est
destinée au dépôt et à la diffusion de documents
scientifiques de niveau recherche, publiés ou non,
émanant des établissements d’enseignement et de
recherche français ou étrangers, des laboratoires
publics ou privés.
Low-flow, low-gradient severe aortic stenosis despite
normal ejection fraction is associated with severe left
ventricular dysfunction as assessed by speckle-tracking
echocardiography: a multicenter study.
Jérôme Adda, Christopher Mielot, Roch Giorgi, Frédéric Cransac, Xavier
Zirphile, Erwan Donal, Catherine Sportouch-Dukhan, Patricia Réant,
Stéphane Laffitte, Stéphane Cade, et al.
To cite this version:
Jérôme Adda, Christopher Mielot, Roch Giorgi, Frédéric Cransac, Xavier Zirphile, et al.. Low-flow,
low-gradient severe aortic stenosis despite normal ejection fraction is associated with severe left
ventric-ular dysfunction as assessed by speckle-tracking echocardiography: a multicenter study.. Circulation:
Cardiovascular Imaging, American Heart Association, 2012, 5 (1), pp.27-35.
�10.1161/CIRCIMAG-ING.111.967554�. �hal-00880921�
Normal Ejection Fraction Is Associated With Severe Left
Ventricular Dysfunction as Assessed by
Speckle-Tracking Echocardiography
A Multicenter Study
Je´roˆme Adda, MD; Christopher Mielot, MD; Roch Giorgi, MD, PhD; Fre´de´ric Cransac, MD;
Xavier Zirphile, MD; Erwan Donal, MD; Catherine Sportouch-Dukhan, MD; Patricia Re´ant, MD;
Ste´phane Laffitte, MD; Ste´phane Cade, MD; Yvan Le Dolley, MD; Franck Thuny, MD;
Nathalie Touboul, PhD; Ce´cile Lavoute, PhD; Jean-Franc¸ois Avierinos, MD;
Patrizio Lancellotti, MD; Gilbert Habib, MD
Background—Low-flow low-gradient (LFLG) is sometimes observed in severe aortic stenosis (AS) despite normal
ejection fraction, but its frequency and mechanisms are still debated. We aimed to describe the characteristics of patients with LFLG AS and assess the presence of longitudinal left ventricular dysfunction in these patients.
Methods and Results—In a multicenter prospective study, 340 consecutive patients with severe AS and normal ejection fraction
were studied. Longitudinal left ventricular function was assessed by 2D-strain and global afterload by valvulo-arterial impedance. Patients were classified according to flow and gradient: low flow was defined as a stroke volume index ⱕ35 mL/m2, low gradient as a mean gradient ⱕ40 mm Hg. Most patients (n⫽258, 75.9%) presented with high-gradient AS, and 82 patients (24.1%) with low-gradient AS. Among the latter, 52 (15.3%) presented with normal flow and low gradient and 30 (8.8%) with LFLG. As compared with normal flow and low gradient, patients with LFLG had more severe AS (aortic valve area⫽0.7⫾0.12 cm2versus 0.86⫾0.14 cm2), higher valvulo-arterial impedance (5.5⫾1.1 versus 4⫾0.8 mm Hg/mL/m2), and worse longitudinal left ventricular function (basal longitudinal strain⫽⫺11.6⫾3.4 versus ⫺14.8⫾3%; P⬍0.001 for all).
Conclusions—LFLG AS is observed in 9% of patients with severe AS and normal ejection fraction and is associated with high
global afterload and reduced longitudinal systolic function. Patients with normal-flow low-gradient AS are more frequent and present with less severe AS, normal afterload, and less severe longitudinal dysfunction. Severe left ventricular longitudinal dysfunction is a new explanation to the concept of LFLG AS. (Circ Cardiovasc Imaging. 2012;5:27-35.)
Key Words: aorta 䡲 stenosis 䡲 echocardiography 䡲 valves
A
ssessment of aortic stenosis (AS) severity is still chal-lenging. Severe AS usually is defined as mean gradient ⬎40 mm Hg, aortic valve area (AVA) ⬍1 cm2, or indexed AVA ⬍0.6 cm2/m2.1,2However, discrepancies are frequentlyobserved between the mean gradient and the valve area in a single patient.3–5These discrepancies are easy to understand
in patients with low cardiac output secondary to reduced left ventricular ejection fraction (LVEF), but also may occur in patients with apparently normal left ventricular (LV) function.6
Editorial see p 6
Clinical Perspective on p 35
These paradoxical low-gradient severe AS, despite pre-served LVEF, were first described by Hachicha et al,7who
found up to 35% of such cases among patients with AS and normal LV function. These patients were characterized by a low flow, defined by a stroke volume index (SVi) ⱕ35 mL/m2, and had higher valvulo-arterial impedance (Z
va) and
smaller left ventricular dimensions.
Received April 16, 2011; accepted November 1, 2011.
From the Department of Cardiology (J.A., C.M., Y.L., F.T., N.T., C.L., J.-F.A., G.H.), la Timone Hospital, Marseille, France, Assistance Publique des hôpitaux de Marseille (APHM) – Aix-Marseille Université (Aix-Marseille Univ), Marseille France; Service de Sante´ Publique et d’Information Me´dicale (R.G.), la Timone Hospital, Marseille, France; LERTIM EA 3283 (R.G.), Aix-Marseille Universite´, Faculte´ de Me´decine, Marseille, France; Department of Cardiology (F.C., C.S.-D., S.C.), Montpellier, France; Department of Cardiology (X.Z., P.R., S.L.), Bordeaux, France; Service de Cardiologie et Maladies Vasculaires et CIC-IT 804 (E.D.), LTSI INSERM U 642, CHU Rennes, Rennes, France; Department of Cardiology (P.L.), University Hospital, Domaine Universitaire du Sart Tilman, B.35-4000 Lie`ge, Belgium.
Correspondence to Gilbert Habib, Department of Cardiology, la Timone Hospital, Marseille France, Boulevard Jean Moulin 13005, Marseille France, E-mail [email protected]
© 2011 American Heart Association, Inc.
Circ Cardiovasc Imaging is available at http://circimaging.ahajournals.org DOI: 10.1161/CIRCIMAGING.111.967554
Although these patients have been reported to carry a bad prognosis,7,8several uncertainties persist concerning this group of
patients, about its frequency, pathophysiology, and prognosis.3,4
First, many patients present with a low flow, but high (⬎40 mm Hg) mean gradient. Conversely, and more impor-tantly, some patients may present with a mean gradient ⱕ40 mm Hg in spite of a normal flow,3–5 and thus don’t
fulfill criteria for low-flow low-gradient (LFLG) AS. Whether these patients truly have severe AS is still debated.3,4
Second, the explanation for this low flow despite normal LVEF is not completely elucidated. Although elevated global afterload, as attested by a high valvulo-arterial impedance, seems to be the main mechanism, subtle LV dysfunction also has been suspected in these patients, even though their LVEF is normal.6
It was first evidenced by a low midwall fractional shortening7,9
and stroke work index. More recently, 2D strain has been shown to be useful for the early detection of longitudinal LV dysfunc-tion in patients with AS.10 –12 However, no large study has
assessed prospectively the value of 2D strain in assessing early LV dysfunction in this particular group, and it is not known whether LV longitudinal dysfunction is more severe in patients with LFLG AS as compared with other patients with AS.
For these reasons, we conducted a prospective multicenter study aiming to:
describe the characteristics of patients with a normal LVEF and severe AS, with low flow or low gradient.
assess the presence of longitudinal LV dysfunction in these patients using 2D strain imaging.
Methods
Patient Sample
During a 2-year period ending June 2010, patients from 5 centers (Marseille, Lie`ge, Rennes, Bordeaux, and Montpellier) with severe aortic stenosis (aortic valve area ⬍0.6 cm2
/m2
) and normal LVEF (ⱖ50%) were prospectively included in our study. Exclusion criteria were more than mild other valvulopathy, LVEF ⬍50%, segmental hypokinesia/akinesia, and acute coronary syndrome ⬍3 months. This study was approved by Institutional Review Committee and was conducted according to the principles outlined in the Declaration of Helsinki.
Clinical Data
Clinical data included New York Heart Association class, age, gender, history of smoking, treated hypertension or hypercholester-olemia, diabetes, obesity, and coronary disease. Systemic arterial pressure was measured with the use of an arm-cuff sphygmomanom-eter at the time of the echocardiographic study. Mean arterial pressure (MAP) was estimated with the formula MAP⫽2/3 diastolic arterial pressure (DAP) ⫹1/3 systolic arterial pressure (SAP).
Doppler Echographic Data
Conventional 2D echocardiography was performed using commer-cially available equipment (Vivid-7, General Electric Medical Sys-tems, Horten, Norway). Data were acquired with a M3S 3.5 MHz transducer. M-mode, 2-dimensional, color Doppler and pulsed-wave and continuous-wave Doppler data were stored on a dedicated workstation for offline analysis (EchoPAC, GE Healthcare, Horten, Norway). A complete echocardiographic and Doppler examination was performed in all patients, as recommended by Hachicha et al.7
The following parameters were systematically measured.
Aortic Stenosis Severity
The aortic valve area was calculated using the continuity equation, and indexed to the body surface area (BSA). Mean transvalvular gradient (MG) was obtained using the modified Bernoulli equation. The energy loss index (ELI) was calculated with the following formula (aortic cross-sectional area [Aa])13:
ELI⫽( AVA⫻Aa)/( Aa⫺AVA)BSA
LV Afterload
Valvulo-arterial impedance was measured using the formula: Zva⫽
SAP⫹MG SVi
Systemic vascular resistance was calculated using the formula (cardiac output [CO]):
SVR⫽80⫻MAP CO
Systemic arterial compliance was estimated using the following formula:
SAC⫽(SAP⫺DAP)SVi
LV Geometry
Left ventricular dimensions were measured using M-Mode paraster-nal long-axis view. LV mass was estimated using the American Society of Echocardiography/European Association of Echocardiog-raphy recommendations.14
LV Systolic Function
The LVEF was assessed in all patients using the biplane Simpson method. Stroke volume was calculated by multiplying the left ventricular outflow tract area by the left ventricular outflow tract velocity integral measured by PW-Doppler and was indexed for body surface area, to give SVi.
Midwall fractional shortening (MWFS) was calculated using the formula (left ventricular internal diameter [LVID], posterior wall thickness [PWT]):15
MWFS⫽(LVIDd/ 2⫹PWTd/ 2)⫺(LVIDs/ 2⫹PWTs/ 2) (LVIDd/ 2⫹PWTd/ 2)
Stroke work was calculated with the following formula, and then indexed to the LV mass:
SW⫽(MAP⫹MG)⫻SV⫻0.0136
Two-Dimensional Strain Study
Strain quantification was performed offline by using commercially available software (EchoPAC, GE Healthcare, Horten, Norway). We recorded the parasternal midventricular short-axis plane to calculate radial and circumferential strain, and the apical 4-, 2-, and 3-chambers views to calculate global longitudinal strain (GLS).
A line was traced along the inner border of the endocardium on an end-systolic frame. A region of interest was then automatically defined between the endocardial and epicardial borders. Two-dimensional gray-scale images were acquired in the standard apical 4-chamber, 3-chamber, and 2-chamber views at a frame rate ⬎80 frames/s.
GLS was automatically calculated from the 3 apical views strain. A radial and circumferential strain score was determined as the average of the peak systolic strains of 6 myocardial segments.
To ensure the standardization of strain analysis across sites, several precautions were taken, including the use of the same dedicated workstation for offline analysis in the 5 centers, the systematic use and filling of the same data sheet, including an accompanying explanatory sheet, and the review of standardized images in the different centers. In addition, an additional strain variability study was performed (see below).
Groups Definition
Patients were separated into 4 groups, according to their SVi (⬎ or ⱕ35 mL/m2), and their MG (⬎ or ⱕ40 mm Hg), as proposed by Hachicha et al7and Dumesnil et al.5
Group 1: normal flow high gradient: SVi ⬎35 mL/m2
and MG ⬎40 mm Hg
Group 2: low flow, high gradient: SVi ⱕ35 mL/m2
and MG ⬎40 mm Hg
Group 3: normal flow, low gradient (NFLG): SVi ⬎35 mL/m2
and MG ⱕ40 mm Hg
Group 4: low flow, low gradient: SVi ⱕ35 mL/m2
and MG ⱕ40 mm Hg.
In addition, since women have been reported to have higher LV mass in response to aortic stenosis and to have more frequently a low-flow than a normal-flow aortic stenosis,7a specific analysis of differences between men and women was performed, both in the overall population and in each group.
Statistical Analysis
All continuous results are expressed as mean ⫾ standard deviation or as percentages. We used the binomial approach to estimate 95% confidence intervals (CI) of the percentages. Comparisons of the categorical variables among the 4 groups were performed by using the Fisher exact test. Comparisons of the continuous variables among the 4 groups were performed by using the non-parametric Kruskal-Wallis test. Then, when a statistically significant difference was detected in Kruskal-Wallis test, Mann-Whitney U test and Bonfer-roni correction were used in each pair for post hoc analysis. Linear regression was used to assess the LV dysfunction, appraised by the measure of basal longitudinal strain, according to the group (with patients LFLG as reference). Confounders systematically considered for the analysis corresponded to classical demographical factors (age, sex) and to factors identified in univariate analysis (AVA, Zva).We also used likelihood ratio test for testing interactions.
Furthermore, to assess the variability of the measures using 2D-strain, 13 randomly selected patients were evaluated twice by the same observer (JA) for intra-observer variability, by 2 different observers in the same center (JA and GH) for inter-observer variability, and by a third observer from another center (ED) for interinstitutional variability. Variability was quantified computing intraclass correlation coefficient (ICC), with 95% CI obtained using bootstrap method with 1000 replicates.
All statistical analyses were performed with R, using the package psy and the version 2.12, and probability values ⬍0.05 were considered statistically significant with the use of 2-tailed tests.
Results
During the study period, 340 patients were diagnosed as having severe aortic stenosis (aortic valve area ⬍0.6 cm2/m2)
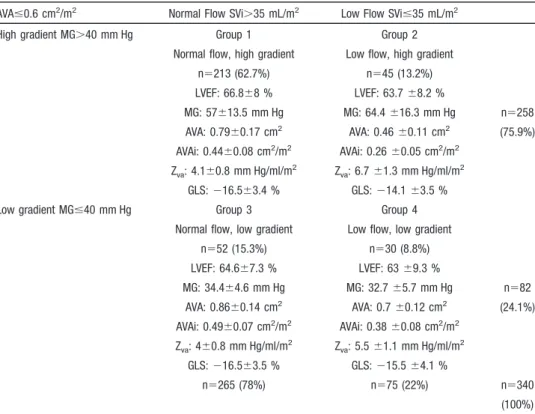
and normal LVEF (ⱖ50%). The repartition of the 340 patients among the 4 groups is presented in Table 1. Table 2 represents the repartition of patients among the 4 groups according to the center. Table 3 compares the clinical and echocardiographic characteristics among the 4 groups. Table 4 represents their strain values.
Table 1. Characterization of 340 Patients Based on Flow (< or >35 mL/m2
) and Gradient (< or>40 mm Hg)
AVAⱕ0.6 cm2/m2
Normal Flow SVi⬎35 mL/m2
Low Flow SViⱕ35 mL/m2
High gradient MG⬎40 mm Hg Group 1 Group 2
Normal flow, high gradient Low flow, high gradient n⫽213 (62.7%) n⫽45 (13.2%) LVEF: 66.8⫾8 % LVEF: 63.7 ⫾8.2 % MG: 57⫾13.5 mm Hg MG: 64.4 ⫾16.3 mm Hg n⫽258 AVA: 0.79⫾0.17 cm2 AVA: 0.46 ⫾0.11 cm2 (75.9%) AVAi: 0.44⫾0.08 cm2/m2 AVAi: 0.26 ⫾0.05 cm2/m2 Zva: 4.1⫾0.8 mm Hg/ml/m2 Zva: 6.7 ⫾1.3 mm Hg/ml/m2 GLS: ⫺16.5⫾3.4 % GLS: ⫺14.1 ⫾3.5 %
Low gradient MGⱕ40 mm Hg Group 3 Group 4
Normal flow, low gradient Low flow, low gradient n⫽52 (15.3%) n⫽30 (8.8%) LVEF: 64.6⫾7.3 % LVEF: 63 ⫾9.3 % MG: 34.4⫾4.6 mm Hg MG: 32.7 ⫾5.7 mm Hg n⫽82 AVA: 0.86⫾0.14 cm2 AVA: 0.7 ⫾0.12 cm2 (24.1%) AVAi: 0.49⫾0.07 cm2/m2 AVAi: 0.38 ⫾0.08 cm2/m2 Zva: 4⫾0.8 mm Hg/ml/m 2 Z va: 5.5 ⫾1.1 mm Hg/ml/m 2 GLS: ⫺16.5⫾3.5 % GLS: ⫺15.5 ⫾4.1 % n⫽265 (78%) n⫽75 (22%) n⫽340 (100%) AVA indicates aortic valve area; AVAi, aortic valve area index; GLS, global longitudinal strain; LVEF, left ventricular ejection fraction; MG, mean gradient; SVi, stroke volume index; Zva, valvulo-arterial impedance.
Table 2. Repartition of Patients Among the 5 Centers
Group 1 Group 2 Group 3 Group 4 TOTAL Marseille 109 (71.7%) 19 (12.5%) 13 (8.6%) 11 (7.2%) 152 Montpellier 19 (54.3%) 5 (14.3%) 7 (20%) 4 (11.4%) 35 Rennes 39 (78%) 2 (4%) 7 (14%) 2 (4%) 50 Bordeaux 24 (51.1%) 12 (25.5%) 7 (14.9%) 4 (8.5%) 47 Liège 22 (39.3%) 7 (12.5%) 18 (32.1%) 9 (16.1%) 56 Global 213 (62.7%) 45 (13.2%) 52 (15.3%) 30 (8.8%) 340
Group 1 Patients: Normal Flow High Gradient Two hundred and thirteen (62.7%, 95% CI: 57.3 to 67.8) patients matched the definition of group 1 (mean gradient
⬎40 mm Hg and SVi ⬎35 mL/m2). There was a high
proportion of men (69%), and a low proportion of diabetic patients (20%).
They were characterized by severe AS (AVA⫽0.79⫾ 0.17 cm2
, aortic valve area index [AVAi]⫽0.44⫾0.08
Table 3. Comparison of Clinical and Echocardiographic Characteristics Among the 4 Groups
Group 1 SVi⬎35 MG⬎40 n⫽213 Group 2 SViⱕ35 MG⬎40 n⫽45 Group 3 SVi⬎35 MGⱕ40 n⫽52 Group 4 SViⱕ35 MGⱕ40 n⫽30 Clinical characteristics Age (y) 71.3⫾11.7 ns 75.2⫾9.2 73.8⫾10 74.6⫾14.7 Men (%) 69 0.008 44 54 63 BSA (m2) 1.8⫾0.18 ns 1.81⫾0.21 1.77⫾0.18 1.85⫾0.17 Hypertension (%) 67 0.04 71 78 56 Diabetes (%) 20 0.03 30 36 41 SAP (mm Hg) 139⫾22 ns 133⫾21 143⫾23 133⫾21 DAP (mm Hg) 74⫾13 ns 72⫾13 74⫾11 70⫾12
Aortic stenosis severity
AVA (cm2) 0.79⫾0.17 cm2†††,‡‡,§ 0.46⫾0.11 cm2***,‡‡‡,§§§ 0.86⫾0.14 cm2**,†††,§§§ 0.70⫾0.12 cm2*,†††,‡‡‡ AVAi (cm2/m2) 0.44⫾0.08†††,‡‡‡,§§ 0.26⫾0.05***,‡‡‡,§§§ 0.49⫾0.07***,†††,§§§ 0.38⫾0.08**,†††,‡‡‡ MG (mm Hg) 57⫾13.5†,‡‡‡,§§§ 64.4⫾16.3*,‡‡‡,§§§ 34.4⫾4.6***,††† 32.7⫾5.7***,††† Vmax (m/s) 4.7⫾0.6‡‡‡,§§§ 4.9⫾0.6‡‡‡,§§§ 3.8⫾0.3***,††† 3.7⫾0.4***,††† ELI (cm2/m2) 0.48⫾0.10†††,‡‡‡ 0.27⫾0.06***,‡‡‡,§§§ 0.55⫾0.09***,†††,§§§ 0.43⫾0.10†††,‡‡‡ LV global afterload Zva(mm Hg/ml/m2) 4.1⫾0.8†††,§§§ 6.7⫾1.3***,‡‡‡ 4⫾0.8†††,§§§ 5.5⫾1.1***,‡‡‡ SVR (mm Hg.min/l) 1315⫾355†††,‡,§§§ 2028⫾528***,‡‡‡ 1467⫾336*,†††,§§§ 1993⫾626***,‡‡‡ SAC (ml/mm Hg/m2) 0.83⫾0.32†††,‡,§§§ 0.53⫾0.16***,‡‡ 0.71⫾0.24*,††,§§ 0.54⫾0.20***,‡‡ LV Geometry LVIDId (mm/m2) 27.5⫾4.5 ns 27.1⫾4 27.3⫾3.9 26.3⫾3.4 LVIDIs (mm/m2) 16.7⫾3.8 ns 17.3⫾3.6 16.6⫾4.1 17.4⫾4 EDVi(ml/m2) 61.4⫾21.8† 52.8⫾21.5* 53.5⫾17.8 50.4⫾15.5 ESVi(ml/m 2) 21⫾10.6 ns 19.5⫾10.7 19.8⫾10.2 19.7⫾8.1 LV mass index (g/m2) 143⫾46 ns 134⫾40 136⫾38 127⫾41 LVOT (mm) 21.6⫾2.2†††,§§§ 19.4⫾1.4***,‡‡‡ 21.1⫾1.8††† 19.8⫾2*** Aortic diameter (mm) 34.1⫾5† 31.6⫾5* 33.5⫾5.9 31.6⫾4.4 LV function LVEF (%) 66.8⫾8 ns 63.7⫾8.2 64.6⫾7.3 63⫾9.3 SVi (ml/m2) 49.9⫾9.4†††,‡‡,§§§ 30.4⫾3.4***,‡‡‡ 45.2⫾7.1**,†††,§§§ 30.6⫾4.1***,‡‡‡ CO (l/min) 6.1⫾1.5†††,‡‡,§§§ 3.8⫾0.8***,‡‡‡ 5.4⫾1.1**,†††,§§§ 3.9⫾1***,‡‡‡ CI (l/min/m2) 3.4⫾0.8†††,‡,§§§ 2.1⫾0.4***,‡‡‡ 3⫾0.6*,†††,§§§ 2.1⫾0.5***,‡‡‡ SW (g.m) 181⫾52†††,‡‡‡,§§§ 118⫾28***,‡‡,§§ 144⫾34***,††,§§§ 95⫾22***,††,‡‡‡ SW/100g (g.m) 78⫾30†††,‡‡,§§§ 53⫾19*** 65⫾26**,§§ 47⫾17***,‡‡ MWFS (%) 22⫾6.4 ns 19.2⫾5.9 21.1⫾5.8 20.8⫾6.5
AVA indicates aortic valve area; AVAi, aortic valve area index; BSA, body surface area; CI, cardiac index; CO, cardiac output; DAP, diastolic arterial pressure; EDVi, end diastolic volume index; ELI, energy loss index; ESVi, end systolic volume index; LV, left ventricular; LVEF, left ventricular ejection fraction; LVIDId, left ventricular internal diameter index in diastole; LVIDIs, left ventricular internal diameter index in systole; LVOT, left ventricular outflow tract; MG, mean gradient; MWFS, midwall fractional shortening; SAC, systemic arterial compliance; SAP, systolic arterial pressure; SVi, stroke volume index; SVR, systemic vascular resistance; SW, stroke work; Vmax, maximal velocity; Zva, valvulo-arterial impedance.
1 symbol: P⬍0.05. 2 symbols: P⬍0.01. 3 symbols: P⬍0.001. *vs group 1. †vs group 2. ‡vs group 3. §vs group 4.
cm2/m2
, mean gradient⫽57⫾13.5 mm Hg, energy loss index⫽0.48⫾0.10 cm2/m2), and normal LV afterload (valvulo-arterial impedance⫽4.1⫾0.8 mm Hg/mL/m2).
LV end-diastolic diameter index and volume index (EDVi)
were within the normal range. LV mass index was high (143⫾46 g/m2).
LV systolic function was apparently normal with normal LVEF, cardiac index, and midwall fractional shortening (MWFS). However, longitudinal deformation was reduced, as attested by low GLS (⫺16.5⫾3.4%), particularly in the basal segments (basal longitudinal strain⫽⫺13.6⫾3.2%).
Group 2 Patients: Low Flow, High Gradient Forty-five (13.2%, 95% CI: 9.8 to 17.3) patients matched the definition of group 2 (mean gradient ⬎40 mm Hg and SVi ⱕ35 mL/m2). The patients were more often women (56%), and they presented with the most severe form of AS.
AVA and AVAi were significantly lower than in group 1 (AVA⫽0.46⫾0.11 cm2, P⬍0.001; AVAi⫽0.26⫾0.05 cm2/ m2
, P⬍0.001). They presented with the highest LV afterload, with a Zva value significantly higher than in group 1
(6.7⫾1.3 mm Hg/mL/m2
, P⬍0.001), and high systemic vas-cular resistance. LVEF did not differ from group 1, but end-diastolic volume index was significantly lower than in group 1 (52.8⫾21.5 mL/m2
, P⬍0.05). SVi (30.4⫾3.4 mL/ m2
, P⬍0.001) and cardiac output (3.8⫾0.8 l/min, P⬍0.001) were significantly lower. Longitudinal function was more severely impaired than in group 1, concerning both GLS (⫺14.1⫾3.5%, P⬍0.001) and basal longitudinal strain (⫺10.9⫾2.8%, P⬍0.001).
Group 3 Patients: Normal Flow, Low Gradient Fifty-two (15.3%, 95% CI: 11.6 to 19.6) patients matched the definition of group 3 (mean gradient ⱕ40 mm Hg and SVi ⬎35 mL/m2).
There was a high proportion of hypertensive (78%) and diabetic (36%) patients in this group.
AS was less severe among these patients, with a higher AVA (0.86⫾0.14 cm2
; P⬍0.01 versus group 1, P⬍0.001 versus group 2) and AVAi (0.49⫾0.07 cm2/m2; P⬍0.001 versus other groups), and a higher energy loss index
(0.55⫾0.09 cm2/m2
, P⬍0.001 versus other groups). Mean gradient (34.4⫾4.6 mm Hg) was lower than in group 1 and 2 (P⬍0.001 for both).
These patients presented with normal Zva(4⫾0.8 mm Hg/
mL/m2), similar to group 1, and comparable LV geometry.
LV systolic function was similar than in group 1, both in terms of LVEF, midwall fractional shortening, and degree of longitudinal dysfunction, as assessed by 2D strain. Global longitudinal strain (⫺16.5⫾3.5%) was similar to group 1, and significantly higher than in group 2 (P⬍0.01). However, basal longitudinal strain (⫺14.8⫾3%) was higher than in group 1 and 2 (P⬍0.001 for both). On the other hand, SVi (45.2⫾7.1 mL/m2
) was higher than in group 2 (P⬍0.001), but lower than in group 1 (P⬍0.01).
Group 4 Patients: Low Flow, Low Gradient Thirty (8.8%, 95% CI: 6.0 to 12.4) patients matched the definition of group 4: low flow low gradient (mean gradient
ⱕ40 mm Hg and SVi ⱕ35 mL/m2). The proportion of
hypertensive patients was the lowest (56%, P⫽0.04), whereas there were more diabetic patients than in the other groups (41%, P⫽0.03). The proportion of men was also high (63%). Aortic stenosis severity based on AVAi was less severe than in group 2 (0.38⫾0.08 cm2/m2
, P⬍0.001), but more severe than in group 1 and 3 (P⬍0.01 and P⬍0.001, respectively). Mean gradient (32.7⫾5.7 mm Hg) was lower than in group 1 and 2 (P⬍0.001 for both).
These patients presented with elevated LV afterload (Zva
5.5⫾1.1 mm Hg/mL/m2) higher than in group 1 and 3
(P⬍0.001), and showed no difference with group 2. LVEF was 63⫾9.3%, and showed no difference with the other groups (p⫽ns). SVi (30.6⫾4.1 mL/m2) was
signifi-cantly lower than in group 1 and 3 (P⬍0.001), and showed no difference with group 2. Midwall fractional shortening was similar than in other groups. However, stroke work index was the lowest (47⫾17 g.m, P⬍0.001 versus group 1, P⬍0.01 versus group 3).
Global longitudinal strain (⫺15.5⫾4.1%) and circumfer-ential showed no difference with other groups. However, basal longitudinal strain was reduced in this group
Table 4. Comparison of LV Strain Among the 4 Groups
Group 1 SVi⬎35 MG⬎40 n⫽213 Group 2 SViⱕ35 MG⬎40 n⫽45 Group 3 SVi⬎35 MGⱕ40 n⫽52 Group 4 SViⱕ35 MGⱕ40 n⫽30
GLS (%) ⫺16.5⫾3.4††† ⫺14.1⫾3.5***,‡‡ ⫺16.5⫾3.5†† ⫺15.5⫾4.1 LS base (%) ⫺13.6⫾3.2†††,§ ⫺10.9⫾2.8***,‡‡‡ ⫺14.8⫾3†††,§§§ ⫺11.6⫾3.4*,‡‡‡ LS mid-LV (%) ⫺15.8⫾3.1††† ⫺13.7⫾3***,‡‡‡ ⫺16.8⫾3.2†††,§ ⫺14.4⫾3.3‡ LS apex (%) ⫺22⫾5.5† ⫺19.5⫾4.9* ⫺21.2⫾6.1 ⫺20.1⫾6.5 RS (%) 35.9⫾16.8 33⫾21 36.7⫾14.5§ 27.9⫾10.5‡ CS (%) ⫺19.6⫾6 ns ⫺17.7⫾6.1 ⫺18.3⫾5.6 ⫺16.1⫾4.7
CS indicates circumferential strain; GLS, global longitudinal strain; LS, longitudinal strain; LV, left ventricular; MG, mean gradient; RS, radial strain; SVi, stroke volume index. 1 symbol: P⬍0.05. 2 symbols: P⬍0.01. 3 symbols: P⬍0.001. *vs group 1. †vs group 2. ‡vs group 3. §vs group 4.
(⫺11.6⫾3.4%), significantly lower than in groups 1 (P⬍0.05) and 3 (P⬍0.001). After adjustment for age, sex, AVA, and Zva, basal longitudinal strain in this group
re-mained significantly lower than in groups 1 (P⬍0.01) and 3 (P⬍0.01). Radial strain also was significantly lower than in group 3 (27.9⫾10.5% versus 36.7⫾14.5%, P⬍0.05). Gender Differences Between Groups
Proportion of men was higher in the overall population (63%) and in the LFLG group (63%). In the overall population, despite similar aortic stenosis severity, LV hypertrophy and mass were significantly higher among men. Same results were observed in groups 1 and 3. In groups 2 and 4, however, no difference was observed between men and women regard-ing neither AS severity nor LV hypertrophy (Table 5). Reproducibility of Strain Measurements
Intra-observer, inter-observer, and interinstitutional reproducibil-ity was good for GLS (ICC⫽0.95 [95% CI: 0.86 to 0.98], 0.94 [95% CI: 0.84 to 0.98], and 0.96 [95% CI: 0.86 to 0.99], respectively) and mean basal longitudinal strain (ICC⫽0.94 [95% CI: 0.84 to 0.98], 0.97 [95% CI: 0.94 to 0.99], and 0.97 [95% CI: 0.89 to 0.99], respectively), but lower for radial strain (ICC⫽0.76 [95% CI: 0.38 to 0.90], 0.70 [95% CI: 0.10 to 0.92], and 0.64 [95% CI: 0.04 to 0.91], respectively) and circumferen-tial strain (ICC⫽0.77 [95% CI: 0.43 to 0.92], 0.76 [95% CI: 0.46 to 0.87], and 0.71 [95% CI: 0.32 to 0.90], respectively).
Discussion
Our study presents one of the largest series of prospectively assessed patients with LF or low-gradient aortic stenosis. The main results of our study are as follows:
1. Patients with low-gradient severe AS and preserved LVEF can be subdivided into 2 groups depending on their stroke volume index.
a. Patients with low flow (ⱕ35 mL/m2) represent “true”
severe low-flow low-gradient AS and represent only 8.8% of cases in our series. They are characterized by severe AS, elevated LV afterload, and impaired intrinsic LV myocardial function evidenced by speckle tracking imaging.
b. Patients with normal-flow AS are more frequent (15.3%) and present with less severe AS, normal LV afterload, and less severe LV dysfunction by 2D strain. 2. Subtle LV dysfunction can be evidenced by 2D strain in the majority of patients with severe AS and normal LVEF. Longitudinal LV dysfunction is particularly severe in AS with low cardiac output, including low-flow high-gradient and LFLG AS.
Definition of Severe Aortic Stenosis
The definition of what a severe stenosis is has changed during the past years,1,16,17 and it differs from one guideline to
an-other.1,2 Most recent guidelines consider an AS severe when
valve area is ⬍1 cm2, indexed AVA ⬍0.6 cm2/m2, or mean gradient ⬎40 mm Hg. Although the American guidelines stip-ulate that “when stenosis is severe and cardiac output is normal, the mean transvalvular pressure gradient is generally greater than
40 mm Hg”, the clinical practice is quite different. This definition has been questioned in the past few years for the following reasons.3,4
Discrepancies between gradient and surface are frequent, even in patients with an apparently normal LV function. It was observed in 35% of patients in the series of Hachicha et al,730%
in the series of Minners et al,3and 24% in our series. The most
frequent condition is represented by patients with low gradient despite severe AS and apparently normal LV function. In a series of 512 consecutive patients with severe AS and LVEF ⬎50%, Hachicha observed that these patients were characterized by lower LV volumes, higher LV afterload, and low 3-year survival.
However, other authors reached different conclusions. Min-ners et al,3 in a series of 2427 severe AS with normal LV
Table 5. Gender Differences Between the 4 Groups
Men Women P Group 1 N (%) 147 (69%) 65 (31%) Age (y) 70.2⫾11.5 73.6⫾12 0.047 AVA (cm2) 0.81⫾0.18 0.73⫾0.16 0.0009 AVAi (cm2/m2) 0.44⫾0.08 0.44⫾0.09 0.8 MG (mm Hg) 56.7⫾13.7 57.5⫾13.3 0.68 LV mass (g/m2) 151⫾49 127⫾34 0.0004 Group 2 N (%) 20 (44%) 25 (56%) Age (y) 75⫾9.1 75.3⫾9.4 0.96 AVA (cm2) 0.57⫾0.09 0.42⫾0.10 0.0009 AVAi (cm2/m2) 0.27⫾0.05 0.25⫾0.06 0.14 MG (mm Hg) 60.2⫾15.5 67.8⫾16.4 0.13 LV mass (g/m2) 132⫾40 136⫾41 0.75 Group 3 N (%) 29 (54%) 24 (46%) Age (y) 73.7⫾9.6 74.5⫾10.9 0.75 AVA (cm2) 0.89⫾0.15 0.83⫾0.10 0.11 AVAi (cm2/m2) 0.48⫾0.07 0.50⫾0.07 0.2 MG (mm Hg) 34.5⫾4.4 34.1⫾4.9 0.74 LV mass (g/m2) 152⫾39 117⫾24 0.0004 Group 4 N (%) 19 (63%) 11 (37%) Age (y) 73⫾17.7 77.5⫾7 0.43 AVA (cm2) 0.71⫾0.13 0.68⫾0.11 0.57 AVAi (cm2/m2) 0.37⫾0.08 0.40⫾0.07 0.38 MG (mm Hg) 34.3⫾5.2 29.9⫾5.4 0.04 LV mass (g/m2) 131⫾41 121⫾44 0.50 Overall N (%) 215 (63%) 125 (37%) Age (y) 71.4⫾11.8 74.5⫾10.9 0.016 AVA (cm2) 0.79⫾0.19 0.68⫾0.19 ⬍0.0001 AVAi (cm2/m2) 0.42⫾0.10 0.41⫾0.12 0.34 MG (mm Hg) 52.1⫾15.6 52.6⫾17.9 0.76 LV mass (g/m2) 147⫾46 126⫾35 ⬍0.0001
AVA indicates aortic valve area; AVAi, aortic valve area index; LV, left ventricular; MG, mean gradient.
function, found 30% of such inconsistent findings, and remind that, according to previous studies using Gorlin formula,18an
AVA of 1 cm2 corresponds to a gradient of only 26 mm Hg.
Thus, if these discrepant gradings may be explained by reduced stroke volume, they rather proposed a cut-off value of 0.8 cm2to
define severe AS.
Similarly, Janders4 underlined that, if these inconsistent
grading could be related to “paradoxical” low flow, inaccu-rate measurements of AVA and inconsistent cut-off values may also contribute to inconsistent severity grading. He proposed that a transesophageal echocardiographic examina-tion should be added to assess morphology of the aortic valve and obtain a more precise measurement of the left ventricular outflow tract diameter.4
Finally, several patients with severe AS and preserved LV function do not fit in the “low flow low gradient” category. A significant number present with low flow (ⱕ35 mL/m2) but high gradient, while another group present low gradient despite normal flow.4 This latter group possibly represents nonsevere
AS, and it is crucial to clearly identify these patients, because therapeutic strategy could be different.
More recently, Dumesnil et al5reassessed their series of
512 patients and separated them into 4 subgroups accord-ing to presence of normal or reduced flow (SVI ⬎or ⱕ35 mL/m2
) and high or low gradient (⬎or ⱕ40 mm Hg). They clearly confirmed that low gradient could be observed in some patients with normal flow and that, conversely, high gradient could be observed in some patients with low flow. Low-Gradient AS
Our results confirm the series of Dumesnil et al, showing that low-gradient AS despite normal LVEF was a frequent finding, representing 24% of all cases of aortic stenosis with normal LVEF. This pattern has been observed in up to 35% of patients with severe AS and normal LVEF and has been shown to be associated with higher global LV afterload, more pronounced concentric remodelling, and lower survival if not operated.7
However, the main result of our study is that the incidence of “true severe” LFLG AS was lower, representing only 8.8% of the patients. It is interesting to note that this low percentage was similarly observed in each of the 5 centers involved in the study (Table 2). As observed by Hachicha et al,7 these patients are
characterized by their advanced age, severe AS
(AVA⫽0.38⫾0.08 cm2/m2), nondilated left ventricles, and low cardiac output. As in previous reports, we found that the main mechanism for the low cardiac output was elevated global afterload as attested by high Zva, high vascular resistance, and
reduced arterial compliance. In addition, left ventricular dys-function despite normal LVEF was evidenced by 2D strain imaging, showing reduced longitudinal contraction, particularly among the basal segments. The lower incidence of LFLG in our series as compared with the series of Hachicha probably reflects differences in patient recruitment. However, in the most recent series from the same center,5LFLG AS represented only 24% of
all AS with normal LVEF.
Conversely, we observed that a larger number of patients (15.3%) presented with low gradient, but did not fulfill the criteria for LFLG AS, because they presented with normal flow. As compared with LFLG AS, these patients were quite different,
with less severe AS, normal LV afterload, and less depressed longitudinal function, as assessed by 2D strain (Figure). Al-though these patients have severe AS in terms of AVA, this stenosis is less severe than in other groups. It has been proposed that the discrepancy between low gradient and low AVA could be related to inaccurate echocardiographic measurement of the left ventricular outflow tract or inconsistent cut-off values of gradient and AVA in current recommendations.4These patients
represent up to 38% of AS with normal LVEF in the recent series of Dumesnil et al,5who confirmed the lower degree of
severity of AS in this group in their series.
Role of Speckle-Tracking Imaging in Assessing Left Ventricular Function in LFLG AS
The presence of LV dysfunction despite normal LVEF in aortic stenosis has been proved by several studies. It was first suspected by the presence of a low midwall fractional shortening,7,9 and more recently by the evidence of LV
longitudinal dysfunction despite normal LVEF in AS by 2D strain studies.10,11 LV longitudinal contraction is impaired
early in situations of high afterload19 and thus could be
potentially particularly impaired in the subgroup of patients with LFLG AS, which are characterized by elevated after-load. Speckle-tracking imaging recently has been applied to patients with LFLG AS. In a series of 173 patients with severe asymptomatic AS, Lancellotti et al12found that
intrin-sic myocardial dysfunction, as assessed by 2D strain, was particularly common in patients with increased global LV afterload, especially in the subset of patients with low-flow AS. However, in these studies, the number of patients with low-flow and low-gradient AS was low.
Our study is the first large multicenter study to prospectively assess the value of 2D strain in assessing early LV dysfunction in these patients. We found that longitudinal dysfunction was very common in all 4 groups of patients with AS and normal LVEF, but that LV longitudinal function was particularly im-paired in the 2 groups with high afterload, that is patients with low-flow high-gradient and LFLG AS (groups 2 and 4). Inter-estingly, LV longitudinal dysfunction was clearly more marked in group 4 (LFLG AS) than in group 3 (NFLG AS), confirming that the hemodynamic status and severity of AS of both groups are quite different. The fact that this difference was particularly evidenced on longitudinal strain, and less in its radial compo-nent, probably reflects the earlier impairment of longitudinal function in these patients. In addition, the better intra-observer, inter-observer, and interinstitutional reproducibility observed in our study for longitudinal strain as compared with radial and circumferential strain is in favor of the preferential use of longitudinal strain for early detection of left ventricular dysfunc-tion in patients with AS.
Clinical Implications
In clinical practice, when facing patients with severe AS and low gradient despite normal left ventricular ejection fraction, 2 parameters are of major importance for differentiating patients with LFLG AS from patients with NFLG AS.
1. Valvulo-arterial impedance allows an evaluation of LV afterload. It is significantly elevated in LFLG AS, and has been shown to be an independent prognostic factor.7
2. 2D strain allows an evaluation of LV longitudinal dysfunc-tion. Longitudinal dysfunction is more severe in patients with LFLG AS than in patients with NFLG AS. The combined evaluation of global afterload (by valvulo-arterial impedance measurement) and of longitudinal systolic function (by 2D strain measurements) provides an optimal assessment of patients with low-gradient severe AS despite
normal LV ejection fraction. This evaluation may help in separating patients with low-gradient AS into 2 groups of different severity.
Conclusions
LFLG AS is observed in 9% of patients with severe AS and normal ejection fraction and is characterized by elevated Figure.Illustrative cases of 2 patients with normal flow low gradient (left panel) and low flow low gradient (right panel) aortic stenoses with normal ejection fraction. Although both patients present with severe aortic stenosis (aortic valve area ⬍1 cm2and indexed aortic valve area ⬍0.6 cm2/m2), the patient with low flow low gradient (right panel) is characterized by a lower stroke volume index (upper panels), higher valvulo-arterial impedance (middle panels), and lower basal longitudinal strain (lower panels) as compared with the patient with normal flow low gradient (left panel) aortic stenosis.
global afterload and reduced longitudinal systolic function. Patients with normal-flow low-gradient AS are more frequent and present with less severe AS, normal LV afterload, and less severe LV dysfunction by 2D strain. In addition to elevated afterload, the severe longitudinal dysfunction docu-mented by 2D strain gives a new explanation to the concept of LFLG AS. The prognostic significance of these findings needs further investigation.
Disclosures
None.References
1. Bonow RO, Carabello BA, Kanu C, de Leon AC Jr., Faxon DP, Freed MD, Gaasch WH, Lytle BW, Nishimura RA, O’Gara PT, O’Rourke RA, Otto CM, Shah PM, Shanewise JS, Smith SC Jr., Jacobs AK, Adams CD, Anderson JL, Antman EM, Faxon DP, Fuster V, Halperin JL, Hiratzka LF, Hunt SA, Lytle BW, Nishimura R, Page RL, Riegel B. ACC/AHA 2006 guidelines for the management of patients with valvular heart disease: a report of the American College of Cardiology/American Heart Association Task Force on Practice Guidelines (writing committee to revise the 1998 Guidelines for the Management of Patients With Valvular Heart Disease): developed in collaboration with the Society of Cardio-vascular Anesthesiologists: endorsed by the Society for CardioCardio-vascular Angiography and Interventions and the Society of Thoracic Surgeons. Circulation. 2006;114:e84 – e231.
2. Vahanian A, Baumgartner H, Bax J, Butchart E, Dion R, Filippatos G, Flachskampf F, Hall R, Iung B, Kasprzak J, Nataf P, Tornos P, Torracca L, Wenink A. Guidelines on the management of valvular heart disease: The Task Force on the Management of Valvular Heart Disease of the European Society of Cardiology. Eur Heart J. 2007;28:230 –268. 3. Minners J, Allgeier M, Gohlke-Baerwolf C, Kienzle RP, Neumann FJ,
Jander N. Inconsistencies of echocardiographic criteria for the grading of aortic valve stenosis. Eur Heart J. 2008;29:1043–1048.
4. Jander N. Low-gradient ‘severe’ aortic stenosis with preserved ejection fraction: new entity, or discrepant definitions? Euro Heart J. 2008; 10(Supplement E):E11–E15.
5. Dumesnil JG, Pibarot P, Carabello B. Paradoxical low flow and/or low gradient severe aortic stenosis despite preserved left ventricular ejection fraction: implications for diagnosis and treatment. Eur Heart J. 2010;31: 281–289.
6. Pibarot P, Dumesnil JG. Longitudinal myocardial shortening in aortic stenosis: ready for prime time after 30 years of research. Heart. 2010; 96:95–96.
7. Hachicha Z, Dumesnil JG, Bogaty P, Pibarot P. Paradoxical low-flow, low-gradient severe aortic stenosis despite preserved ejection fraction is associated with higher afterload and reduced survival. Circulation. 2007; 115:2856 –2864.
8. Barasch E, Fan D, Chukwu EO, Han J, Passick M, Petillo F, Norales A, Reichek N. Severe isolated aortic stenosis with normal left ventricular systolic function and low transvalvular gradients: pathophysiologic and prognostic insights. J Heart Valve Dis. 2008;17:81– 88.
9. Cramariuc D, Cioffi G, Rieck AE, Devereux RB, Staal EM, Ray S, Wachtell K, Gerdts E. Low-flow aortic stenosis in asymptomatic patients: valvular-arterial impedance and systolic function from the SEAS Substudy. J Am Coll Cardiol Cardiovasc Imaging. 2009;2:390 –399. 10. Delgado V, Tops LF, van Bommel RJ, van der Kley F, Marsan NA,
Klautz RJ, Versteegh MI, Holman ER, Schalij MJ, Bax JJ. Strain analysis in patients with severe aortic stenosis and preserved left ventricular ejection fraction undergoing surgical valve replacement. Eur Heart J. 2009;30:3037–3047.
11. Lafitte S, Perlant M, Reant P, Serri K, Douard H, DeMaria A, Roudaut R. Impact of impaired myocardial deformations on exercise tolerance and prognosis in patients with asymptomatic aortic stenosis. Eur J Echo-cardiogr. 2009;10:414 – 419.
12. Lancellotti P, Donal E, Magne J, O’ConnorK, Moonen ML, Cosyns B, Pierard LA. Impact of global left ventricular afterload on left ventricular function in asymptomatic severe aortic stenosis: a two-dimensional speckle-tracking study. Eur J Echocardiogr. 2010;11:537–543. 13. Garcia D, Pibarot P, Dumesnil JG, Sakr F, Durand LG. Assessment of
aortic valve stenosis severity: a new index based on the energy loss concept. Circulation. 2000;101:765–771.
14. Lang RM, Bierig M, Devereux RB, Flachskampf FA, Foster E, Pellikka PA, Picard MH, Roman MJ, Seward J, Shanewise J, Solomon S, Spencer KT, St. John Sutton M, Stewart W. Recommendations for chamber quantification. Eur J Echocardiogr. 2006;7:79 –108.
15. de Simone G, Devereux RB, Roman MJ, Ganau A, Saba PS, Alderman MH, Laragh JH. Assessment of left ventricular function by the midwall fractional shortening/end-systolic stress relation in human hypertension. J Am Coll Cardiol. 1994;23:1444 –1451.
16. Bonow RO, Carabello B, de Leon AC Jr., Edmunds LH Jr., Fedderly BJ, Freed MD, Gaasch WH, McKay CR, Nishimura RA, O’Gara PT, O’Rourke RA, Rahimtoola SH, Ritchie JL, Cheitlin MD, Eagle KA, Gardner TJ, Garson A Jr., Gibbons RJ, Russell RO, Ryan TJ, Smith SC Jr. Guidelines for the management of patients with valvular heart disease: executive summary. A report of the American College of Cardiology/ American Heart Association Task Force on Practice Guidelines (Com-mittee on Management of Patients with Valvular Heart Disease). Circulation. 1998;98:1949 –1984.
17. Baumgartner H, Hung J, Bermejo J, Chambers JB, Evangelista A, Griffin BP, Iung B, Otto CM, Pellikka PA, Quinones M. Echocardiographic assessment of valve stenosis: EAE/ASE recommendations for clinical practice. Eur J Echocardiogr. 2009;10:1–25.
18. Gorlin R, Gorlin SG. Hydraulic formula for calculation of the area of the stenotic mitral valve, other cardiac valves, and central circulatory shunts. Am Heart J. 1951;41:1–29.
19. Donal E, Bergerot C, Thibault H, Ernande L, Loufoua J, Augeul L, Ovize M, Derumeaux G. Influence of afterload on left ventricular radial and longitudinal systolic functions: a two-dimensional strain imaging study. Eur J Echocardiogr. 2009;10:914 –921.
CLINICAL PERSPECTIVE
In a multicenter study concerning low-flow low-gradient aortic stenosis (LFLG AS) despite normal ejection fraction, the role of speckle tracking echocardiography in detecting subtle left ventricular dysfunction is reported. In addition to elevated afterload, the severe longitudinal dysfunction documented by 2D strain in these patients gives a new explanation to the concept of LFLG AS. The main findings of our study are twofold. First, among patients with severe AS, low gradient, and normal LV ejection fraction, 2 different patterns can be observed, with different hemodynamic characteristics and aortic severity. LFLG AS is observed in 9% of patients and is associated with high global afterload and reduced longitudinal systolic function. Patients with NFLG AS are more frequent and present with less severe AS, normal afterload, and less severe longitudinal dysfunction. Second, in clinical practice, 2 parameters are of major importance in the evaluation of patients with low-gradient severe aortic stenosis despite normal ejection fraction. Valvulo-arterial impedance allows an evaluation of LV afterload. It is significantly elevated in LFLG AS, and has been shown to be an independent prognostic factor. LV longitudinal dysfunction can be observed by 2D strain and is more severe in patients with LFLG AS as compared with other groups. The combined evaluation of global afterload (by valvulo-arterial impedance measurement) and of longitudinal systolic function (by 2D strain measurements) provides an optimal assessment of patients with low-gradient severe AS despite normal LV ejection fraction. This evaluation may help in separating patients with low-gradient AS into 2 groups of different severity.