Journal of Dairy Research (1986), 53, 271-283 Printed in Great Britain 2 7 1
An empirical mathematical model of retentate composition in
ultrafiltration of dairy products
BY OLIVIER DE RHAM AND SERGE CHANTON NESTEC LTD, Nestle Research Department, CH-1800 Vevey,
Switzerland
(Received 2 January 1985 and accepted for publication 27 August 1985)
SUMMARY. Analysis of retentates of milk or whey, ultrafiltered and diafiltered by a pilot batch process with DDS Lab module equipment or (whey only) ultrafiltered by an industrial continuous process showed that nitrogen and ionic contents could not be described mathematically by the use of any value of the retention coefficient K. Analytical data suggested a new concept called segregation for nitrogen and ions in which each of these components consists of a completely permeable fraction and a totally retained fraction that do not exchange. A segregation coefficient Y is then defined as the ratio of the totally retained fraction to the total concentration of the species in the product fed to the equipment. However, this concept does not apply to lactose, where the classic retention concept (K) is retained. The two models are equivalent when K = Y = 0 or K = Y = 1. A first mathematical expression of this model was elaborated for batch ultrafiltration and/or constant volume diafiltration. Another set of equations was established for industrial conditions. These empirical models predict the retentate and permeate composition at any time during processing as well as after drying. The fit of analytical data with computed values was generally fair, with K being 01-0-4 in the pilot plant, and 0-1 in the factory. The nitrogen Y value was ~ 0-95 for milk, and 0-85 for whey. In whey, the calcium Y value varied
greatly from 0-06-0-71 depending on the pH, citrate content and heat treatment; in
milk it was fairly constant at 0-5 at pH 67-5-8.
Ultrafiltration (UF) and diafiltration (DF) of milk and/or whey yield retentates with various lactose: protein: ash ratios. It is of value to be able to monitor the process to a given composition of the retentate. This needs a model accommodating various raw materials, pretreatments and processing conditions.
Mathematical descriptions of the behaviour of the individual components during UF and DF do exist, but they have usually been derived theoretically, or from small laboratory equipment, and do not apply satisfactorily to pilot or industrial processes. In addition, often they do not describe both UF and DF.
The aim of this work was to establish an empirical model to describe the retentate composition during UF and DF of milk and whey, and to test this model under a variety of conditions.
272 0 . DE RHAM AND S. CHANTON
THEORIES OF ULTRAFILTRATION
In their review on UF, Glover et al. (1978) described membrane retention by equation 1: ^
K K=iNw
p *N\/Nwr *NSp ( 1 )
N is the mol fraction of species s or water w, in the retentate r or the permeate p; K is the retention coefficient.
This can be simplified for dilute solutions by replacing the mol fraction N with the concentration C to obtain the classic equation 2:
Walstra & Jenness (1984) proposed a reflection coefficient Q defined as:
q flux; C concentration; w water; s species.
This can also be simplified for dilute solutions to equation 2, with Q = K. Another approach was given by Green et al. (1984) who defined the concentration
factor Fs of a species 5 in batch UF ps
Cs, actual concentration of s; Cs0 , initial concentration of s.
Using casein and fat as internal standards in milk, they defined the retention coefficient Rs, the relative increase in the concentration of s compared to that of a fully
retained species. F — F
Us = ~S, JT> (5)
Fcj, F for casein and fat.
In a first approximation Fcj = the volume concentration factor (VCF), and
Fs — Fw = Fs — l, which allows simplification of equation 5 to
(6)
The actual concentration Cs has increased over the initial concentration Cs0 in batch
U F b y /-is /~is p * ns
Although R is called the retention coefficient, it is not equivalent to K. These authors (Green et al. 1984) did not further elaborate on its origin, applicability and consequences, nor on its constancy during processing and did not even calculate it for their various constituents and conditions. From their data, R is fairly constant
in milk with VCF for biotin, pantothenate, folate, riboflavin and vitamin B12 but not
for nicotinamide or thiamin. It is negative in some cases. If R is constant, the variation of the concentration in function of VCF is linear.
Experimentally, Brule et al. (1974) showed that calcium increased linearly with VCF in milk retentate, and was constant in permeate, this being confirmed by Bennasar et al. (1982). Mehaia & Cheryan (1983) measured the calcium content of whey permeate as independent of VCF, and Garoutte et al. (1983) obtained a constant nitrogen content in whey permeate. As shown in the results section, we observed the same type of situation during whey and milk UF and DF.
Model for UF retentate composition 273
These observations cannot be satisfactorily explained in terms of retention by
equation 2. Retention coefficients can account for neither the residual ash content,
nor the protein content of the concentrate after exhaustive DF, unless they are
changed during processing, as described by Glover et al. (1978) and Hiddink et al.
(1978), and tend towards 1-0 in DF. At present, such a variation cannot be explained
in physicochemical terms, which is an unfortunate situation for a supposedly constant
coefficient.
EMPIRICAL MATHEMATICAL MODEL
In order to give a satisfactory mathematical description of our analytical data,
we elaborated for dilute solutions an empirical model (de Rham & Chanton, Nestec
Research Report No 1100, 20 June, 1984). For nitrogenous compounds and for ions
(sodium, potassium, chloride, calcium, magnesium, phosphate and citrate), we
denned the concept of segregation: the species considered is made of two fractions
that do not exchange. The segregation coefficient Y is denned as the ratio (in the
solution fed to the equipment) of one fraction to the total concentration of species
s (C
s0). This segregated fraction [C
s0* Y] behaves as if it was fully retained by the
membrane: it increases proportionally to the volume concentration factor VCF
during UF and is constant during DF. The unsegregated fraction [C
s0*(1— Y)]
behaves as if it was fully permeable: it is constant during UF, and decreases
proportionally to the diafiltration efficiency (DFE) = exp(— W/V) during DF (V is
the constant retentate volume, W the volume of DF water added).
Thus, we abandoned the retention concept for nitrogenous compounds and ions,
but kept it for lactose as it more adequately described lactose concentration than did
segregation.
For fat, the situation can be described by either concept, as both yield identical
values when K = Y = 1 (as well as for K = Y = 0).
Ashes are calculated in our model as the sum of sodium + potassium + chloride +
calcium + magnesium + phosphate, and the total solids as the sum of lactose+
TN x 6-38 + fat + citrate + ash.
A first mathematical expression of this model was set up. In batch UF, the total
concentration C
sof a segregated species s is then
C
s= C
s0*Y*VCF + C
s0*(l~Y) (7)
C
s0, initial concentration of s, in the feed solution; C
s, actual content of s in the
retentate.
In constant volume DF
C
S= C\ *Y+C
s0*(l-Y)*exp(-W/V) (8)
V, constant retentate volume; W water (or permeate) volume.
As VCF = 1 in DF and W = 0 in UF, equations 7 and 8 are particular cases of
the more general equation
*(l-Y)*exp(-W/V), (9)
that is valid for combined UF/DF, with DF before or after UF or even interrupting
UF (with proper selection of V of course).
Equation 9 is best represented in two linear plots: for batch UF conditions the
abscissa is the VCF (1 to N); for constant volume DF the abscissa is the DFE
(between 1 and 0) and it can be simply juxtaposed next to or inserted in the UF plot
Downloaded from https:/www.cambridge.org/core. University of Basel Library, on 11 Jul 2017 at 07:57:34, subject to the Cambridge Core terms of use,274 0 . DB RHAM AND S. CHANTON
Ultrafiltration Diafiltration
ib)
2 3 Vol. concn. factor
Ultrafiltration Oiafiltration efficiency Diafiltration c 40 20 •
Vol. concn. factor Diafiltration efficiency
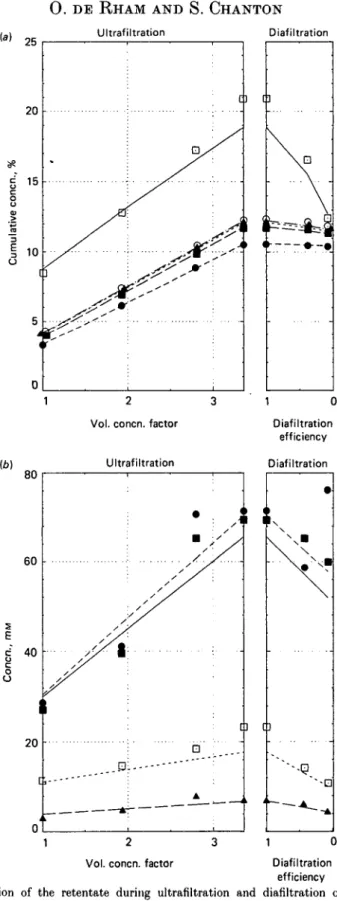
Fig. 1. Composition of the retentate during ultrafiltration and diafiltration of raw skim milk (pH 67, 15 °C, pilot plant batch process), (a) Cumulative gross composition; points, analytical data; lines, computed data. 0 , Protein; • , ash: A , citrate; O , fat; • , lactose (computed) or total solids (analysed). (6) Individual contents of polyvalent ions; points, analytical data; lines, computed data. • , Calcium; A , magnesium;
-, phosphate; • , citrate. Abscissa definition: see text.
Model for UF retentate composition 275
(see Fig. 1). The concentration of a segregated species is represented by segments, ascending in UF and descending in DF, when the linear ordinate is w/w concentration. The concentration of lactose (retained species) yields two curved traces in the graph when calculated using equation 2 with sequential withdrawings of 100 ml portions of permeate (not compensated in UF, replaced by water in DF).
A second mathematical expression of this model was set up with other equations that described steady-state situations prevailing in modules in series with individual recirculation and addition of DF water (or other solution). The two sets of equations, based on the above experimental designs were developed and set up in computer programs. Other experimental designs can also be considered and made to a mathematical model, providing that the liquid mass balance (for batch systems) or the flux balance (continuous systems) is characterized.
MATERIALS AND METHODS
Raw materials and processes
Sweet cheese whey was prepared in our pilot plant by rennet coagulation of raw skim milk at 37 °C, reclaimed by centrifugation of the curd after syneresis at 45 °C, and lyophilized. Hydrochloric acid whey was obtained from raw skim milk after adjustment of the pH to 4-5 with cone. HC1 and centrifugation of the casein. An ionic
model of whey was prepared by mixing solutions of CaCl2, MgCl2, K3 citrate, Na3
citrate, KH2PO4 and KOH to the following final concentrations: 8 mM-calcium,
3 mM-magnesium, 15 mM-sodium, 30 mM-potassium, 8 mM-citrate, 14 mM-phosphate and 22 mM-chloride at pH 67.
Batches of 60 1 of these materials were ultrafiltered in batch recirculation to a concentration factor of 10 (6 1) followed by DF at constant volume with 15 1 (2-5 vol.) demineralized water.
Raw skim milk was used as such or after acidification with cone. HC1 to pH 5-8, in batches of 28 1 at 15 °C, ultrafiltered to a concentration factor of 3-5 (8 1) and diafiltered with 24 1 (3 vol.) demineralized water.
The pilot plant equipment was a 20 cm DDS Lab module (Kundert Ing., Zurich,
Switzerland) with 20 GR61PP membranes (0-32 m2), operated at 50 °C (or 15 °C in
some cases), 1-2 MPa inlet and 0-4 MPa outlet pressures. A feed rate of 8 1/min was supplied by a piston pump.
Samples were taken at the beginning and at defined VCF or DFE.
The industrial line had seven modules in series with individual recirculation loops,
with 27 m2 each of GR61PP membranes. Operation was conducted at about 15 °C,
feed rate 2400 1/h, recirculation rate 40 m3/h, pressures between 010 and 0-12 MPa.
The cheese whey was pasteurized at 72 °C for 15 s. Samples of retentates and permeates were taken on every module outlet.
Analyses
All samples were analysed for total solids (TS), total nitrogen, ash, calcium, magnesium, phosphate and citrate. Some selected samples were analysed for lactose to confirm the additivity of the components (protein + fat + ash + citrate + lactose) to TS. The additivity of sodium + potassium + chloride + calcium + magnesium + phos-phate to ash was also controlled. The final retentates were lyophilized and analysed for all the components mentioned above, and for fat. The additivity was quite good to 94-96% TS, leaving 4-6% residual moisture.
10 mp.«
276 0 . DE RHAM AND S. CHANTON Table 1. Retention and segregation coefficients
Product Skim milk
pH6-7 pH5-8 Whey pH 67 Skim milk + whey
(1 vol. + 3-2 vol.) pH6-7 pH5-8 Whey pH 67 Temp. °C 15 15 50 50 50 15 Lactose coefficient Calcium Pilot plant bate! 0-3 0-5 0-4 0-5 0-25 0-38 0-3 0-35 0-3 0-30 Segregation coefficients Magnesium I process 0-3 0-3 018 0-20 0-20 Factory continuous process
0 1 017 008 Phosphate 0-55 0-4 016 0-35 0-20 008 Citrate 0-25 0-5 0 1 0 1 5 0-20 001 Nitrogen 0-95 0-95 0'86 0-90 0-90 0-91
The analytical methods were standard in our laboratory: TS on a Mettler LP12 thermobalance (Mettler AG, 8604 Volketswil, Switzerland), total nitrogen by micro-Kjeldahl with a Biichi 425/322/342 system, ash by dry ashing at 550 °C overnight, cations by atomic absorption spectrophotometry (Perkin Elmer 603-Uberlingen, FRG), phosphate by the International Dairy Federation method No. 33 (1966) and citrate either by the Marier & Boulet (1958) technique, or enzymically using a Boehringer (Mannheim, FRG) kit. Lactose was determined by the phenol-sulphuric acid method (Dubois et al. 1956), and fat by the NMR relaxation time technique (C. Desarzens, Physics section, Nestle research department), on a Bruker Minispec PC 20 apparatus (Bruker Physik AG, Karlsruhe, FRG).
RESULTS
In all experiments, the total nitrogen content of the retentate during UF fitted closely the segregation concept. This allowed us to use it as an internal standard, and to correct values in the retentate during DF for the uncertainty in controlling the retentate volume, and for losses (sampling and leaks).
Skim milk
In Fig. 1, the points represent the analytical results on the retentate during UF and DF of raw skim milk at pH 6-7. The lines represent the computed values according to the model described. A cumulative representation of the concentrations of the major components is given in Fig. 1 (a), and the individual polyvalent ion contents in Fig. 1 (b). The set of coefficients used in the model is given in Table 1. The comparison of analytical and computed values for the final lyophilized retentate is given in Table 2.
Sweet whey
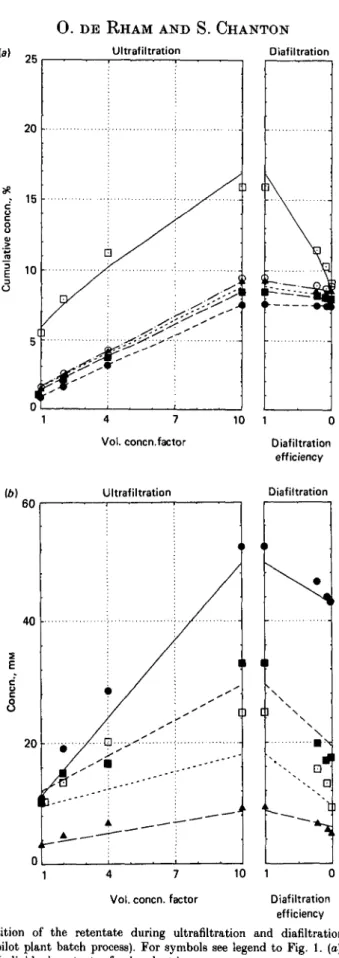
The same presentation of the results is adopted for the sweet whey experiment in the pilot plant in Fig. 2 (a) and (b), and in Tables 1 and 2. The results obtained with a mixture of 1 vol. skim milk with 32 vol. whey are presented in Fig. 3(a) and (b) and in Tables 1 and 2.
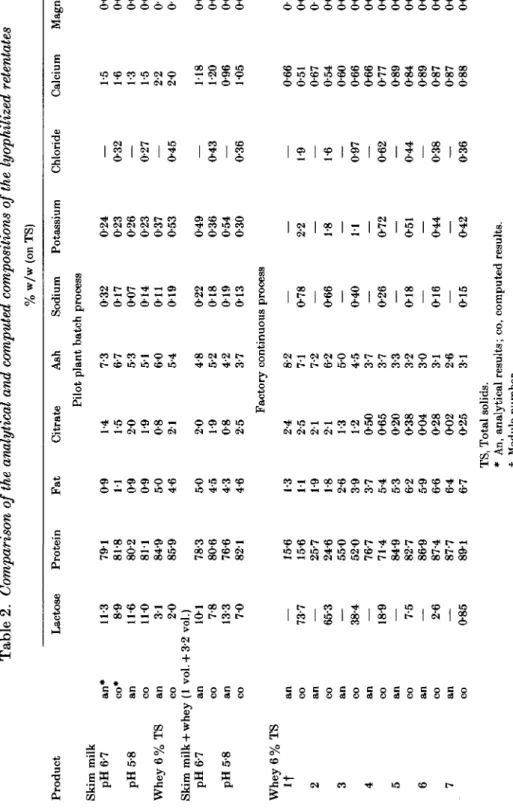
Produc t Tabl e 2 . Comparison of the analytical and computed compositions of the lyophilized retentates % w/ w (o n TS ) Chlorid e Calciu m Magnesiu m Phosphat e Lactos e Protei n Ski m mil k pH6-7 pH5-8 Whe y 6 % T S a n co an C O a n C O Ski m mil k + whe y ( 1 vol . + 3-2 vol. ) p H 6-7 a n co p H 5-8 a n co Whe y 6 % T S It 2 3 4 5 6 7 a n C O an C O an C O a n C O an C O an C O an C O Fa t Citrat e As h Sodiu m Potassiu m Pilo t plan t batc h proces s 0-2 4 — 0-2 3 0-3 2 0-2 6 — 0-2 3 0-2 7 0-3 7 — 0-5 3 0-4 5 0-4 9 — 0-3 6 0-4 3 0-5 4 — 0-3 0 0-3 6 2-2 1-9 1-8 1-6 1 1 0-9 7 0-7 2 0-6 2 0-5 1 0-4 4 0-4 4 0-3 8 0-4 2 0-3 6 TS , Tota l solids . * An , analytica l results ; co , compute d results . f Modul e number . 11 3 8-9 11-6 11 0 3 1 2 0 ^1 \ ol. ) 10 1 7-8 13-3 7 0 73-7 — 65-3 — 38-4 — 18-9 — 7-5 — 2-6 — 0-85 79 1 81-8 80-2 81 1 84-9 85-9 78-3 80-6 76-6 82 1 15-6 15-6 25-7 24-6 55 0 52 0 76-7 71-4 84-9 82-7 86-9 87-4 87-7 89 1 0-9 1 1 0-9 0-9 5 0 4-6 5 0 4-5 4-3 4-6 1-3 1 1 1-9 1-8 2-6 3-9 3-7 5-4 5-3 6-2 5-9 6-6 6-4 6-7 1-4 1-5 2 0 1-9 0-8 2 1 2 0 1-9 0-8 2-5 2-4 2-5 2 1 2 1 1-3 1-2 0-5 0 0-6 5 0-2 0 0-3 8 00 4 0-2 8 00 2 0-2 5 7-3 6-7 5-3 5 1 6 0 5-4 4-8 5-2 4-2 3-7 Factor y continuou s 8-2 7 1 7-2 6-2 5 0 4-5 3-7 3-7 3-3 3-2 3 0 3 1 2-6 3 1 0-3 2 01 7 0-0 7 01 4 01 1 01 9 0-2 2 01 8 01 9 01 3 pro i 0-7 8 — 0-66 — 0-40 — 0-26 — 0-18 — 016 — 0-15 1-5 1-6 1-3 1-5 2-2 2-0 11 8 1-2 0 0-9 6 1-0 5 0-6 6 0-5 1 0-6 7 0-5 4 0-6 0 0-6 6 0-6 6 0-7 7 0-8 9 0-8 4 0-8 9 0-8 7 0-8 7 0-8 8 00 8 00 8 00 6 00 9 01 0 01 7 00 8 00 8 00 8 00 8 01 2 00 9 01 1 00 9 00 9 00 7 00 7 00 7 00 7 00 7 00 7 00 7 00 7 00 7 4-3 2-9 2-5 2 1 31 2 1-9 5 1-8 3 2 0 1-6 •8 •5 •5 •3 •1 •2 •1 •2 10 1-2 1 0 1-2
a
I.
to278
(a)
0 . DE RHAM AND S. CHANTON Ultrafiltration Diafiltration 4 7 Vol. concn.factor 10 1 Diafiltration efficiency 60 Ultrafiltration Diafiltration 40
3
20u
b - - - " " l II II . J 1 10 1Vol. concn. factor Diafiltration
efficiency
Fig. 2. Composition of the retentate during ultrafiltration and diafiltration of rennet whey (pH 6-7, 50 °C, pilot plant batch process). For symbols see legend to Fig. 1. (a) Cumulative gross composition (6) Individual contents of polyvalent ions.
Model for UF retentate composition
279
Ultrafiltration Diafiltration
2 3 4
Vol. concn. factor Diafiltration
efficiency (6) 40 Ultrafiltration Diafiltration 30 2
i
8
20 ; ; • i j i , \ • • ' • • •Vol. concn. factor Diafiltration
efficiency
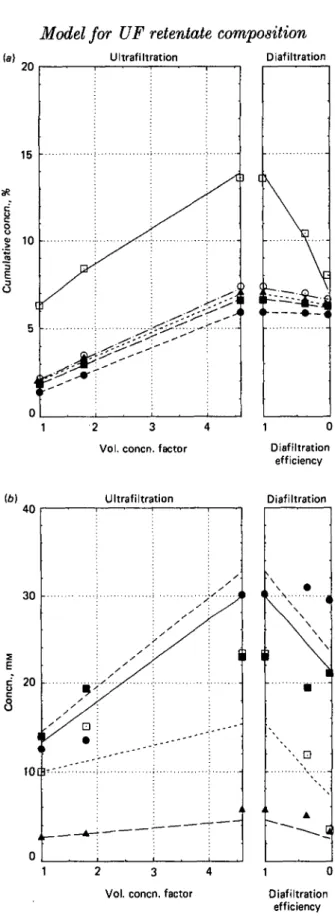
Fig. 3. Composition of the retentate during ultrafiltration and diafiltration of a mixture of 1 vol. skim milk with 3-2 vol. sweet whey (pH 6-7, 15 °C, pilot plant batch process). For symbols see legend to Fig. 1. (o) Cumulative gross composition, (b) Individual contents of polyvalent ions.
280 0 . DB RHAM AND S. CHANTON
9 13 17 21 25 Feed flow/retentate flow
(b) 30 20 10 b 1 2
f
rT
3'"
/''
3 i 4 ;y
'•• c . l_»—.— 1 » \ 1 5I
V
\\\\\
•
6J
/
//
•
}
///
•
. -A , ,Di , n, i ,c 13 17 21 25Feed flow/retentate flow
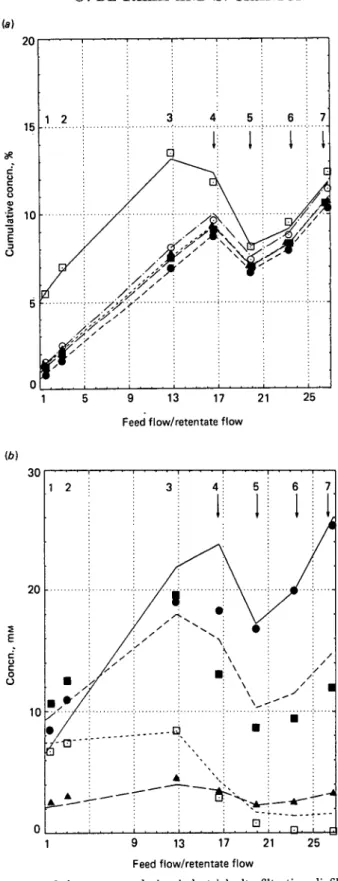
Fig. 4. Composition of the retentate during industrial ultrafiltration-diafiltration of sweet whey (pH 6-7,18 CC, sampling at every module outlet). For symbols see legend to Fig. 1; numbers, module No; arrow, addition of water, (a) Cumulative gross composition, (b) Individual contents of polyvalent ions.
Model for UF retentate composition 281
Table 3. Retention and segregation coefficients for whey under various physico-chemical conditions in a pilot plant batch process at 50 °C (unless otherwise stated)
Lactose Segregation coefficients
Product Sweet whey 6%TS 13% TS + Citric acid 13 mM (pH 4-5) + Citrate 5 mM (pH 6-7) Heated* (pH 7-2) Demineralized Acid whey (HC1) Ionic modelf coefficient Calcium 0-25 038 01 0-45 0-25 0-08 0-2 0-24 0-2 0-71 0-2 0-20 0-2 006 — 0-23 TS, Total solids. * Pretreated at 100 t at 15 °C. Magnesium 018 011 006 0 1 5 0-30 0-25 006 0-20 °C for 5 min. Phosphate 016 0-25 012 0 1 5 0-43 0-24 0-07 0 1 3 Citrate 0 1 0 0 5 002 0 1 3 0-28 002 004 0-26 Nitrogen 0-86 0-85 0-90 0-84 0-94 0-87 0-78 — Industrial process
Fig. 4 (a) and (b) plot the results obtained with cheese whey in the industrial line (points) and the computed values (lines) obtained with the suitable set of equations. The abscissa of Fig. 4 (a) and (6) is the ratio of the feed flow rate to the retentate flow rate, which gives straight lines for the concentration of segregated species providing that no water is used. It failed to give a simple figure in the last modules, where dilution was represented in Fig. 4 (a) and (b) by a change in the slope of the computed concentration lines. The coefficients observed in the factory are different from those in the pilot plant (Table 1), lower for lactose and minerals, and higher for total nitrogen. In Table 2, the complete analysis of the dried retentates (sampled at the outlet of every module) is compared with the computed values.
Modified wheys
In the pilot plant, we also made a series of trials under various conditions of pH (4-5 and 6-7), pretreatment (evaporation to 13 % TS, preheating at pH 7-2 for 5 min at 100 °C) or raw material (sweet cheese whey, HC1 whey, and the ionic model described in the Materials and Methods section). The detailed results are not given here, but are available from the authors. The segregation and retention coefficients observed are given in Table 3.
In these trials, the observed lactose retention coefficient was around 0*2, but occasionally was as high as 0 4 (Table 1). The segregation coefficient of total nitrogen
was fairly constant around 0-85, with a maximum for the heated sweet whey of 0-94
and a minimum for acid whey of 0-78. The calcium segregation coefficient changed between 0-06 and 008 at pH 4-5, and 0-2-0-4 at neutral pH for raw whey, with an increase to 0-71 after heat treatment. The magnesium and phosphate segregation coefficients followed the same trends, but over a smaller range. Disregarding the citrate-enriched products, the citrate segregation coefficient observed in whey was (M)2-(M, and had higher values of 026 in the ionic model and in the heated whey, and 025-0-5 in milk.
DISCUSSION
Based on experimental data, we established an empirical mathematical model to describe retentate (and permeate) composition in both pilot and industrial UF and DF of skim milk, whey and mixtures of these.