doi:10.1093/ejo/cjs108
Advance Access publication 1 February 2013 All rights reserved. For permissions, please email: [email protected] rights reserved. For permissions, please email: [email protected]
Split-mouth designs in orthodontics: an overview with
applications to orthodontic clinical trials
Nikolaos Pandis
*
, Tanya Walsh
**
, Argy Polychronopoulou
***
, Christos Katsaros
*
, and
Theodore Eliades
****
*Department of Orthodontics and Dentofacial Orthopedics, Dental School, Medical Faculty, University of Bern, Switzerland, **School of Dentistry, University of Manchester, UK, ***Department of Community and Preventive Dentistry, School of Dentistry, University of Athens, Greece and ****Department of Orthodontics and Paediatric Dentistry, Center of Dental Medicine, University of Zurich, Switzerland.
Correspondence to: Theodore Eliades, Department of Orthodontics and Paediatric Dentistry, Center of Dental Medicine, University of Zurich, Plattenstrasse 11, Zurich, CH-8032, Switzerland. E-mail: [email protected]
SUMMARY Split-mouth designs first appeared in dental clinical trials in the late sixties. The main advantage of this study design is its efficiency in terms of sample size as the patients act as their own controls. Cited disadvantages relate to carry-across effects, contamination or spilling of the effects of one intervention to another, period effects if the interventions are delivered at different time periods, difficulty in finding similar comparison sites within patients and the requirement for more complex data analysis. Although some additional thought is required when utilizing a split-mouth design, the efficiency of this design is attractive, particularly in orthodontic clinical studies where carry-across, period effects and dissimilarity between intervention sites does not pose a problem. Selection of the appropriate research design, inter-vention protocol and statistical method accounting for both the reduced variability and potential cluster-ing effects within patients should be considered for the trial results to be valid.
Introduction
Evidence obtained from dental research may be catego-rized according to a hierarchy, with evidence from well-conducted systematic reviews and randomized controlled trials (RCTs) providing the highest level of evidence, followed by controlled trials and observational studies (Table 1) (Harbour and Miller, 2001). Observational stud-ies such as cross-sectional, case–control and cohort studstud-ies, have certain inherent limitations that must be considered when their results are interpreted and conclusions drawn (von Elm et al., 2008). Carefully designed and conducted RCTs, where feasible, can provide the highest level of evi-dence in terms of effectiveness of an intervention (Moher
et al., 2010).
There are several study design features for RCTs, such as adequate sample size, randomization and use of control, blinding and appropriate data analysis (Moher
et al., 2010). These components affect a trial in terms of ethics, efficiency, outcome precision and validity (Altman, 1980; Altman and Bland, 1995; Jadad et al., 1996; Pocock, 1983; Juni et al., 2001; Charles et al., 2009). Whilst the most common form of RCT is the conventional parallel-group two- or k-arm design, split-mouth designs, cluster-randomized designs, factorial designs, non-inferiority or hybrids of those can also be employed. In parallel-group designs, participants are randomly allocated to intervention group; in split-mouth
designs, each intervention is randomly allocated to a different site or sites within the mouth of each individual (Ramfjord et al., 1968); in cluster-randomized designs, the experimental unit is the cluster. Each cluster is then randomized to an intervention, e.g. the cluster may be the jaw in which all member teeth receive the same treatment and measurements are made on the teeth within the jaw; in the simplest form of a factorial design, two interventions are assessed simultaneously on the same participants.
Split-mouth designs were introduced in periodontics by Ramjford in the late sixties, but their use has been rela-tively limited (Antczak-Bouckoms et al., 1990; Lesaffre
et al., 2007; Lesaffre et al., 2009) as a result of perceived limitations such as carry-across effects, period effects and difficulty in recruiting patients with similarity between ran-domization units (jaws, quadrants). Carry-over effect has been described extensively in crossover designs in medicine (Senn, 2007) and also in dentistry as carry-across effects or contamination (Lesaffre et al., 2007; Lesaffre et al., 2009). A carry-across effect may be anticipated in a trial of fluoride rinses in a split-mouth design, for example, as it would be difficult to apply the rinse in only specific quadrants and also to assure that fluoride from one site does not carry across to other quadrant(s). Period effects are encountered when interventions are not delivered simultaneously and the effect of the intervention is influenced by the period of delivery. For example, conditions under investigation may
improve with time and this improvement may be attributed to the intervention delivered at that time. Using a split-mouth design, Palm et al. (2004) compared perception of pain using two methods of anaesthesia delivery. The anaes-thesia procedures were performed sequentially in time, thus increasing the possibility of period effects as the perception of pain may be affected by the sequence of the interven-tions. A further problem of split-mouth designs is encoun-tered when it is difficult to find appropriate and similar pairs of sites within patients. For example, if we were to conduct a split-mouth design evaluating two root canal methods, we may require similarity between quadrant (or at least no important dissimilarity), because different teeth may have vastly different root morphologies. This could be an obsta-cle for achieving a reasonable sample size when employing a split-mouth design, even though fewer participants will be required due to matching (same individual, same type of tooth and on the same jaw) compared with a parallel-group design.
These limitations have been reported by Hujoel and others (Hujoel and Moulton, 1988; Hujoel and Loesche, 1990; Hujoel and DeRouen, 1992) with reference to dental research. However, in orthodontics, split-mouth designs for certain interventions are likely to be more appropriate. For example, we could very well perform a split-mouth design to assess bond failures of two adhesives by bonding in two randomly selected quadrants with one adhesive and bond-ing with the second adhesive in the other two quadrants as no carry-across effects are expected. Simultaneous admin-istration of the interventions removes the period effect and quadrants receiving the different adhesives are likely to be similar in important aspects in relation to the outcome of interest.
It is the purpose of this article to provide an overview of the design, sample size and analysis requirements of split-mouth designs as they apply to orthodontics. First, we will summarize the advantages and disadvantages of orthodontic split-mouth designs and then go on to consider randomization and statistical analysis issues. Three ortho-dontic case studies will be used to illustrate these concepts in practice.
Advantages and disadvantages of split-mouth designs in orthodontics
A key advantage of this study design is the smaller sample size required compared with a parallel-group design. This is due to the fact that each patient acts as his/her own control, so much of the inter-subject variability is removed, resulting in increased study power or a decrease in the number of par-ticipants required compared with a study in which patients receive only one intervention. It is estimated that the sample size requirements for a split-mouth RCT is approximately half that of a parallel RCT (Hujoel and DeRouen, 1992), when all other parameters are equal. Sample size depends also on the similarity of the sites within patients and it is estimated that the sample size may be further reduced com-pared with a parallel trial as the within-participant corre-lation increases. As the coefficient of correcorre-lation (ρ) gets
closer to one, the required sample size (N) may be dramati-cally reduced, as indicated by the following formula (Wang and Bakhai, 2006): Nsplit mouth N parallel − = −
(
1)
2 r (1) When a split-mouth design is applied, there should be uni-formity in the sites of each patient to whom the interventions are applied. This can be a problem in dental specialties such as endodontics, periodontics or restorative dentistry, where there may be clinically important between-site differences that are potentially related to the outcome of interest, but this is not often a problem for orthodontics. In orthodontics, intact dentitions are most often available and, thus, it is fea-sible to have comparable sites to which both interventions are applied. Lack of uniformity between sites within partici-pants may introduce selection bias as interventions may be applied to sites with different baseline characteristics.Unequal or informative loss to follow-up or introducing post-randomization bias is unlikely to occur in orthodon-tic split-mouth trials. If a parorthodon-ticipant withdraws from the trial, the information from both or all interventions is lost. If, however, the loss to follow-up or withdrawal is more than minor, such losses can affect the resulting power of the study.
The potential for carry-across effect should be considered fully, and if this effect is expected, the trial should not be planned as a split-mouth design.
Table 1 Revised grading system for recommendations in evidence-based guidelines.
Levels of evidence
1++ High-quality meta-analyses, systematic reviews of RCTs or RCTs with a very low risk of bias
1+ Well-conducted meta-analyses, systematic reviews of RCTs or RCTs with a low risk of bias
1– Meta-analyses, systematic reviews/RCTs or RCTs with a high risk of bias
2++ High-quality systematic reviews of case–control or cohort studies or high-quality case–control or cohort studies with a very low risk of confounding, bias or chance and a high probability that the relationship is causal
2+ Well-conducted case–control or cohort studies with a low risk of confounding, bias or chance and a moderate probability that the relationship is causal
2– Case–control or cohort studies with a high risk of confounding, bias or chance and a significant risk that the relationship is not causal 3 Non-analytic studies, e.g. case reports, case series 4 Expert opinion
RCT, randomized controlled trial.
785 As most interventions are applied usually simultaneously,
period effects that could confound the association between interventions and outcome are not usually encountered (unlike in crossover trials). Subjective period effects may occur, for instance, if patient-reported pain associated with appliance A is measured first and then pain associated with appliance B is measured subsequently. The subjective per-ception of pain associated with the appliance may change with previous experience over time over and above that associated with the intervention.
Split-mouth designs can be complicated to conduct and analyse, particularly when sites are nested within patients and teeth are nested within sites, producing clustering effects. In such instances, the clustering effects reduce study power as the information contributed per cluster is reduced (Hayes and Moulton, 2009). It should be pointed out that clustering effects are encountered in all trial designs where multiple observations are recorded within the same partic-ipants and that they are not an exclusive characteristic of split-mouth designs. It is recommended to seek expert opin-ion of a statistician when such studies are planned.
Randomization
In dental research, Hujoel and Loesche have identified 11 different variants for split-mouth treatment allocation. Methods of randomization in split-mouth designs include simple, restricted, stratified randomization or minimization. In orthodontic split-mouth trials, common units of randomi-zation are the jaw, the left or right side of the mouth or the quadrant. For example, if the jaw is the unit of randomiza-tion, each intervention will be assigned randomly to either the maxilla or the mandible using one of the methods men-tioned earlier. Similarly, if the unit of randomization is the quadrant, within the same patient, two quadrants could be randomly allocated to one intervention and the remaining two quadrants randomly allocated to the other intervention.
Statistical analysis
Statistical analysis should be carried out with reference to the research question and the primary and secondary outcome(s). For split-mouth designs, statistical analyses that take into account the paired nature of the data must be used, and the appropriate statistical test will depend on the nature of the outcome, e.g. categorical or quantitative. In more complicated designs, multiple outcome measurements may arise, i.e. the success or failure of bonds on several teeth within a jaw or quadrant. This multiplicity of data (or clustering of outcome measurements of teeth within a jaw or quadrant allocated to an intervention) requires sta-tistical methods that account for the correlated nature of data. Treating clustered observations as independent often results in small standard errors and consequently small P values, leading to incorrect inferences for the effect of an
intervention. To account for clustering effects, the statisti-cal analysis could use either simple methods (in which a summary outcome measurement per cluster is calculated, e.g. mean proportion of bond failures per quadrant or mean plaque score per quadrant) or more complex regres-sion models for correlated data such as generalized esti-mating equations (GEE) or random effects (Donner and Eliasziw, 1991; Donner et al., 1991; Donner and Zou, 2007; Giraudeau et al., 2008).
Examples
Simple split-mouth design
Example 1. En-masse retraction after maxillary premolar extraction using sliding mechanics on passive self-ligat-ing or conventional orthodontic appliances (no clusterself-ligat-ing effects). Miles (2007) evaluated the rate of en-masse retrac-tion with sliding mechanics between passive self-ligating Smart-Clip brackets and conventional twin brackets ligated with stainless steel ligatures. Each patient was randomly allocated to be bonded with a passive self-ligating or a con-ventional appliance per maxillary quadrant in a split-mouth design. In such a study, the outcome measure could be the number of days to close the extraction spaces or millime-tres of space closure after a predefined amount of time. Statistical analysis of the effect of intervention uses a paired
t-test or the non-parametric equivalent. In this approach,
the difference in days to align or the difference in millime-tres of space closure between quadrants will be calculated and the hypothesis that this difference is zero will be tested. The fact that the measurements for both interventions are taken from the same patients results in reduced variance and hence higher study power compared with a study in which each patient was receiving only one of the interven-tions. If adjustment for covariates or assessment of effect modification is required, a regression model can be used. [In the parallel-group design, each participant is randomly allocated to receive on both maxillary quadrants space clo-sure either only with passive self-ligating or conventional appliances. The parallel design makes comparisons between patients using either an independent t-test or a non-para-metric equivalent. Adjustment for covariates can be done as before.]
Table 2 shows a parallel versus split-mouth design approach.
Split-mouth design with multiple measurements per segment
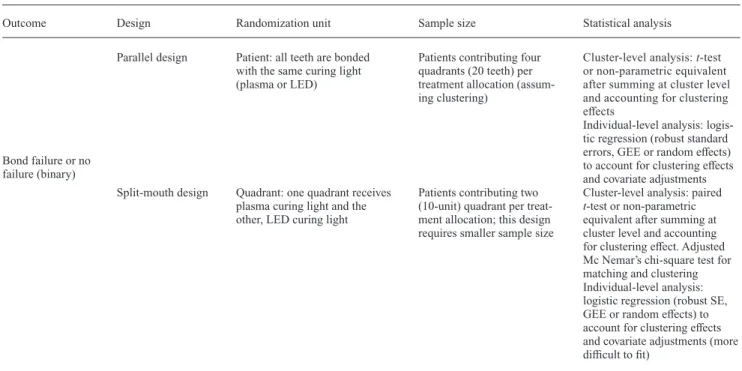
Example 2. Comparative assessment of bond failures using either plasma or light-emitting diode curing lights. Pandis
et al. (2007) compared bond failures using a plasma cur-ing light versus a light-emittcur-ing diode (LED) curcur-ing light in a split-mouth design. In such an experiment, the unit of
randomization may be at the quadrant level. One quadrant is randomly allocated to plasma curing light, the other to LED curing light. Each quadrant is considered a cluster consisting of many teeth. The outcome for each tooth in the cluster is a binary outcome (failure or no failure of adhe-sive), and a simple proportion of failures is calculated per quadrant (P = failures/number of teeth per quadrant). These proportions are treated as continuous outcomes as the analysis is applied at the cluster level (Hayes and Moulton, 2009). Statistical analysis of the effect of intervention uses a paired t-test or a non-parametric equivalent at the quad-rant level (cluster-level analysis). If adjustment for covari-ates or effect modification is to be assessed or analysis at the tooth level (individual level analysis) is selected, logis-tic regression modelling that accounts for matching and clustering (robust standard errors, GEE or random effects) may be adopted. It should be noted, however, that models for binary data and event rates are more difficult to fit for matched designs and require sufficient number of clusters. Donner has also proposed methods using adjusted chi-square tests to account for matching and clustering effects (Hayes and Moulton, 2009).
[In the parallel design, participants are randomly allo-cated to the same intervention, either plasma or LED cur-ing light, on all teeth. Statistical analysis of the effect of intervention with a parallel-group design uses a t-test or a non-parametric equivalent in which each patient contrib-utes one value, the calculated proportion per patient/clus-ter P (=failures/n of teeth). If adjustment for covariates or effect modification is required or analysis at the tooth level is selected, logistic regression modelling that accounts for clustering (robust standard errors, GEE or random effects) must be employed.] Table 3 shows a parallel versus the split-mouth design for this example.
Split-mouth design with adjustment for baseline value of continuous outcome
An analysis of the effect of an intervention can be more efficient if it takes into account baseline measurements (generally the value before the intervention is given) that are related to the outcome of interest. If there is a cor-relation between the baseline measurement and the final measurement of a continuous outcome, then an adjusted analysis of the effect of the intervention, which takes the baseline value into account, can increase the precision of the effect estimate. The greater the correlation between the baseline and final measurements, the smaller is the required sample size and vice versa (Figure 1) (Rosner, 2006). Rosner (2006) provides a formula (see Table 4 for sample size calculations for the effect of an intervention with baseline and outcome measurements for parallel-group and paired-design approaches—equivalent to split-mouth design).
Example 3. Local Streptococcus. mutans counts around brackets after bonding with two different orthodontic appliances (adjusting for baseline S. mutans counts).
Participants are randomized to a conventional and a self-ligating appliance in a split-mouth design. Measurements of S. mutans counts are taken before the appliance is fitted and at follow-up, for example, 6 weeks later. Measurements may be taken from only one location per intervention site or from multiple locations per intervention site. If multiple measurements are taken, an average per intervention side should be used in order to account for clustering effects. It is likely that there is a strong correlation between S. mutans counts before and after bonding of the appliances. As this correlation increases, the power of the study increases or a
Table 2 Comparison between parallel and split-mouth design for maxillary space closure with passive self-ligating versus conventional appliances (Example 1).
Outcome Design Randomization unit Sample size Statistical analysis
Number of days to close extraction space or millimetres of space closure for predefined time period (continuous)
Parallel design Patient: both maxillary quadrants receive same appliance (passive self-ligating or conventional)
Patients contributing two quadrants per treatment allocation
Independent t-test or non-parametric equivalent (average of number of days required to close extraction spaces may be used within participants to account for clustering effect). Similarly for millimetres of space closure. Linear or median regression for covari-ate adjustments
Split-mouth design Quadrant: one maxillary quadrant receives passive self-ligating and the other quadrant, conventional appliance
Patients contributing one quadrant per treatment allocation (this design requires smaller sample size)
Paired t-test or non-parametric equivalent using as outcome the difference between quad-rants. Linear or median regres-sion for covariate adjustments indicating that interventions are nested in patients
787
smaller sample size is required to maintain the same power. Table 6 displays the required sample size for different correlation coefficient (ρ) values (0.5, 0.7 and 0.9), for
parallel and split-mouth designs, to detect a difference of two points on the log scale (S. mutans counts are usually represented on the log scale for normality of the distribution purposes) with standard deviation for each intervention arm of two (standard deviation of change between baseline and follow-up) at the 5% significance level with 90% power. The variance decreases as the correlation coefficient increases and this decrease in the numerator results in
smaller sample size (Table 6, Figure 1). In other words, in a split-mouth design, because participants are serving as their own controls as both interventions are applied within the same patient, there is less variability between the observations and as the variability decreases, so does the required sample size.
A related consideration in analyses where baseline meas-urements are used is that the choice of analysis can affect the power and sample size requirements of the study (Pocock, 1983). In the S. mutans example (Figure 2), using the fol-low-up measurement alone in the analysis, the required sample size is unaffected (does not decrease) by a change in the correlation between baseline and follow-up values. Using a change from baseline as the outcome measurement (follow-up minus baseline) without adjusting (accounting)
Table 3 Comparison between parallel and split-mouth designs for comparative assessment of bond failures between brackets bonded with plasma versus light-emitting diode curing lights (Example 2).
Outcome Design Randomization unit Sample size Statistical analysis
Bond failure or no failure (binary)
Parallel design Patient: all teeth are bonded with the same curing light (plasma or LED)
Patients contributing four quadrants (20 teeth) per treatment allocation (assum-ing cluster(assum-ing)
Cluster-level analysis: t-test or non-parametric equivalent after summing at cluster level and accounting for clustering effects
Individual-level analysis: logis-tic regression (robust standard errors, GEE or random effects) to account for clustering effects and covariate adjustments Split-mouth design Quadrant: one quadrant receives
plasma curing light and the other, LED curing light
Patients contributing two (10-unit) quadrant per treat-ment allocation; this design requires smaller sample size
Cluster-level analysis: paired
t-test or non-parametric
equivalent after summing at cluster level and accounting for clustering effect. Adjusted Mc Nemar’s chi-square test for matching and clustering Individual-level analysis: logistic regression (robust SE, GEE or random effects) to account for clustering effects and covariate adjustments (more difficult to fit)
GEE, generalized estimating equation; SE, standard errors.
Table 4 Sample size formulas accounting for correlation between baseline and follow-up outcome values (Example 3).
σd σ σ ρσ σ 2 1 2 2 2 = + −2 1 2 sd 2
= variance of change between baseline and follow-up. It is assumed that baseline and follow-up variances are the same
s1 2
= variance in baseline values within a treatment group
s2 2
= variance in follow-up values within a treatment group
ρ = correlation coefficient between baseline and follow-up values within a
treatment group (assumed the same for both trial arms)
δ = mean difference
f(α, β) is a function of alpha and beta derived from the standard normal
distribution for different combinations of power and level of significance (see Table 5).
Table 5 Values for different combinations of power and level of significance.
β
0.05 (95%
power) 0.1 (90% power) 0.2 (80% power) 0.5 (50% power)
α 0.05 13.0 10.5 7.85 3.84
0.01 17.8 14.9 11.7 6.63
for the baseline values requires a large sample size, which progressively decreases as the correlation between base-line and follow-up increases. Finally, using the follow-up value (or the change from baseline) as the outcome meas-urement and additionally adjusting for the baseline values of S. mutans counts usually results in the smallest required sample size and the most precision (power) of all three scenarios. The final analysis is the analysis of covariance (ANCOVA; Vickers and Altman, 2001).
Conclusions
• Split-mouth designs are appropriate for certain orthodon-tic interventions due to their efficiency and the decreased sample required compared with conventional parallel designs.
• Split-mouth designs may not be a suitable study design when period, carry-across effects/contamination or lack of uniformity in allocation segments is anticipated. • Due consideration for the split-mouth study design should
be taken when sample size calculations and statistical analyses are carried out.
References
Altman D G 1980 Statistics and ethics in medical research: III How large a sample? British Medical Journal 281: 1336–1338
Altman D G, Bland J M 1995 Absence of evidence is not evidence of absence. British Medical Journal 311: 485
Antczak-Bouckoms A A, Tulloch J F, Berkey C S 1990 Split-mouth and cross-over designs in dental research. Journal of Clinical Periodontology 17: 446–453
Charles P, Giraudeau B, Dechartres A, Baron G, Ravaud P 2009 Reporting of sample size calculation in randomised controlled trials: review. British Medical Journal 12: 338
Donner A, Eliasziw M 1991 Application of matched pair procedures to site-specific data in periodontal research. Journal of Clinical Periodontology 18: 755–759
Donner A, Zou G Y 2007 Methods for the statistical analysis of binary data in split-mouth designs with baseline measurements. Statistics in Medicine 26: 3476–3486
Giraudeau B, Ravaud P, Donner A 2008 Sample size calculation for cluster randomized cross-over trials. Statistics in Medicine 27: 5578–5585 Harbour R, Miller J 2001 A new system for grading recommendations in
evidence based guidelines. British Medical Journal 323: 334–336 Hayes R J Moulton L H 2009 Cluster Randomized Trials. Interdisciplinary
Statistic Series, chapters 9–11. Chapman & Hall/CRC, Florida Hujoel P P, DeRouen T A 1992 Validity issues in split-mouth trials. Journal
of Clinical Periodontology 19: 623–627
Hujoel P P, Loesche W J 1990 Efficiency of split-mouth designs. Journal of Clinical Periodontology 17: 722–728
Hujoel P P, Moulton L H 1988 Evaluation of test statistics in split-mouth clinical trials. Journal of Periodontal Research 23: 378–380
Jadad A R et al. 1996 Assessing the quality of reports of randomized clini-cal trials: is blinding necessary? Controlled Cliniclini-cal Trials 17: 1–12 Juni P, Altman D G, Egger M 2001 Systematic reviews in health care:
assessing the quality of controlled clinical trials. British Medical Journal 323: 42–46
Lesaffre E, Garcia Zattera M J, Redmond C, Huber H, Needleman I 2007 Reported methodological quality of split-mouth studies. Journal of Clinical Periodontology 34: 756–761
Table 6 Effect of the correlation coefficient (ρ) on variance and required sample size.
ρ = 0.5 (sd 2 ) ρ = 0.7 (sd 2 ) ρ = 0.9 (sd 2 ) Parallel design Total number of patients required 84 (4) 52 (2.4) 20 (0.8) Split-mouth design Total number of patients required 42 (4) 26 (2.4) 10 (0.8)
Figure 1 Decrease in the required sample size as the correlation between
baseline and follow-up outcome values increases (Example 3). The y-axis shows the required sample size and the x-axis shows the values of the cor-relation coefficient (ρ).
Figure 2 The graph shows how the required sample size varies
depend-ing on the type of analysis and the correlation between baseline and fol-low-up measurements in a before/after measurement. The y-axis shows the required sample size and the x-axis shows the values of the correlation coef-ficient (ρ). Follow-up indicates that only the follow-up outcome value was
used without adjustment for baseline value of the outcome. Change from
baseline indicates that the difference between the final and the baseline
outcome value was used without adjustment for baseline outcome value.
ANCOVA indicates that either follow-up outcome or change from baseline
789 Lesaffre E, Philstrom B, Needleman I, Worthington H 2009 The design and
analysis of split-mouth studies: what statisticians and clinicians should know. Statistics in Medicine 28: 3470–3482
Miles P G 2007 Self-ligating vs conventional twin brackets during en-masse space closure with sliding mechanics. American Journal of Orthodontics and Dentofacial Orthopedics 132: 223–225
Moher D et al. 2010 CONSORT 2010 explanation and elaboration: updated guidelines for reporting parallel group randomised trials. British Medical Journal 340: c869
Palm A M, Kirkegaard U, Poulsen S 2004 The wand versus traditional injection for mandibular nerve block in children and adolescents: per-ceived pain and time of onset. Pediatric Dentistry 26: 481–484 Pandis N, Strigou S, Eliades T 2007 Long-term failure rate of brackets
bonded with plasma and high-intensity light-emitting diode curing lights:a clinical assessment. The Angle Orthodontist 77: 707–710 Pocock S J 1983 Clinical trials: a Practical Approach, chapters 9–10.
Wiley, Chichester
Ramfjord S P, Nissle R R, Shick R A, Cooper H Jr 1968 Subgingival curet-tage versus surgical elimination of periodontal pockets. Journal of peri-odontology 39: 167–175
Rosner B 2006 Fundamentals of Biostatistics. 6th edn. Belmont, Duxbury,pp. 327–334.
Senn S 2007 Statistical Issues in Drug Development, chapter 17. 2nd edn. Wiley, Chichester
Vickers A J, Altman D G 2001 Analyzing controlled trials with base-line and follow-up measurements. British Medical Journal 323: 1123–1224
von Elm E, Altman D G, Egger M, Pocock S J, Gøtzsche P C, Vandenbroucke J P; STROBE Initiative. 2008 The Strengthening the Reporting of Observational Studies in Epidemiology (STROBE) state-ment: guidelines for reporting observational studies. Journal of Clinical Epidemiology 61: 344–349
Wang D, Bakhai A 2006 Clinical Trials in Practice. A Practical Guide to Design, Analysis and Reporting, chapter 10. Remedica, London