Preparation and properties of potassium-vermiculite films
Caroline Minker-Villemin, Paul Bowen, Jacques Lemaˆıtre, and Terry A. Ringa) Powder Technology Laboratory (LTP), Materials Department, Swiss Federal Institute of Technology (EPFL), 1015 Lausanne, Switzerland
(Received 11 June 1996; accepted 25 April 1997)
Flexible films of vermiculite have been prepared from aqueous suspensions after swelling by cation exchange and mechanical delamination. Two different swelling cations, lithium and butylammonium, have been investigated. The degree of swelling and delamination during the suspension preparation was characterized by the percentage of water reabsorbed by dried clays and the adsorption of methylene blue. The vermiculite saturated with lithium ions is more easily delaminated but contains more water than those saturated with butylammonium. Good quality coherent flexible films could be prepared from both the lithium and butylammonium exchanged vermiculites but the high percent-age of water found in the films has a detrimental effect on their dielectric properties. To reduce the amount of water in the exchanged vermiculites a second ion exchange with potassium, a less hydratable cation, was investigated. Films prepared after exchange with potassium showed significant improvements in their dielectric properties, with a dielectric constant e around 10 and a dissipation factor tan d around 0.06 at 25±C and a frequency of 1 kHz.
I. INTRODUCTION
Vermiculite is a layered sheet silicate of the phyl-losilicate family and originates from the alteration of mica. The potassium interlayer cation which maintains the charge neutrality of the sheets in mica is replaced by a hydrated cation, normally Mg in the case of vermiculite.1 The physical properties of micas and
ver-miculite which render these materials interesting are their low thermal conductivity, high thermal and chemical sta-bility, and particularly their low electrical conductivity. Sheet micas have been used in electrical equipment as an electrical insulator for many years2 and although in many applications they have been replaced by polymeric films, their high thermal stability still render them useful for certain applications. One of the limitations of sheet micas is their fragility and consequent low flexibility which limits their application for certain geometries. The fact that the interlayer cation in vermiculite is hydrated allows it to be swollen by a treatment in aqueous salt solutions,3,4 and when followed by delamination
flexible films can be produced.5 The production of
flexible mica films is rendered more difficult because they do not swell and delamination by grinding is difficult although some high surface area micas have become available more recently.6 The vermiculite films
a)Current address: Department of Chemical and Fuels Engineering, University of Utah, 3290 Merrill Engineering, Salt Lake City, Utah 84112.
produced by swelling and delamination also show good mechanical properties.5
The presence of water in vermiculite films due to the presence of the strongly hydrated cations used in the swelling step may reduce the dielectric constant significantly when compared to sheet mica. In this study the effect of a second cation exchange after swelling and delamination on the dielectric properties of vermiculite films has been investigated. There have been many studies on the cation exchange equilibria7–9 for various
cations and their effect on the degree of hydration of vermiculite. The ion which seems to contract vermiculite films most strongly is the potassium ion because of its low energy of hydration.10–14 Therefore the replacement
of the strongly hydratable swelling ions by potassium should reduce the amount of water retained in the vermiculite films. This final exchange of the swelling cation by potassium will make the vermiculite resemble mica, the origin of our altered mica-vermiculite. The vermiculite films have been produced using an exfoliated vermiculite and two different swelling cations, lithium and butyl ammonium. The starting vermiculite was char-acterized by chemical analysis and x-ray diffraction, and its ionic exchange capacity measured. The degree of swelling and delamination of the vermiculite have been characterized by the adsorption of methylene blue.15 The
amount of water retained in the films and their affinity to/for humidity were investigated by thermogravimetric analysis and the readsorption of water after drying. Films were produced by sedimentation and drying in air with different humidities. The films were characterized
by x-ray diffraction (XRD), thermogravimetric analysis (TGA), and scanning electron microscopy (SEM) and the dielectric constant sed and dielectric loss stan dd measured as a function of temperature and frequency.
The methodology used throughout— statistical ex-perimental design — is particularly important when deal-ing with natural raw materials such as vermiculite which can vary greatly in their composition and homogeneity, depending on their source. This methodology inherently gives an excellent indication of experimental error and the influence of an uncontrolled parameter that may affect results when working with such complex systems as the phyllosilicate minerals.
II. EXPERIMENTAL
The vermiculite used in this study was an ex-foliated vermiculite supplied by Vermica SA (B¨ozen, Switzerland).
A. Preparation of vermiculite suspension
To prepare vermiculite suspensions the vermiculite was first swollen by cation exchange and then delami-nated by ultrasonic treatment. The swelling was carried out by treating the vermiculite for 4 h at 80±C in solutions of n-butyl ammonium chloride (Bu) (2 M, pH 4.8) or lithium citrate (Li) (1 M, pH 8.5). These conditions were chosen after a preliminary series of statistically designed experiments where the solution concentrations, pH, contact time, and temperature were investigated.16The swollen vermiculites were then
thor-oughly washed with demineralized water and 40 ml (unless otherwise stated) of suspension (25 gyl) de-laminated using an ultrasonic horn at 100 W power for 30 min (unless otherwise stated). Longer ultrasonic treatment times were investigated16 but showed little
further delamination when estimated by the adsorption of methylene blue as described below.
To investigate the effect of a second cation exchange on the vermiculites a potassium exchange was then carried out. The swollen and delaminated vermiculites (2 gyl) were left in contact for 3 h with KNO3 solutions
(about 1022 M) buffered at pH 4.5 in order to give 0.005 moles of potassium per gram of vermiculite.
B. Preparation of films
The vermiculite films 10 3 10 cm were pre-pared from the various suspensions (30–35 gyl) by sedimentation-casting. Silicon rubber molds were placed on polyacetate sheets supported on a glass plate. The suspension (20 –30 cm3) was degassed and then poured
into the mold. The films were dried at 25±C in the presence of a desiccant (CaCl2) in dry box or at 80±C
in an oven. A certain level of humidity was maintained in the oven, by including a beaker of water, to avoid
the formation of skin on the surface of the film and thus avoiding bubbles and irregularities on the film surface. The films were weighed periodically to follow the drying process. The films obtained had thicknesses of between 30 and 60 mm. The densities of films were measured on 5 – 10 rectangular pieces cut from films with the volume of the sample calculated geometrically.
C. Characterization techniques
The chemical composition of the exfoliated ver-miculite as supplied and after various treatments was evaluated using inductively coupled plasma spectroscopy (ICP). The solutions for ICP analysis were prepared by the alkali salt fusion method.17 The vermiculite was ground with LiBO2 in a 1 : 7 weight ratio and fusion
carried out at 1000±C for 1 h. The resulting mixture was dissolved in 4% HNO3 at room temperature for the
analysis.
The cation exchange capacity (CEC) was evaluated by saturating the vermiculite (20 gyl) in a 6 M NaCl solution for 1 h at 100±C. The concentration of the interlayer Mg21 and Ca21 ions released was measured by complexometric titration and ICP analysis for the K not complexed by the ethylenediaminetetraacetic acid (EDTA) used in the titration (all chemicals were ana-lytical grade).
X-ray powder diffraction (XRD) was carried out on the vermiculite (in the form of films) before and after various treatments using a Siemens D500 diffractometer (Cu Ka irradiation). All the films were stored in a desiccator with silica gel.
The adsorption of methylene blue (MB) has been used to assess the degree of delamination of the vermi-culite after the various treatments and the effect of the second cation exchange with potassium. This was carried out by first drying the vermiculite at 50±C to allow a precise measurement of the weight of the vermiculite. This was then dispersed in 50 cm3 of de-ionized water
with the aid of an ultrasonic bath. The volume was then made up to 100 cm3 with an aqueous solution of MB
of known concentration (about 5 ? 1024 M or 0.1 gyl) and placed in a water bath at 27 ±C and shaken for 16 h. The amount of MB that remained in the fil-tered supernatant was then measured after dilution to assure the MB was in its monomer form,16,18 using a
spectrophotometer (Perkin-Elmer Lamba 6 UV/VIS, at 664 nm for monomer absorption) and by difference the amount of MB adsorbed by the vermiculite calculated.
In order to assess the sensitivity of the various vermiculite films to humidity gravimetric and thermo-gravimetric analysis (TGA) were carried out. The films were initially dried at 110 ±C for 16 h and then placed in an atmosphere at 100% humidity until constant weight was measured. The amount of water adsorbed is quoted
as a percentage of the dry weight. The TGA data were collected on the saturated films using a Setaram TGDTA 92 (Caluire, France) with flowing dry air and a ramp rate of 10±Cymin from 25 to 600±C.
Scanning electron microscopy (SEM, JEOL 6300F) was used to observe the fracture surface and a transversal section of the films. For the transversal section a film was impregnated with a resin and the cut made using a microtome.
Dielectric measurements were made on films cut into 8 mm disks and sputter coated with Au to form electrodes. The dielectric constant, e, and dielectric loss, tan d, of the samples were measured as a function of temperature (cooling from 150 to 20±C) and frequency (30 Hz, 100 Hz, 300 Hz, and 1 KHz) [using a Hewlett Packard precision LCR meter (HP4284A) in conjunction with a Delta Design (9023) environmental test chamber].
D. Experimental design
Two series of statistically designed experiments19
(factorial 24) were used to study first the effect of the
second ion exchange (i.e., K) on the sensitivity of the various vermiculites to humidity and second the effect of this second exchange on the dielectric properties of the films produced. This type of factorial experimental design allows us to study the influence of four parameters at two different levels by carrying out 16 separate experiments.
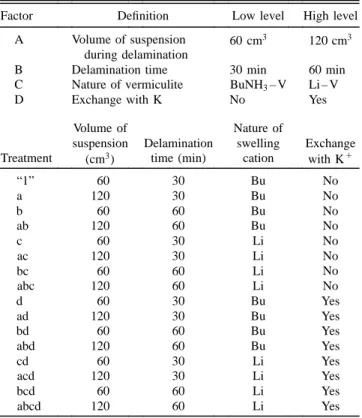
The four parameters investigated in the first series of experiments were (A) the volume of suspension used during the ultrasonic delamination treatment (60 or 120 cm3), (B) the duration of the delamination treatment
(30 or 60 min), (C) the type of salt used to swell the clays [n-butyl ammonium chloride (Bu) or lithium citrate (Li)], and (D) with or without the second ion exchange with potassium (no, yes). The specific experimental con-ditions and sample nomenclature are reported in Table I. The column treatment contains the coded treatments according to the Yates’ convention: when a factor X is applied at its higher level, the lowercase letter x appears in the treatment code.
The second experimental plan looked at the influ-ence of four parameters on the dielectric properties of the various vermiculite films produced. These were (A) the type of salt used to swell the clays [n-butyl ammonium chloride (Bu) or lithium citrate (Li)], (B) the duration of the ultrasonic treatment (5 or 30 min), and (C) with or without the second ion exchange with potassium (no, yes), and (D) the measurement temperature (50 or 100±C). The specific experimental conditions and sample nomenclature are reported in Table II.
The data were statistically analyzed using the ANOVA technique.19 The adjusted values presented
in the control charts were calculated according to the
TABLE I. Parameters and their levels studied to investigate the sensitivity of the various vermiculite films to humidity.
Factor Definition Low level High level
A Volume of suspension 60 cm3 120 cm3
during delamination
B Delamination time 30 min 60 min
C Nature of vermiculite BuNH3– V Li – V
D Exchange with K No Yes
Volume of Nature of
suspension Delamination swelling Exchange Treatment (cm3) time (min) cation with K1
“1” 60 30 Bu No a 120 30 Bu No b 60 60 Bu No ab 120 60 Bu No c 60 30 Li No ac 120 30 Li No bc 60 60 Li No abc 120 60 Li No d 60 30 Bu Yes ad 120 30 Bu Yes bd 60 60 Bu Yes abd 120 60 Bu Yes cd 60 30 Li Yes acd 120 30 Li Yes bcd 60 60 Li Yes abcd 120 60 Li Yes
TABLE II. Parameters and their levels studied to investigate their influence on the dielectric properties of the various vermiculite films produced.
Factor Definition Low level High level
A Nature of vermiculite BuNH3– V Li – V
B Duration of ultrasonic 5 min 30 min
treatment
C Exchange with K No Yes
D Measurement temperature 50±C 100±C Nature of Sonication Exchange Meas. temp. Treatment vermiculite time (min) with K (±C)
“1” Bu 5 No 50 a Li 5 No 50 b Bu 30 No 50 ab Li 30 No 50 c Bu 5 Yes 50 ac Li 5 Yes 50 bc Bu 30 Yes 50 abc Li 30 Yes 50 d Bu 5 No 100 ad Li 5 No 100 bd Bu 30 No 100 abd Li 30 No 100 cd Bu 5 Yes 100 acd Li 5 Yes 100 bcd Bu 30 Yes 100 abcd Li 30 Yes 100
adequate regression models, retaining only the regression coefficients found significant at thes1 2 pd confidence level ( p is the probability of type I error, which is the risk to consider erroneously a regression coefficient as significant).
III. RESULTS AND DISCUSSION A. Vermiculite characterization
The chemical composition measured by ICP of the vermiculite studied and the suppliers data are shown in Table III as the percentage weight of their oxides. Elements such as Mn, Ti, and Na present in the suppliers chemical analysis were below the detection limits for our ICP measurements. The percentage weights have been normalized for comparison purposes and the SiO2 nonnormalized figure included as an
indication of the overall composition. The major difference between the suppliers data and the ICP analyses are higher values for the K concentration. The potassium is double the level indicated by the supplier and the significance is discussed below in conjunction with the XRD and cation exchange data.
The XRD data recorded on the untreated vermiculite are shown in Fig. 1(a) where two vermiculite phases can be identified, the expected Mg vermiculite and a mica-like K vermiculite.1,14,20 The reflections at 14.2 ˚A and 11.9 ˚A are close to the 001 reflections characteristic of Mg vermiculite with two (14.3 ˚A) and one (11.6 ˚A) hydration layer, respectively. The reflection at 10.1 ˚A is typical of potassium aluminosilicates such as phlo-gopite or muscovite (micas) which do not swell, i.e., where the potassium interlayer cation does not exchange readily. This reflection is therefore indicative of some untransformed mica in our starting material — the natural precursor of vermiculite.7 The reflection at 12.4 ˚A can
be attributed to an interstratified layer19 in between the
contracted form of the potassium vermiculite and the magnesium vermiculite. No impurities in the form of iron or aluminum oxides could be indexed, suggesting that the Fe and Al in the chemical analysis are structural cations in either tetrahedral or octahedral sites in the
FIG. 1. X-ray diffractograms for the starting vermiculite and different vermiculite films: (a) exfoliated starting material, ( b) Bu vermiculite, (c) Li vermiculite, (d) K (Li) vermiculite, and (e) MB exchanged (Li) vermiculite.
vermiculite. No carbonates such as CaCO3 or MgCO3
were identified in the diffractograms.
The cation exchange capacity was found to be 81 meqy100 g of vermiculite s65%d, assuming that the exchangeable cations are Mg (65 meq), Ca (10 meq), and K (6 meq) as confirmed by ICP analysis of the filtrate after exchange (only about 6% of the K was exchanged),
TABLE III. Chemical composition (wt. %) of the starting vermiculite and after various treatments (precision evaluated at 5%).
Natural exfoliated Bu Li K – (Bu) K – (Li)
Oxide Supplier’s data vermiculite vermiculite vermiculite vermiculite vermiculite
SiO2 46.1 45.75 46.3 46.35 45.55 45.0 (42.0)a (41.6)a MgO 27.4 28.15 27.35 27.5 26.4 26.55 Al2O3 14.1 11.2 11.35 11.45 11.05 11.2 FeO 1 Fe2O3 7.8 9.0 9.65 9.3 9.5 9.0 CaO 0.5 0.5 0.05 0.1 0.1 0.15 K2O 2.9 5.4 5.3 5.35 7.85 8.15 aNon-normalized result.
Mg being the major exchangeable cation at 65 meqy 100 g. The CEC is lower than the 100 meqy100 g quoted by the supplier. This can be explained by the higher K content than indicated by the supplier and the consequent presence of mica-like minerals (or K vermiculite) in the vermiculite. The K vermiculite does not exchange its K easily,7 as indicated by the chemical analysis after
exchange (Table III). The XRD data for an exchanged vermiculite where the 10.4 ˚A reflection is still clearly observed [Fig. 1( b)] also supports this observation.
B. Casting of films
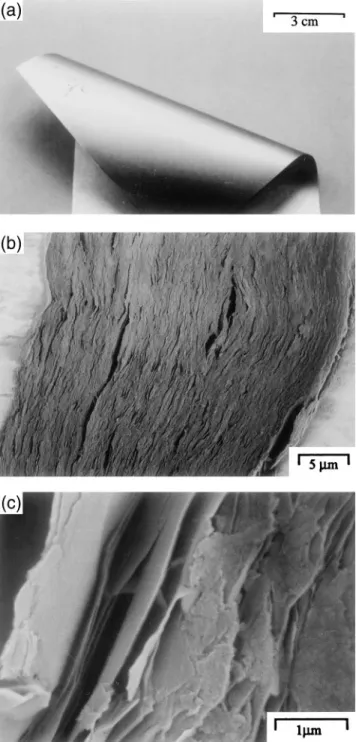
Films were cast from various suspensions and dried at 25 or 80±C. The drying at 80±C allowed a reduction in drying time from 48 h to about 6 h with no discernible effect on the film properties. Films prepared from Li suspensions sometimes showed inhomogeneities but the Bu suspension films gave very homogeneous, coherent, and flexible films [Fig. 2(a)]. All films had densities of between 1.1 and 1.3 gycm3 s60.1d with no discernible
influence of suspension type. Figure 2(b) shows a typical transverse section of a film where we observe the good alignment of the vermiculite particles. A rupture surface is shown in Fig. 2(c), illustrating the thin platelets of the delaminated vermiculite particles in the films.
C. Delamination and water affinity of films
The results of the adsorption of MB and the re-absorption of water indicating the films sensitivity to humidity are shown in Table IV.
The MB adsorption is quoted in mmole of MB adsorbed per gram of vermiculite and not as an “es-timated” surface area, because of the uncertainty of the surface area of an MB molecule and in its adsorbed form (dimer or monomer) or orientation (face-on edge-on or otherwise).18,21 The XRD results on Bu, Li, and
K exchanged vermiculites after MB adsorption show reflections between 11.8 and 12.2 ˚A [e.g., Fig. 1(e)]. This is indicative of MB monomer adsorption face-on in the vermiculite sheet structure as shown schematically in Fig. 3.20 Chemical analysis (ICP) of the filtrate after
MB adsorption on Li exchanged vermiculites showed Li in solution, indicating exchange had taken place.16
The adsorption of MB onto the external surface of the vermiculite is more likely to be in the dimer form at the concentrations used for the adsorption experiments.6,22
This suggests that the MB exchanges with the Li in the interlayer spacing and is probably adsorbed as a monomer and the external surface exposed by the delam-ination MB will more probably be adsorbed in the form the dimer. Therefore the amount of MB adsorbed should be a good indication of the efficiency of the delamination step. Without a delamination step the amount of MB adsorbed onto Li or Bu exchanged vermiculites was
FIG. 2. Images of K – Bu vermiculite film: (a) typical flexible film, ( b) typical transverse section, and (c) rupture surface.
lower by a factor of 5.18 In order to estimate the surface
area of these delaminated vermiculites a knowledge of the internal and external surface is therefore necessary. The use of nitrogen adsorption to estimate the external surface could be a possibility but Shelden et al.6 have
shown that this is viable only for low surface area micas and is not really applicable to our delaminated vermiculites. Therefore estimates of internal and external surfaces and specific surface areas cannot be estimated unambiguously.
TABLE IV. The amount of methylene blue adsorbed and water readsorbed for various vermiculite films.
MB adsorbed % H2O mmoleyg readsorbed Samples Treatments s60.02d s60, 2%d Bu V1 “1” 0.50 10.2 Bu V2 a 0.30 5.7 Bu V3 b 0.53 7.5 Bu V4 ab 0.36 5.0 Li V1 c 0.66 12.0 Li V2 ac 0.45 10.0 Li V3 bc 0.71 16.0 Li V4 abc 0.60 11.5 K – Bu V1 d 0.21 2.6 K – Bu V2 ad 0.19 3.0 K – Bu V3 bd 0.21 2.6 K – Bu V4 abd 0.18 2.5 K – Li V1 cd 0.16 4.1 K – Li V2 acd 0.15 3.2 K – Li V3 bcd 0.24 4.5 K – Li V4 abcd 0.21 3.3
The control chart in Fig. 4 shows the experimental data together with the adjusted values calculated with the statistical regression modelsp , 0.05d. The highest MB adsorption, i.e., most successful delamination, is seen for the Li exchanged vermiculite (volume of suspension 60 ml-bc), 30% more than the Bu exchanged sample. As the volume of suspension is increased the efficiency of delamination shows a decrease. The effect of exchanging
FIG. 3. Schematic representation of the methylene blue (MB) mole-cule with its assumed adsorption orientations.
with potassium (factor D) shows a marked decrease in the amount of MB adsorbed, indicating a closing of the delaminated sheets whereby the potassium does not exchange easily with the MB. This closing or contraction of the interlayer spacing on exchange with potassium (001 becoming about 10.4 ˚A) is clearly seen in the XRD data shown in Fig. 1(d).
The amount of water reabsorbed by the various films is also shown in Fig. 4. Here we see again that the most significant effect is the exchange with potassium (factor D) where the amount of water reabsorbed decreases from 6 – 16% to between 2 and 4%. The effect of the various treatments is much less significant after exchange with potassium. Before the exchange with potassium the most water reabsorbed was for the Li exchanged vermiculite (factor C) which was also the treatment that gave the best delamination (most MB adsorbed). In fact, the amount of
FIG. 4. Control chart of results of experimental plan used to assess the swelling, delamination, and water affinity of various vermiculite films (SE: standard error).
FIG. 5. Plot of water readsorption versus quantity of methylene blue adsorbed for various vermiculites.
MB adsorbed and water readsorbed correlate quite well (r2 0.936, p , 0.001), as shown in Fig. 5. Therefore the readsorption of water, a much simpler method than MB adsorption, gives a very good indication of the effi-ciency of the delamination step. The TGA data in Fig. 6 confirm that the amount of water contained in the films after the potassium exchange is greatly reduced. The next section and experimental plan will now describe the effect of this potassium exchange on the dielectric properties of these flexible vermiculite films.
D. Dielectric properties
The experimental plan used in this section looked at the effect of the swelling cation (A), the duration of the delamination step by ultrasonic treatment (B), the ef-fect of a final cation exchange with potassium (C), and finally the effect of the measurement temperature (D) on the dielectric properties of the various vermiculites films produced. The dielectric constant, e, and dielectric loss, tan d, measured at 50 and 100±C for the various
FIG. 6. Thermogravimetric analysis curves for Li vermiculite and K (Li) vermiculite films.
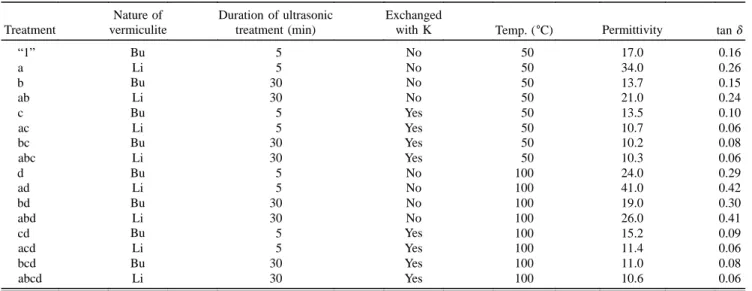
treatments are shown in Table V. The results in Table V are for a frequency of 1 kHz; the trends for the other frequencies were very similar. The trends are seen more clearly in the control chart in Fig. 7. Before potassium exchange there is a clear effect on both the e and tan d, depending on which swelling cation is used (factor A), the Li giving higher e and tan d values being a direct cause of the higher affinity for water and water content. The longer duration of ultrasonic treatment (factor B) shows an improvement for both types of swelling cation possibly due to better delamination and consequently better packing or contraction of the particles in the film. The most significant factor in the overall picture is the second ion exchange with potassium (factor C). A sig-nificant decrease in both e and tan d is seen irrespective of all other parameters, the results being very similar for all vermiculite films once this potassium exchange
TABLE V. Permittivity and dielectric loss, tan d, measured on different vermiculite films at 50 and 100±C and 1 kHz. Nature of Duration of ultrasonic Exchanged
Treatment vermiculite treatment (min) with K Temp. (±C) Permittivity tan d
“1” Bu 5 No 50 17.0 0.16 a Li 5 No 50 34.0 0.26 b Bu 30 No 50 13.7 0.15 ab Li 30 No 50 21.0 0.24 c Bu 5 Yes 50 13.5 0.10 ac Li 5 Yes 50 10.7 0.06 bc Bu 30 Yes 50 10.2 0.08 abc Li 30 Yes 50 10.3 0.06 d Bu 5 No 100 24.0 0.29 ad Li 5 No 100 41.0 0.42 bd Bu 30 No 100 19.0 0.30 abd Li 30 No 100 26.0 0.41 cd Bu 5 Yes 100 15.2 0.09 acd Li 5 Yes 100 11.4 0.06 bcd Bu 30 Yes 100 11.0 0.08 abcd Li 30 Yes 100 10.6 0.06
FIG. 7. Control chart of results of experimental plan used to assess the effect of various parameters on the dielectric properties of different vermiculite films.
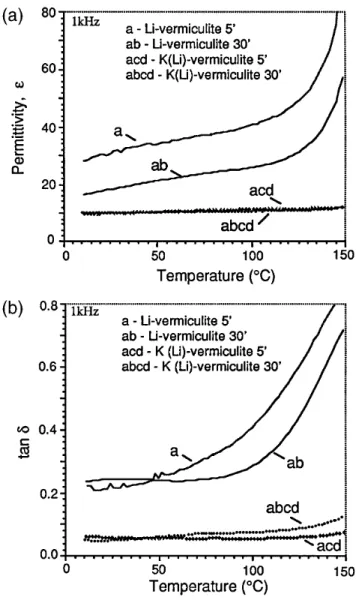
has been carried out. A significant improvement in the temperature stability of the dielectric properties is also observed as shown in Fig. 8 for the K– Li vermi-culite films. The majority of these improvements can be attributed to the substantial decrease in the water affinity and consequently content of these films after the potassium exchange, the best films produced having an e of 10.3 and tan d of 0.06, approaching those of sheet micas (e of 6 and tan d of 0.001).
IV. CONCLUSIONS
The fabrication of flexible vermiculite films with different swelling cations has been reported. The nature of the swelling cation used has an important effect on
FIG. 8. (a) Dielectric constant, e, and ( b) dielectric loss, tan d, for various Li-vermiculite films as a function of temperature.
the affinity of these films to readsorb water; lithium, more easily hydratable than the butyl ammonium, was the most sensitive. The more efficient the delamination step during the film production, the higher the affinity for water. A good correlation was observed between a simple gravimetric measurement of readsorbed water and the amount of methylene blue adsorbed by the various vermiculite films studied. This simpler method may allow quicker and easier determination of the efficiency of the delamination step used in the production of such vermiculite films. The effect of exchanging the swellable cation, either lithium or butyl ammonium, with potassium gave vermiculite films with much im-proved dielectric properties (e between 10 and 11 and tan d between 0.06 and 0.08). The temperature stability of the dielectric properties were also much improved, showing very little variation between 20 and 100 ±C. The reduction of water content and affinity for water
of the films after the second ion exchange is the major factor influencing the dielectric properties. The second ion exchange with potassium after the delamination step has led to the production of flexible films with dielectric properties approaching those of the much less flexible sheet micas. Such properties should be interesting for applications where sheet mica cannot be used because of its fragility.
ACKNOWLEDGMENTS
The authors would like to thank Mr. B. Senior for the SEM work, Dr. J-P. Dubois for help with the ICP analyses, Dr. A. Bell for the dielectric measurements, Dr. R. Mulone for help with the XRD data collection, and Asea Brown Boveri Ltd., Switzerland for their participation in the project.
REFERENCES
1. C. de la Calle and H. Suquet, Rev. Min. 19, 455 – 496 (1988). 2. R. K. Collings and P. R. A. Andrews, “Mica and Vermiculite,”
Canmet Report CM90-3E, Energy, Mines and Resources, Canada (1989).
3. J. A. Rausell-Colom, Trans. Faraday Soc. 60, 190 (1964). 4. C. C. Ou and J. C. Yang, United States Patent 4,655,842 (1982).
5. D. G. H. Ballard and G. R. Rideal, J. Mater. Sci. 18, 545 (1983). 6. R. A. Shelden, W. R. Caseri, and U. W. Suter, J. Coll. Interf. Sci.
157, 318 (1993).
7. K. Norrish, Discussion Faraday Soc. 18, 120 (1954). 8. A. Wild and J. Keay, J. Soil Sci. 15, 135 (1964).
9. R. L. Kerns, Jr. and C. J. Mankin, Clays Clay Miner. 16, 73 (1981).
10. I. Barshad, Am. Mineral. 39, 225 (1950). 11. B. L. Sawhney, Clays Clay Miner. 20, 93 (1972).
12. K. Sridhar and M. L. Jackson, Clays Clay Miner. 21, 369 (1973). 13. I. Shainberg and W. D. Kemper, Soil Sci. Soc. Am. Proc. 30, 707
(1966).
14. B. L. Sawhney, Proc. Fifteenth Conf. on Clays and Clay Minerals (1967), p. 75.
15. D. K. De, J. L. Das Kanungo, and S. K. Chakravarti, J. Indian Chem. Soc. 1, 501 (1973).
16. C. Minker-Villemin, Ph.D. Thesis No. 1249, Swiss Federal Insti-tute of Technology, Lausanne (EPFL) (1994).
17. M. Cremer, Am. Mineral 61, 318 (1976).
18. K. Bergmann and C. T. O’Konski, J. Phys. Chem. 67, 2169 (1963).
19. D. C. Montgomery, Design and Analysis of Experiments (Wiley & Sons, New York, 1991).
20. G. W. Brindley and G. Brown, Crystal Structure of Clay Minerals
and their X-Ray Identification (Mineralogical Society Monograph
No. 5, London, 1980).
21. P. T. Hang and G. W. Brindley, Clays Clay Miner. 18, 203 (1970). 22. W. Spencer and J. R. Sutter, J. Phys. Chem. 83 (12), 1573 (1979).