2008/20
A simple video-based system for examining irregularities in
very slow, smooth-pursuit eye movements in cancer patients
Ein einfaches Videosystem zur Untersuchung der Irregularita¨ten langsamer
Augenfolgebewegungen bei Krebspatienten
Marino Menozzi1,*, Kaspar Rhyner2,
Alena Joestl3, Hanspeter Sta¨hli2and
Esther Bergande1
1Swiss Federal Institute of Technology, Zurich, Switzerland
2Kantonsspital Glarus, Glarus, Switzerland 3HerbAquatic, Glarus, Switzerland
Abstract
Subjective observations made during routine examin-ation of eye movement functions (orthoptic status) reveal that very slow, smooth-pursuit eye movements in cancer patients are irregular. To objectively measure such move-ments, a video-based system was built to allow analysis of very slow, smooth-pursuit eye movements (1.88/s). Analysis involves quantification of drift and jerk-like gaze movements that cause deviations in gaze direction from the predicted trajectory. Gaze deviations observed in cancer patients are compared to those for the normal population. Our results show that deviations are more important in cancer patients than in the normal popula-tion. The difference is statistically significant (p-0.05) for deviations ranging between 0.758 and 1.758. In the future, the system may possibly be used in the diagnosis of cancer.
Keywords: cancer; smooth-pursuit eye movements; video
oculography.
Zusammenfassung
Aufgrund orthoptischer Untersuchungen besteht die Ver-mutung, dass bei Krebspatienten Unregelma¨ßigkeiten in langsamen Augenfolgebewegungen auftreten, die bei einer Normalpopulation nicht oder nur geringfu¨gig zu beobachten sind. Um die Vermutung mit objektiven Methoden zu untersuchen, wurde ein Videosystem ent-wickelt, mit dem langsame Augenfolgebewegungen (1.88/s) registriert und bezu¨glich Unregelma¨ssigkeiten ausgewertet werden ko¨nnen. Die Auswertung betrifft im Wesentlichen die Quantifizierung von Abweichungen der Blickrichtung zur vorhergesagten Blickrichtung bei langsamen Augenfolgebewegungen. Untersuchungen mit dem entwickelten System zeigen, dass Abweichun-*Corresponding author: Dr. Marino Menozzi, Swiss Federal
Institute of Technology, CH-8092 Zurich, Switzerland Phone: q41-44-6323981
Fax: q41-44-6321173 E-mail: [email protected]
gen zwischen 0,758 und 1,758 bei Krebspatienten signi-fikant (p-0,05) ha¨ufiger auftreten als bei der Normal-population. Das System ko¨nnte in Zukunft fu¨r die Dia-gnose von Krebs von Bedeutung sein.
Schlu¨sselwo¨rter: Augenfolgebewegungen; Krebs;
Video-Okulographie.
Introduction
Eye movements are studied in many fields, ranging from more applied issues, such as marketing, to basic science aimed at understanding processes in the brain w2, 3x.
Four types of eye movement are known: smooth pursuit, saccades, vergence and vestibulo-ocular reflex movements. Smooth-pursuit eye movements are found when an observer visually tracks a smoothly travelling object in a fronto-parallel plane. The velocity of the eye movement during smooth pursuit increases linearly with the target velocity. For velocities between 10 and 908/s, the smooth-pursuit velocity follows the target velocity with a slope of 0.9 and reaches a maximum velocity of approximately 1008/s w10x. When there is a need to resolve small details, the eye must be oriented to focus details onto the fovea. Since the acquisition of visual information requires some time, in a first approximation the detail must be kept stationary on the fovea. This process is called fixation. Reading or scanning a scene is accomplished by a series of fixations followed by a rapid dislocation of fixation, a so-called saccade. The maximum speed of horizontal saccades can be modelled as an asymptotic exponential function with a peak at 5208/s w1x. Vergence movements are conjugated or dis-conjugated eye movements used to change fixation in depth. The maximum velocity of vergence eye move-ments is approximately 2008/s w5x. Eye movemove-ments may be triggered or synchronised with visual and vestibular input (vestibular-ocular reflex) to stabilise the retinal image. For instance, optokinetic nystagmus occurs when gazing at stripes on a rotating cylinder.
During prolonged fixation the eye is not at complete rest, but performs small saccades, so-called microsac-cades, and drift movements. As cited elsewhere w6, 12x, microsaccades were reported as early as 1950 by Ratliff and Riggs. The amplitude of microsaccades varies with the experimental set-up, among other factors. An ampli-tude of approximately 0.2–1.18 with a typical frequency of ;0.1–5 Hz w12x is observed when the subject’s head is fixed using a forehead and chin rest. When a bite bar is used, the amplitude recorded is two- to four-fold
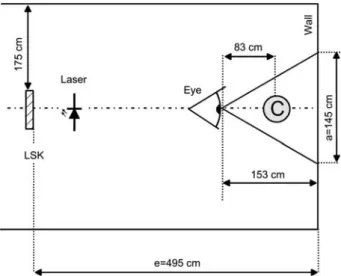
small-Figure 1 Experimental set-up for recording slow smooth-pur-suit eye movements showing the position of the scanning mirror, the laser, the wall, the position of the observer’s eye and the two cameras (C) used to record the pupils of the observer. er w12x. Microsaccades have been studied using a fixed
target. It is unclear whether the properties of microsac-cades depend on the motion of the target.
Interestingly, little is known about very slow, smooth-pursuit eye movements. During assessment of orthoptic status, very slow, smooth-pursuit eye movements are stimulated by sweeping a finger at a speed of approxi-mately 1–108/s across the fronto-parallel field of gaze. An orthoptic examination also involves approximate detec-tion of loss of fixadetec-tion. Thus, two types of loss of fixadetec-tion are of interest. In the first type, the patient is not able to fixate the target beyond a given range in the field of gaze. In the second type, fixation is lost only for a short period of time and correct fixation then returns. To catch up with the target, the eye performs a small saccade. Alterna-tively, the gaze varies in speed to re-establish proper fix-ation. The first type of fixation loss is easy to observe by eye. In contrast, detection of the second type of fixation loss depends on the experience of the examiner.
Given their wide range in speed and amplitude, differ-ent methods are required to investigate differdiffer-ent types of eye movements. To the best of our knowledge, methods for studying very slow (1.88/s) smooth-pursuit eye move-ments in humans have not been reported in the literature. In particular, we were not able to find any reports on the properties of very slow, smooth-pursuit eye movements in cancer patients.
Recording of slow, smooth eye movements in clinical practice was a major challenge 30 years ago. At that time, electro-oculography (EOG) was frequently used to record eye movements in clinical practice. Since EOG is an AC coupled method with a time constant of 1.5–2 s w11x, determination of the exact position of fixation is a problem in very slow, smooth-pursuit eye movements. More adequate methods for this purpose are the scleral search coil (a coil placed on the eyeball) or video-based techniques, which have been shown to be equivalent in terms of precision w4x. The scleral coil method is not suit-able for routine orthoptic examination since it is too obtrusive. Commercial video systems are thus more appropriate for recording slow, smooth-pursuit eye movements in patients. Digital camcorders, which are widely available and are inexpensive, can record video images digitally or/and transmit recorded signals digitally, making PC hardware for digitising analogue video signals superfluous. However, there is still a lack of methods for analysing video records to extract information about irregularities in slow, smooth-pursuit eye movements.
A recent attempt to detect slow eye movements (SEMs) was reported for a sleep research study. SEMs are defined, among other criteria, as sinusoidal excur-sions of 0.2–0.6 Hz lasting more than 1 s w7x. SEMs are detected by eye using a plot of recorded eye move-ments. The procedure is time-consuming and suscepti-ble to important inter- and intra-scorer errors w7x. A wavelet-based technique may be used to overcome this problem in the future w7x.
We developed a video-based system to assess gaze deviations from a predicted trajectory for very slow, smooth-pursuit eye movements (1.88/s). The system requires a unit that generates a moving target, a video-based device for recording the pupil, a method for
com-puting the gaze direction using video records of the pupil, and a method for quantifying gaze deviation from the predicted trajectory. The system was used to compare deviations for cancer patients with deviations for the normal population. This allows objective investigation of differences in deviation between normal subjects and patients.
Materials and methods
Slow-moving fixation target
The configuration used to produce a slow-moving fix-ation target is shown in Figure 1. The target was gener-ated by projecting the beam of a red (670 nm) laser (Laser Modul 670 nm, LAS67/01-L, Conrad Elektronik AG, Wollerau, Switzerland) on a white wall using a scan-ner mirror (LSK 120E; Laser Scanning Kaiser AG, Stalli-kon, Switzerland). The scanning mirror is driven by a triangular wave with a period length of 55.2"0.55 s and was positioned 495 cm from the wall. The length of the trajectory (see a in Figure 1) of the red dot produced on the wall was 1.45"0.03 m. The observer viewed the red dot at a distance of 153 cm from the wall. The observer’s head was fixed with a forehead and chin rest. The target appears to travel at a mean speed of approximately 1.88/s. Since the dot travels in a fronto-parallel plane and the scanning mirror is driven at a constant angular veloc-ity, the angular velocity perceived by the observer varies, depending on the position of the dot. Differences in the perceived speed of the dot in the sagittal plane and in the outermost position of the dot were computed by means of trigonometric calculations. The perceived speed varied by less than 22% and can therefore be neglected in this context.
Video recording unit
Gaze was recorded by tracking the pupils of the observer using video cameras placed slightly below the observer’s
Frankfurt w8x plane at 83 cm from the eye. Two digital video camera recorders were used for this purpose. Video images of the left and right eyes were recorded using Sony DCR-PC100 and DCR-TRV125E cameras (Eschenmoser AG, Zurich, Switzerland), respectively. Separation between the two centres of the camera lens-es was approximately 10 cm. By zooming, the image pane was adjusted to cover the full eye of the observer. Video recordings (25 frames/s) were stored digitally on the camera tape. After measurement, data were trans-ferred via a digital-to-digital connection (iDV or IEEE1394) to a PC and stored in AVI format at a resolution of 768=576 pixels. The resolution was adapted to the total number of pixels of the charge-coupled device (CCD) of the cameras (690,000 for the PC100 and 400,000 for the TRV125E).
As reported below, calibration revealed a resolution of 0.58/pixel. As previously shown w9x, momentum analyses of the image of the pupil improve the resolution of the gaze direction recorded. We previously used a CCD of 500=582 pixels to record images of the pupil, with the unit optics configured to record changes in gaze of 408 in the horizontal direction w9x, representing optical reso-lution of approximately 0.088/pixel. We also showed that for a pupil of 3 mm and one of 6 mm in diameter, momentum analysis improves the resolution to approxi-mately 0.0278 and 0.0138, respectively w9x. We can there-fore assume that momentum analysis improves the resolution by a factor of three or more, depending on the number of pixels forming the area of the pupil. Thus, we assume that the method reported here allows for a res-olution of 0.178 (per pixel) or better.
A halogen illumination source with two fibre optic light guides was used to illuminate the two eyes. To minimise glare, the visible spectrum of the illuminating light was reduced using an RG 630 edge filter with a cut-off at 630 nm (Schott, Mainz, Germany).
Determination of gaze direction by analysing video records
Videos recorded of the pupil were first stored digitally on tape then processed by computing the first momentum of the pupil using a purpose-built program. To reduce artefacts produced by this program, some parameters used by the program require manual adjustment, which represents a drawback in automatic analysis. However, adjustment of the parameters allows the system to cope with varying measurement conditions. In our case, for instance, recordings of smooth-pursuit eye movements were carried out in a room partially illuminated by varying daylight. The quality of the pupil image therefore varied, depending on the amount of daylight and on the amount of bright objects reflected in the patient’s eye. Para-meters requiring manual adjustment include the contrast enhancement of the red channel, the threshold lumi-nance for pupil detection and the number of passes for recursive computation of the momentum, as explained below.
Since the eye is illuminated by red light, the contrast of the pupil image is enhanced by giving the red channel an advantage over the green and blue channel. Amplifi-cation of the red channel is manually selected by visually
comparing the resulting pupil image with the original. Amplification values of 3 (70%), 2 (7.5%) and 1 (22.5% of cases) were used in the present study.
Threshold luminance refers to the luminance Y, which is computed according to the National Television System Committee (NTSC) standards for the transformation of
RGB to YUV coordinates, by weighting the RGB values
as follows:
Ys0.299=Rq0.587=Gq0.144=B.
The image of the pupil is converted into a 1-bit image using the threshold luminance Y. Conversion involves setting to 1 the value for pixels darker than or equal to the threshold and setting to 0 the value for pixels brighter than the threshold. The momentum of resulting 1-bit image is computed for the x and y coordinates.
In the case of ideal pupil detection, the number of pixels with a value of 1 is proportional to the area of the pupil. This relation is used in recursive computation of the first momentum to reduce artefacts resulting from dark spots appearing outside the pupil. The initial esti-mate of the first momentum is used as the centre of a square. The edge of the square is set to twice the dia-meter of a circle with an area corresponding to the num-ber of pixels with a value equal to 1. The first momentum of the image is re-computed after discarding pixels out-side the square. The number of passes for which this procedure is repeated is manually selected. Except for one case, the number of passes was set to 1 for all eval-uations reported below.
Finally, a cross is plotted within the original image of the pupil at the position found for the first momentum. Single images including the cross are concatenated and saved as a movie that can be visually checked for pos-sible artefacts.
Quantification of deviations in fixation
The program used to determine the gaze direction anal-yses the video frame by frame and generates a file that includes the frame number, the x and y coordinates of the first momentum of the pupil in each frame, and the total number of pixels below the threshold in each frame. In a few frames, momentum detection fails and an arte-fact is produced. For instance, when the eyelid is shut, the pupil is not detected. In such a case, the computed first momentum deviates significantly from the momen-tum detected in the previous frame. To eliminate such artefacts, the change in gaze direction is limited to 508 per frame, corresponding to 12508/s if a rate of 25 frames/s is considered. Outliers are replaced using the coordinates of the first momentum detected in the previous frame. Replacing an outlier using the average for neighbouring frames was considered inadequate because this method would fail in the case of two con-secutive outliers.
The method for detecting deviations in fixation is based on two subjective observations made during patient examination. First, the eye may cease centrally fixating the smooth travelling target for a short time and then resume normal fixation. Second, loss of fixation appears to be caused by drift movements and
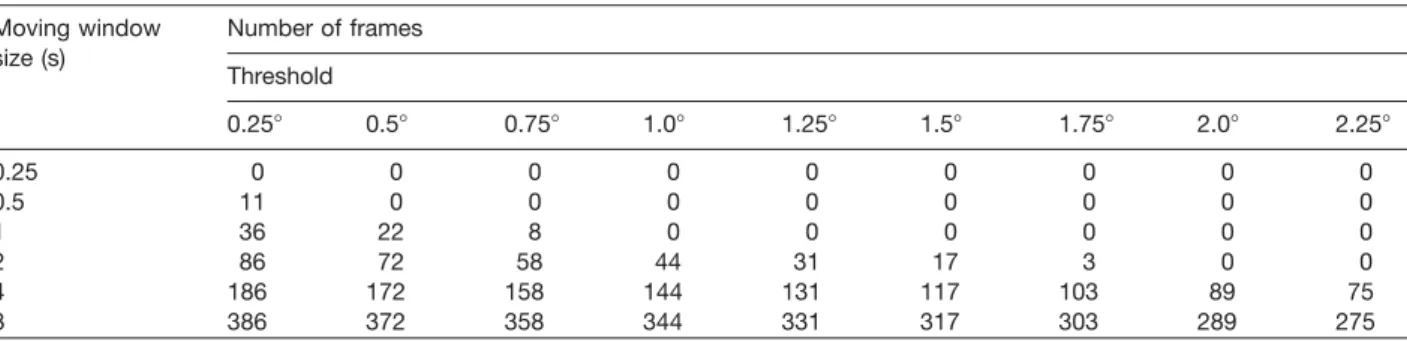
microsac-Table 1 First-order approximation of the effect of the moving window size on the number of frames in which the first momentum departs from the correct position by a given amount (threshold).
Moving window Number of frames size (s) Threshold 0.258 0.58 0.758 1.08 1.258 1.58 1.758 2.08 2.258 0.25 0 0 0 0 0 0 0 0 0 0.5 11 0 0 0 0 0 0 0 0 1 36 22 8 0 0 0 0 0 0 2 86 72 58 44 31 17 3 0 0 4 186 172 158 144 131 117 103 89 75 8 386 372 358 344 331 317 303 289 275
The correct number of frames is less than the number reported in the Table. Data denote the number of frames in which the deviation is at least as large as the threshold for a gaze speed of 1.88/s.
Figure 2 Horizontal direction of gaze during calibration (rec-tangular function) and during smooth-pursuit eye movements (triangular function).
The gaze direction is expressed in pixels as a function of time. Pixels refer to the horizontal coordinate of the first momentum, which was computed using the pupil image.
cades. We estimate that under such circumstances a velocity criterion would fail to detect small deviations in gaze from the predicted position. Therefore, we detected deviations by comparing the actual gaze direction with the gaze direction resulting from linear fitting of the data. If the absolute difference between the actual gaze direc-tion and the predicted direcdirec-tion is greater than or equal to the threshold, then the actual direction is classified as departing from the fitted direction. The total number of frames in which gaze is found to depart from the fitted direction is taken as a measure of gaze deviation during the smooth-pursuit eye movement task. Data were ana-lysed using different thresholds ranging from 0.258 to 2.258 in steps of 0.258.
A moving window was used for linear fitting of record-ed data. This technique has two advantages comparrecord-ed to fitting of the whole pursuit in one direction using a straight line. First, geometric distortions of the trajectory of the fixation target are better taken into account by a moving window compared to linear fitting of the whole pursuit in one direction. Second, there is no need to iden-tify points of reversal during pursuit.
In proximity to points of reversal during pursuit, the linear fitting method generates a bias. It can be shown that in proximity to points of reversal, the slope for smoothed data is half the value of the slope for the orig-inal data in a first-order approximation. Therefore, the bias increases with time at a speed of half the slope of the original data. Assuming a slope for the original data of 1.88/s, a given size of the moving window and a given threshold for classifying data as departing from the pre-dicted trajectory (see above), we can compute the num-ber of frames in which data are classified as departing from the predicted trajectory due to bias. The results in Table 1 are based on the first-order approximation described above and the exact number of frames is lower than the values reported in Table 1.
Experimental procedure and calibration
Before eye movements were recorded, subjects under-went a standard vision test including acuity, stereopsis and amplitude of accommodation, as well as a standard assessment of the orthoptic status. This included exam-ination of near and far binocular fixation, assessment of
the near point of binocular fixation and further checks of binocular motility.
After these tests, the subject’s head was fixed in the forehead and chin rest. A bite board was considered too obtrusive in our circumstances. Subjects were instructed to fixate on the red dot on the wall as precisely as pos-sible. In the first step, the instrumentation was calibrated. For this purpose the dot was displaced between the two end points of the trajectory by means of a rectangular function.
After calibration, the dot was moved using a triangular function. Subjects were asked to continue fixating on the dot. When the dot approached one of the endpoints of the trajectory, subjects are alerted that measurement was going to start. The examiner signalled the start of the measurement verbally as soon as the dot appeared at the corresponding endpoint of the trajectory. After approximately 56 s (one period) the dot appeared again at the endpoint of the trajectory and the experimenter signalled the end of the measurement.
To determine conversion between the coordinate of the first momentum of the pupil image, which is expressed in pixels, and the gaze direction, expressed in degrees, momentum values assessed during the calibration were analysed statistically. For this purpose, a histogram of the coordinate of the first momentum was plotted for each
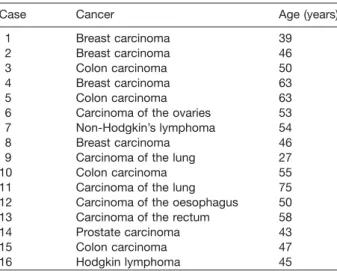
Table 2 Pathological background and age of the cancer patients.
Case Cancer Age (years)
1 Breast carcinoma 39
2 Breast carcinoma 46
3 Colon carcinoma 50
4 Breast carcinoma 63
5 Colon carcinoma 63
6 Carcinoma of the ovaries 53
7 Non-Hodgkin’s lymphoma 54
8 Breast carcinoma 46
9 Carcinoma of the lung 27
10 Colon carcinoma 55
11 Carcinoma of the lung 75
12 Carcinoma of the oesophagus 50
13 Carcinoma of the rectum 58
14 Prostate carcinoma 43
15 Colon carcinoma 47
16 Hodgkin lymphoma 45
calibration record. The two most frequent coordinates were identified as corresponding to the gaze direction when fixated on the red dot while at the left and right endpoints (see Figure 2). Conversion was computed by taking the ratio between the amplitude of the red dot as seen from the observer’s position in degrees and the dif-ference between the two most frequent coordinates in pixels.
Subjects
Subjects were recruited from patients and personnel of Glarus Hospital and their acquaintances. Subjects were informed about the purpose and risks of the study and on the anonymous data management involved. After being told that they were free to leave the study at any time without personal consequences, subjects were asked to give informed consent to participate in the study. Subjects were not rewarded.
A total of 40 subjects took part in the experiment, 16 of whom (8 females) were patients with a diagnosis of cancer. Details of the cancers are listed in Table 2. Patients were selected based on organisational criteria. Among the patients there were six carcinomas of the gastrointestinal tract, four breast carcinomas, two lym-phomas, two lung carcinomas, one ovarian carcinoma and one prostate carcinoma.
The patient age ranged from 27 to 75 years, with a median of 50 years and quartiles of 45 and 57 years. Binocular decimal acuity (Landolt ring, 5 m) in this group ranged from 0.4 to 2.0, with a median of 1.0 and quartiles of 0.7 and 1.4, respectively. The normal population con-sisted of 24 subjects (12 females) who were hospital staff members or acquaintances of the patients or staff who declared that they were healthy. The age of these healthy subjects ranged from 18 to 79 years, with a median of 51 years and quartiles of 43 and 59 years. Binocular deci-mal acuity in this population ranged from 0.5 to 2.0, with a median of 1.26 and quartiles of 0.89 and 1.44, respect-ively. A Mann-Whitney U-test revealed no significant dif-ference between the two groups for either age (ps0.881) or binocular acuity (ps0.503). Further details of the
vision testing and orthoptic status will be reported elsewhere.
Results
Since sound was always recorded on the video tape and since the experimenter verbally commented on all steps during measurements, manual extraction of single sequences for calibration and measurement was easily accomplished. Figure 2 shows a plot of the horizontal gaze direction for one subject recorded during calibration and during measurement. The vertical shift in range between the calibration and the measurement data is due to an offset produced by the function generator used to drive the mirror scanning the red spot on the wall.
The mean duration of the sequences analysed for our 40 subjects was 57.9"5.1 s, which is approximately 2 s longer as the mean trajectory of the red dot.
Individual data on gaze direction as a function of time were plotted and visually inspected. For some of the data, the gaze direction appeared to be constant. By comparing the computed gaze direction with the video, we were able to identify this phenomenon as an artefact. Data sets for which the gaze direction appeared to be constant (slope s 0) for more than 5% of the duration of the analysed sequence were rejected. Thus, three data sets for the right eye (subjects 3, 17 and 25) and five sets for the left eye (subjects 11, 12, 16, 28, 32) were discarded.
As reported above, in frames in which the first momen-tum could not be detected, the first momenmomen-tum was tak-en from the previous frame. In our data this occurred for 100 frames, representing an average of 1.25 frames per eye. The number of frames that could not be detected in patients and healthy subjects were compared by Mann-Whitney U-test: there was no significant difference in the number of frames not detected between the two groups (ps0.469).
In a first step, we will compare the amount of detected deviations in our two groups based on data fitted using a 2-s moving window.
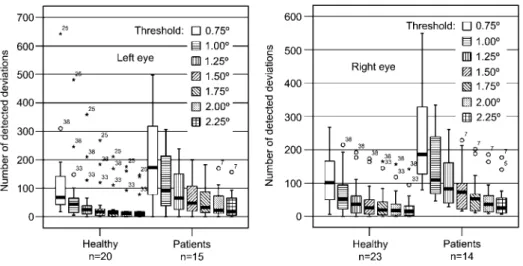
The number of frames in which the actual gaze direc-tion departed from the fitted direcdirec-tion is plotted in Figure 3 as function of the threshold (0.758 to 2.258) determining the deviation for the left and right eye separately.
For each threshold, median numbers of frames detect-ed in the two groups were compardetect-ed using the Mann-Whitney U-test. The results are listed in Table 3. It is evident from Table 3 that the number of frames above the threshold differed significantly (p-0.05) between patients and healthy subjects for thresholds between 0.758 and 1.758. We can therefore state that deviations in gaze direction from the predicted trajectory in very slow, smooth-pursuit eye movements are more frequent in patients than in healthy subjects.
Comparing median values in Figure 3 with bias com-puted generated due to the moving window fitting tech-nique (see Table 1, first order approximation of number of frames above threshold due to bias) we can conclude that in healthy subjects, deviations approach the size of
Figure 3 Boxplot representation of the number of frames in which deviations of actual gaze direction from the fitted direction were detected.
The left panel refers to the left and the right panel to the right eye. The left-hand group in each panel refers to data for healthy subjects. Circles and asterisks denote outliers and are labelled with the number of the subject. Medians (bold line within the box) for healthy subjects and patients differ significantly for thresholds between 0.758 and 1.758 (see Table 3).
Table 3 Mann-Whitney U-test results for comparison between healthy subjects and patients of the number of frames above the threshold for deviation of gaze direction from the predicted trajectory.
Healthy Patients (n) Probability p subjects (n)
Threshold
0.758 1.008 1.258 1.508 1.758 2.008 2.258
Right eye 23 14 0.002 0.002 0.005 0.010 0.022 0.057 0.088
Left eye 20 15 0.043 0.055 0.033 0.036 0.033 0.074 0.158
the bias. In contrast, deviations in patients are about twice as important as the bias.
The evaluation reported above was also carried out for data fitted using moving windows of 8 s, 4 s and 1 s. The number of deviations detected differed significantly between the two groups for all thresholds (0.758–2.258) when using the 8-s and 4-s windows. For the 1-s win-dow, significant differences were only found for thres-holds of 0.758 and 18. We therefore believe that in our case a window size of 2 s is optimal for fitting data on very slow, smooth-pursuit eye movements.
Discussion
As shown experimentally, we developed a method to allow objective quantification of a phenomenon reported for cancer patients performing very slow, smooth-pursuit eye movements.
The correlation of the phenomenon with the illness raises the question as to whether the phenomenon is due to medication, to hospitalisation in general or is more directly related to the illness. If the latter is true, analysis of very slow, smooth-pursuit eye movements might con-tribute to cancer diagnosis. A small amount of equipment is required to perform measurements: a video camera, a forehead and chin rest, a light source used to improve pupil illumination, and a device used to generate a smooth-travelling fixation target. If the room illumination
can be controlled, a light source to illuminate the pupil is not required. The fixation target can be produced by video projection of a computer-generated target. There-fore, the equipment required can be reduced to a video camera, a forehead and chin rest, a PC and a beam, all of which are easily available at a moderate price. It is possible to record both eyes using a single video camera, which again reduces the complexity of the system. Recording of both eyes is not even necessary, as it has been shown that differences between healthy sub-jects and patients are statistically significant for each eye separately for a threshold between 0.758 and 1.758 (Table 3).
Subject perturbation by the instrumentation is consid-ered to be small, which is an advantage over other meth-ods used to investigate eye movements objectively. The advantage is a particular benefit for patients exposed to frequent clinical tests involving technical equipment.
To reduce artefacts due to variations in illumination set-tings, manual adjustment of only three parameters of the video analysis software is required. Since the effect of such adjustments is displayed online, the adjustment procedure is fast and easy.
Some assumptions have been made for predicting the trajectory of smooth eye movements. In particular, the size of the moving window for smoothing is a factor that controls the experimental outcome. By varying the size of the window and considering a speed of 1.88/s, we were able to determine an optimal window size of 2 s.
It is hoped that further research work will confirm that the method can be used as a tool in early cancer diagnosis.
Acknowledgements
We thank the hospital of canton Glarus, Switzerland, for financial support of this research. We are greatly indebted to the subjects who participated in this study. Particular thanks are due to the patients who were willing to undergo the experimental procedure despite the hardship endured due to their illness. We also wish to thank two anonymous reviewers for their helpful and detailed comments on an earlier version of the paper.
References
w1x Collewijn H, Erkelens C, Steinmann R. Binocular co-ordi-nation of human horizontal saccades. J Physiol 1988; 404: 157–182.
w2x Duchowski A. A breadth-first survey of eye tracking appli-cations. Behav Res Methods Instrum Comput 2002; 34: 455–470.
w3x Hayhoe M, Ballard D. Eye movements in natural behaviour. Trends Cognit Sci 2005; 9: 188–194.
w4x Imaia T, Sekineb K, Hattoric K, et al. Comparing the accu-racy of video-oculography and the scleral search coil
sys-tem in human eye movement analysis. Auris Nasus Larynx 2005; 32: 3–9.
w5x Judge S. Vergence. In: Carpenter R, editor. Vision and visual dysfunction. Vol. 8: Eye movements. Houndmills: Macmillan Press 1991: 157–172.
w6x Kowler E. The stability of gaze and its implications for vision. In: Carpenter R, editor. Vision and visual dysfunction. Vol. 8: Eye movements. Houndmills: Macmillan Press 1991: 71–92.
w7x Magosso E, Provini F, Montagna P, Ursino M. A wavelet based method for automatic detection of slow eye move-ments: a pilot study. Med Eng Phys 2006; 28: 860–875. w8x Menozzi M, von Buol A, Itschner L, Saluz L, Krueger H. Die
Eignung verschiedener cephalometrischer Bezugslinien fu¨r die Bestimmung der vertikalen Ausrichtung des Kopfes. Z Morphol Anthropol 1996; 81: 205–215.
w9x Menozzi M, von Buol A, Krueger H. Messbrille zur Erfassung von Augen-, Kopfbewegungen und Pupillendurchmesser. Biomed Tech 1991; 36: 253–259.
w10x Meyer C, Lasker G, Robinson D. The upper limit of human smooth pursuit velocity. Vision Res 1985; 25: 561–563. w11x Minnigerode B, Grohmann R, Bartholome´ W. Zur
Proble-matik der Elektronystagmographie in der klinischen Dia-gnostik der Vestibulariserkrankungen. Eur Arch Oto-Rhino-Laryngol 1977; 218: 123–133.
w12x Moller F, Laursen M, Tygsen J, Sjolie A. Binocular quantifi-cation and characterisation of microsaccades, Grafe’s Arch Clin Exp Ophthalmol 2002; 240: 765–770.