Cardiovascular Research, 1972, 6, 257-262.
Intrinsic myocardial recovery
from
the negative
inotropic effects
of
acute hypercapnia
P . F O E X I
and
R . M . M . F O R D H A MFrom the Nufield Department of Anaesthetics, Radcliffe Infirmary, Oxford
A U T H O R S ' S Y N O P S I S The inotropic effects of hypercapnia have been examined in the isometric papillary muscle preparation from the cat. The initial stage of depression which resulted from the acute induction of hypercapnia was followed by a significant degree of spontaneous recovery during the next hour. When the carbon dioxide concentration was returned to normal a temporary rebound in performance to well above control levels was observed. These findings are interpreted as being due t o slow changes arising within heart muscle itself which partially compensate for the direct inotropic depressant effect of hypercapnia.
It is firmly established that heart muscle is depressed by high levels of carbon dioxide (CO,), and that its performance is enhanced in the presence of a low carbon dioxide level (Boniface and Brown, 1953; Nahas, 1957; McElroy, Gerdes, and Brown, 1958; Ng, Levy, and Zieske, 1967; Noble, Trenchard, and Guz, 1967; Caress, Kissack, Slovin, and Stuckey, 1968; Pannier and Leusen, 1968). During the course of a study on the acute effects of CO, on the cat papillary muscle preparation we observed that, following the initial stage of depression seen after the CO, concentration was acutely raised, some recovery in performance appeared t o occur. This paper describes the studies we have made to confirm this observation.
Methods
Nine experiments were performed in eight isometric right ventricular papillary muscle preparations from the cat. After the induction of anaesthesia with nitrous oxide, oxygen, and halothane (2-2.5%), the heart was rapidly excised and immersed in oxy- genated Ringer-phosphate-bicarbonate solution at room temperature. One minute later the beating heart was removed from the solution, the right ventricle opened, a suitable papillary muscle selected, and a short length of 4/0 non-capillary
1 Dr. P. Foex was supported by a grant from the Hbpital Cantonal et
Universitaire, Geneva. and by a special grant from the Holderbank Stiftung, Aargau, Switzerland.
braided thread tied to its upper end. The muscle was then detached from the ventricular wall and placed in position in a temperature controlled muscle bath. Experiments were performed at temperatures of 19-23°C and in any single experiment was kept constant to within 0.2"C. The solution in which the muscle was immersed was of the following composi- tion (m-mole/l.); NaCl= 119-4, KCl = 4.8, MgS04 = 1 '2, CaCl, = 2.6, NaH,PO, = 1.2, NaHC03=29.5 with glucose 1 0 0 mg %. The pH of the solution was measured with a microelectrode and pH meter (Radiometer PHM27GM) main- tained at the same temperature as the muscle bath. The solution was continuously equilibrated with one of two gas mixtures containing either 4.67%
or 9.79% carbon dioxide in oxygen.
The upper end of the muscle was attached by the braided thread to a heavily counter-weighted lever and the initial length of the muscle was set by a micrometer gauge which impinged on the upper surface of the tip of the lever. The lower end of the muscle was held in a light clip fixed to a stainless steel rod which passed through a mercury seal in
the bottom of the bath to a Devices 2ST02 tension transducer. The transducer was energized from a Tektronix type 'Q' strain gauge pre-amplifier. The rate of force development (dF/dt) was obtained by differentiating the force signal on the principles described by Gersh, Hahn, and Prys-Roberts (1971), the gain of the differentiator being linear between frequencies of 0 to 10 Hz. Both the force
and the dF/dt signals were displayed on a Tektronix dual beam oscilloscope (Model 556), and also on a
258 Foex and Fordhani
Devices two-channel recorder with which a con- tinuous record could be obtained at slow paper speed. The muscle was stimulated by a Palmer square-wave stimulator through two platinum electrodes placed on either side of the muscle. The rate of stimulation was 30/min in four experiments and 20/min in the other five.
Having been placed in the bath and a suitable resting muscle length having been selected, the preparation was allowed to stabilize in the presence of 467% C 0 2 . A slow continuous recording of
force development and dF/dt was then begun, and continued for 30 min. After this time the high concentration of CO, was admitted to the bath and changes in performance recorded for 60 min.
4.67% CO, was then readmitted and the recording continued for a further 60min. Intermittent measure- ments of bath temperature and p H were made during the course of the experiments, and initial muscle length remained unaltered.
For the purpose of analysing the results, the point just before 9.79% C 0 2 was admitted into the bath was taken as the control level, and all previ-
ous and subsequent readings were compared with the figures obtained at this moment. Values for active force ( = maximum developed force - resting force) in grams and for the peak rate of force development (peak dF/dt) in grams per second were extracted from the records at the following times: the control point; 10, 20, and 30 min before the control point; at the point of maximum de- pression of contraction and at 10 min intervals after the introduction of 9.79% C 0 2 ; at the point of maximum increase in contraction and at 10
F I G . I The original dFidt tracings from eight min intervals after the reintroduction of 467% experiments. A t point A the C 0 2 concentration was C 0 2 into the bath. The statistical significance of
changed from 4.67% to 9.79%, and at point B changes in active force and in peak dF/dt was
4.67:; C 0 2 WRS reintroduced into the mirscle bath. analysed using a two-tailed paired Student’s t
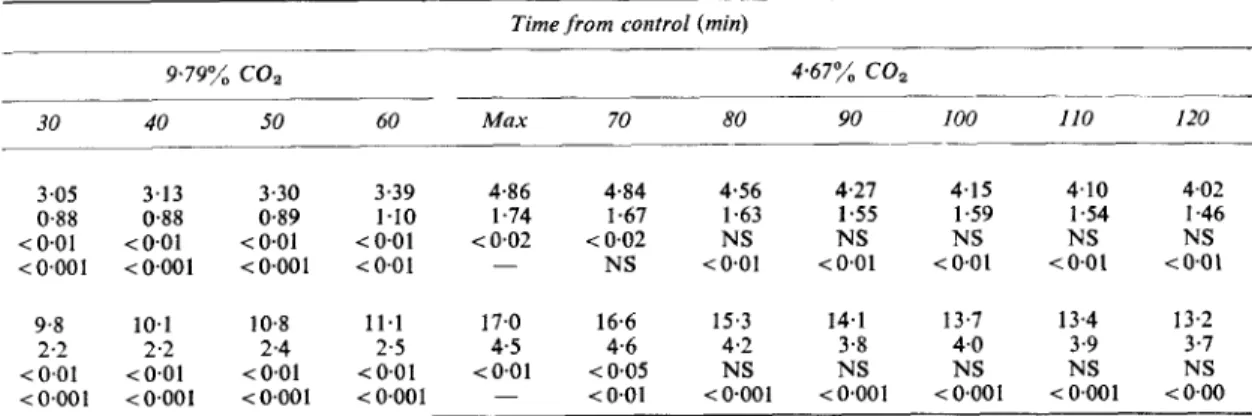
T A B L E I
Resiclts, gicing meam and standard deviations ( S D ) for active force and peak dFIdt at intercals before and after the control point*
Time from control (nun)
- - __ ______ 4 67% COz 9.79% coz ~ ~ _ _ _ _ _ --- - 30 - 20
-
I0 0 inin I0 20 .~ _ _ _ ~ ~ ~- Force Ig) Mean 4 02 3 98 4 03 4 06 2 59 2 69 2 87 S D 1 5 5 1 4 8 1 4 5 I 4 6 0.93 0 92 0 88 P NS NS NS - <0001 <0.01 <0.01 - - - - NS <0.01 P* - Mean 13 8 13 8 13 8 1 3 8 8 0 8 4 9 3 TD 3 8 3 8 3 6 3 6 2 4 2 2 2 2 P N S NS N S - <0001 <a001 < a 0 1* The statistical wznificance of changes are shown from control (P) and from the preceeding minimum or maximum value (P*).
Min =the point of maximum depression after the beginning of hypercapnia, Max = the point of maximum overshoot after the reintroduction of the control C O , concentration.
Peak d F , d t i g sec)
-
- - - <005 <0001259 Intrinsic myocardial recovery during hypercapnia
test for small samples, utilizing one experiment in
each muscle, amounting to eight in all.
Results
In Fig. 1 are displayed the dF/dt tracings from eight of our experiments, and the mean changes in peak dF/dt and active force at intervals before, during and after the period of hypercap- nia are recorded in Table 1 . The tracings
commence about 30 rnin before the moment when the carbon dioxide concentration in the bath was changed from 4.67% to 9.79% (the control
point with which all previous and subsequent readings were compared), and during this pre- liminary period all the preparations were in a fairly stable state. No significant alterations in either active force or peak dF/dt were found be- tween controlvalues and readings taken 10,20, and
30 min beforehand. The changes in peak dF/dt
and active force from the control point onwards are shown graphically in Fig. 2 (expressed as
per cent of control). After the introduction of
9.79% CO, into the bath both peak dF/dt and
active force were rapidly reduced and reached minimum values 5 to 10 rnin later, peak dF/dt to 57% of control (P<O-OOl) and active force to 63% of control (P<O.OOl). Having reached
minimum values both parameters then slowly and spontaneously increased until after about 50
min a new level of stability had been attained. During this period of slow increase in active force and peak dF/dt the extracellular CO,
concentration and pH remained steady. At this stage peak dF/dt had increased from 57% to
81% of control (P<O.OOl), and active force
from 63% to 84% of control (P<O.Ol), al-
though at this time both parameters were still below their original control values (P < 0.01). After 60 rnin of hypercapnia 467% CO, was
reintroduced into the bath, and both peak dF/dt and active force rapidly increased by the same amount as they had fallen after the introduction of the high CO, concentration. Combined with the slow compensatory increases which had oc- curred during the period of hypercapnia, this resulted in a marked overshoot of peak dF/dt to
118% and of active force to 120% of control.
Some 50 rnin later both values had returned approximately to control levels.
The mean pH of the bathing solution before the onset of hypercapnia was 7.400 (SD= 0.010). Ten minutes after the introduction of 9.79% CO, into the bath the mean pH was 7.105 (SD=0.017), and after 50 rnin was 7.108
(SD =O-014). After the reintroduction of 4.67%
COz the mean pH was 7-406 (SD=0.013) after
10 rnin and 7.412 (SD = 0.01 5) after 30 min.
At no time during the experiments were any consistent changes in resting force observed. Figure 3 shows a fast record of single contractions
taken before and during hypercapnia in one preparation, and it can be seen that during this period changes in developed force and peak dF/ dt are unaccompanied by any alteration in resting force.
Discussion
The primary effect of a high CO, concentration on the mechanical performance of the myo-
Time from control (min)
9.79% coa 4.67% COz _ _ _ _ _ _ - - - 30 40 50 60 Max 70 80 90 100 110 I20 3.05 3.13 0.88 0.88 <0.01 <0.01 < 0.001 < 0.001 9.8 10.1 2.2 2.2 <0.01 <0.01 < 0.001 < 0.001 3.30 3.39 4.86 4.84 4.56 4.27 4.15 0.89 1.10 1.74 1.67 1.63 1.55 1.59 < O . O l <0.01 <0.02 <0.02 NS NS NS <0.001 40.01 - NS <0.01 i O . 0 1 i 0 . 0 1 10.8 11.1 17.0 16.6 15.3 14.1 13.7 2.4 2.5 4.5 4.6 4.2 3.8 4.0 <0.01 <0.01 i O . 0 1 ( 0 . 0 5 NS NS NS <0.001 <0.001 - <O.Ol <0001 <0.001 <0.001 4.10 4.02 1.54 I .46 NS NS t 0 . 0 1 (0.01 13.4 13.2 3.9 3.7 NS NS <0.001 (0.00
260 Foex and Fordham 140 130 120 110 -ij 100 .I. D < 90 e a 80 70 60 co 5 % 2 cop 10% I
...
::
.
130-
-
-
- --
-
- - 120-
110-
wP
100-
90-
80-
70-
60-
$0..-
,-
I *: 0 10 20 30 40 M 60 10 20 30 40 50 60 t i m e ( m i n )F I G . z a Alterations in artice force duritzg the course of the experiments ( p e r cent of control).
co2 1090 co* 5 0 0 I r...
..
...
150F
;-*
i -... ;..a , ... I""".
! I . a&.=..-
..X:lh4.-.
.-.. ... .$ ...---
2--
-
.
5 0 1::
:.
4 0 I 1 1 I I I I I 1 I 0 10 20 30 40 50 60 10 20 30 40 50 60 t i m e ( m i n )F ic;. 2 b Alterations in peak dF/dt ( p e r cent of control). All points obtained at the indicated time intervals have hreri plorted. The short horizontal lines at each interval represent the means of the individual values.
cardium is one of depression (Nahas, 1957; or even overcompensates, for the depressant McElroy er a/., 1958; Ng et a / . , 1967;Noble effect of CO, (Boniface and Brown, 1953; et ai., 1967; Pannier and Leusen, 1968). In the Nahas and Cavert, 1957; Manley, Nash, and intact animal acute hypercapnia is accompanied Woodbury, 1964). It has also been suggested that by a n increase in sympathetic nervous activity hydrocortisone is able to reverse hypercapnic (Nahas and Steinsland, 1968) which compensates, myocardial depression (Nahas, 1957).
261 Intrinsic myocardial recovery during hypercapnia
In order to demonstrate whether recovery from myocardial depression due to acute hypercapnia is entirely due to outside factors, or whether heart muscle per se is able to play some part in the phenomenon, accurate control of other factors which may influence myocardial per- formance, such as initial fibre length, heart rate, extracellular electrolyte concentrations and sym- pathetic tone, must be achieved. We have been unable to find any published work in which these criteria have been completely satisfied. Young, Monroe, and Craig (1960), working with a standard canine heart-lung preparation, re- ported that the immediate response to a rise in CO, was a fall in cardiac output, but that during longer periods of hypercapnia a considerable spontaneous increase in cardiac output occurred, even though the right atrial filling pressure of the heart remained constant. Although no attempt was made to control the heart rate, they stated that no changes in the ECG occurred during this
time, except for ‘slowing of the heart rate with high CO, mixtures’, suggesting that the spon- taneous increase in output was due to a rise in the stroke volume of the preparation. Nejad and Ogden (1967), recording the changes in left atrial pressure at a constant stroke work during hyper- capnia in the dog heart-lung preparation, found that a steep rise in pressure occurred soon after raising the arterial Pco,, followed by a spontane- ous fall towards control level, again suggesting myocardial recovery from the effects of acute hypercapnia. No attempt was made to control the heart rate, which may itself influence the left atrial pressure.
In OUT preparation rate of contraction, resting muscle length, extracellular electrolyte concentra- tions, and external hormonal and nervous factors were unchanged or absent throughout the ex-
F I G . 3
and dF/dt during prolonged hypercapnia in one prepara- tion. Curve A : normocapnia. Curve B : I0 min after the onset of hypercapnia. Curve C : after 50 min of
hypercapnia. Corresponding changes are seen in the dF/dt tracing. For technical reasons the force curves show some variation in placement on the time scale ( 1 large square =
I00 msec).
Fast tracings of force
periments. Nevertheless, both peak dF/dt and active force showed considerable recovery from the initial period of depression after the onset of hypercapnia. The results indicate that a signifi- cant part of the recovery of myocardial per- formance which occurs during prolonged hyper- capnia can be attributed to a compensatory process arising within the muscle itself.
There is no doubt that, in the intact animal, increased sympathetic activity plays an important r6le in protecting the heart against the detri- mental effects of a high CO, concentration (Morris and Millar, 1962). In our experiments the time course of recovery was slower than has been reported previously under conditions which allowed the sympathetic response to CO, to play its part, and it may be that the sympathetic nervous system has its most important compen- sating r61e early in a period of hypercapnia. Once intrinsic myocardial recovery has been completed, the need for sympathetic aid in maintaining myocardial performance is correspondingly re- duced. It may not, however, be justified to extrapolate the results obtained in our pre- paration to the intact animal as regards the time course of the events we have observed.
The mechanism by which the myocardium is able to reverse the acute effects of CO, are unknown. Some of the many possibilities are:
1. The spontaneous return of intracellular pH towards normal in the face of a continuing extracellular acidosis.
2, Alterations in calcium distribution within the muscle cells or across the cell membrane.
3. The release of intramyocardial noradren-
aline stores, as has been suggested by Smith and Corbascio (1966) during metabolic acidosis.
4. Alterations in the dynamic compliance of the series elastic element.
262 Foex and Fordhani
References
Boniface, K. J., and Brown, J. M. (1953). Effect of carbon dioxide excess on contractile force of heart, in situ. Ameri- can Journal of Physiolog.v, 112, 752-756.
Caress, D. L.. Kissack, A. S., Slovin, A. J., and Stuckey, J. H . (1968). The effect of respiratory and metabolic acidosis on myocardial contractility. Journal of Thoracic and Cardiocascular Surgery, 56, 571-517.
Gersh, B. I., Hahn, C. E. W.. and Prys-Roberts, C. (1971). Physical criteria for measurement of left ventricular pres- sure and its first derivative. Cardiocascular Research, 5 ,
32-40.
McElroy, W. T., Jr., Gerdes, A. J., and Brown, E. B., Jr.
(1958). Effects of CO,, bicarbonate and pH on the per- formance of isolated perfused guinea pig hearts. American Journal of Physiology, 195, 412416.
Manley, E. S . . Jr., Nash, C. B., and Woodbury, R. A. (1964). Cardiovascular responses to severe hypercapnia of short duration. American Joitrnal of Physiology, 201,634-640. Morris. M. E., and Millar, R. A. (1962). Blood pH:plasrna
catecholamine relationships: respiratory acidosis. British Journal of Anaesthesia, 34, 672-681.
Nahas, G. G. (1957). Effect of hydrocortisone on acidotic failure of the isolated heart. Circulation Research, 5 ,
489-492.
Nahas. G. G., and Cavert, H. M. (1957). Cardiac depressant
effect of CO, and its reversal. American Journal of Physio- logy, 190,483-491.
Nahas, G. G., and Steinsland, 0. S. (1968). Increased rate of catecholamine synthesis during respiratory acidosis.
Respiration Physiology, 5 , 108-1 17.
Nejad, N. S., and Ogden, E. (1967). Effect of blood p H and CO, tension on performance of the heart-lung preparation.
Proceedings of the Socieiy of Experimental Biology and Medicine, 126, 771-776.
Ng, M. L., Levy, M. N., and Zieske, H. A. (1967). Effects of changes of pH and of carbon dioxide tension o n left ventricular performance. American Journal of Physiology,
213, 115-120.
Noble, M. I. M.,Trenchard, D., and Guz, A. (1967). Effect of changes in Paco2 and Pao2 o n cardiac performance in conscious dogs. Journal of Applied Physiology, 22, 147-1 52. Pannier, J. L., and Leusen, I. (1968). Contraction charac- teristics of papillary muscle during changes in acid-base composition of the bathing-fluid. Archiues Internationales de Physiologie et de Biochimie, 16, 624-634.
Smith, N. T., and Corbascio, A. N. (1966). Myocardial resistance to metabolic acidosis. Archiues of Surgery, 92,
892-897.
Young, D. T., Monroe, E. W., and Craige, E. (1960). Relationship between cardiac toxicity of K and acute alterations of blood p H and pC0,. American Journal of PhYsiolo~,V, 199, 759-764.