HAL Id: inserm-00123284
https://www.hal.inserm.fr/inserm-00123284
Submitted on 9 Jan 2007HAL is a multi-disciplinary open access
archive for the deposit and dissemination of sci-entific research documents, whether they are pub-lished or not. The documents may come from teaching and research institutions in France or abroad, or from public or private research centers.
L’archive ouverte pluridisciplinaire HAL, est destinée au dépôt et à la diffusion de documents scientifiques de niveau recherche, publiés ou non, émanant des établissements d’enseignement et de recherche français ou étrangers, des laboratoires publics ou privés.
Meat, fish, and colorectal cancer risk: the European
Prospective Investigation into cancer and nutrition.
Teresa Norat, Sheila Bingham, Pietro Ferrari, Nadia Slimani, Mazda Jenab,
Mathieu Mazuir, Kim Overvad, Anja Olsen, Anne Tjønneland, Françoise
Clavel, et al.
To cite this version:
Teresa Norat, Sheila Bingham, Pietro Ferrari, Nadia Slimani, Mazda Jenab, et al.. Meat, fish, and colorectal cancer risk: the European Prospective Investigation into cancer and nutrition.. J Natl Cancer Inst, 2005, 97 (12), pp.906-16. �10.1093/jnci/dji164�. �inserm-00123284�
Meat, Fish, and Colorectal Cancer Risk: The European Prospective
Investigation into Cancer and Nutrition
Teresa Norat, Sheila Bingham, Pietro Ferrari, Nadia Slimani, Mazda Jenab, Mathieu Mazuir, Kim
Overvad, Anja Olsen, Anne Tjønneland, Francoise Clavel, Marie-Christine Boutron-Ruault,
Emmanuelle Kesse, Heiner Boeing, Manuela M.Bergmann, Alexandra Nieters, Jakob Linseisen,
Antonia Trichopoulou, Dimitrios Trichopoulos, Yannis Tountas, Franco Berrino, Domenico Palli,
Salvatore Panico, Rosario Tumino, Paolo Vineis, H. Bas Bueno-de-Mesquita, Petra H. M. Peeters,
Dagrun Engeset, Eiliv Lund, Guri Skeie, Eva Ardanaz , Carlos González, Carmen Navarro, J. Ramón
Quirós, María-José Sanchez, Göran Berglund, Irene Mattisson, Göran Hallmans, Richard Palmqvist,
Nicholas E. Day, Kay-Tee Khaw, Timothy J. Key, Miguel San Joaquin, Bertrand Hémon, Rodolfo
Saracci, Rudolf Kaaks, Elio Riboli.
Background: Current evidence suggests that high red meat intake is associated with increased colorectal cancer risk. High fish intake may be associated with a decreased risk, but the existing evidence is less convincing. Methods: We prospectively followed 478 040 men and women from 10 European countries who were free of cancer at enrollment between 1992 and 1998. Information on diet and lifestyle was collected at baseline. After a mean follow-up of 4.8 years, 1329 incident colorectal cancers were documented. We examined the relationship between intakes of red and processed meat, poultry, and fish and colorectal cancer risk using a proportional hazards model adjusted for age, sex, energy (nonfat and fat sources), height, weight, work-related physical activity, smoking status, dietary fiber and folate, and alcohol consumption, stratified by center. A calibration substudy based on 36 994 subjects was used to correct hazard ratios (HRs) and 95% confidence intervals (CIs) for diet measurement errors. All statistical tests were two-sided. Results: Colorectal cancer risk was positively associated with intake of red and processed meat (highest [>160 g/day] versus lowest [<20 g/day] intake, HR = 1.35, 95% CI = 0.96 to 1.88; Ptrend=.03) and inversely associated with intake of fish (>80 g/day versus <10 g/day,
HR = 0.69, 95 % CI = 0.54 to 0.88; Ptrend<.001), but was not related to poultry intake. Correcting for
measurement error strengthened the associations between colorectal cancer and red and processed meat intake (per 100-g increase HR = 1.25, 95% CI =1.09 to 1.41, Ptrend = .001 and HR = 1.55, 95% CI = 1.19 to 2.02, Ptrend =
.001 before and after calibration, respectively) and forfish (per 100 g increase HR = 0.70, 95% CI = 0.57 to 0.87, Ptrend<.001 and HR = 0.46, 95% CI = 0.27 to 0.77, Ptrend = .003; before and after correction, respectively). In this
study population, the absolute risk of development of colorectal cancer within 10 years for a study subject aged 50 years was 1.71% for the highest category of red meat intake and 1.28% for the lowest category of intake and was 1.86% for subjects in the lowest category of fish intake and 1.28% for subjects in the highest category of fish intake. Conclusions: Our data confirm that colorectal cancer risk is positively associated with high consumption of red and processed meat and support an inverse association with fish intake.
Affiliations of authors: From the Nutrition and Hormones Group, International Agency for Research on Cancer, Lyon, France (TN, PF, NS, MJ, MM,
BH, RS, RK, ER); Medical Research Council Dunn Human Nutrition Unit, Cambridge, U.K. (SB); Department of Clinical Epidemiology, Aalborg Hospital and Aarhus University Hospital, Department of Epidemiology and Social Medicine, University of Aarhus, Denmark (KO); Institute of Cancer Epidemiology, Danish Cancer Society, Copenhagen, Denmark (AO, A. Tjønneland); Institut National de la Santé et de la Recherche Médicale (INSERM) U521, Institut Gustave Roussy, Villejuif, France (FC, MCBR, EK); German Institute of Human Nutrition, Postdam-Rehbücke, Germany (HB, MMB); Division of Clinical Epidemiology, Deutches Krebsforschungszentrum, Heidelberg, Germany (AN, JL); Department of Hygiene and Epidemiology, Medical School, University of Athens, Greece (A. Trichopoulou, DT, YT); Epidemiology Unit, Istituto Tumori, Milan, Italy (FB); Molecular and Nutritional Epidemiology Unit, Cancer Research and Prevention Center, Scientific Institute of Tuscany, Florence, Italy (DP); Department of Clinical and Experimental Medicine, Federico II University, Naples, Italy (SP); Cancer Registry, Azienda Ospedaliera Civile MP, Arezzo, Ragusa, Italy (RT); University of Torino, Italy and Imperial College London, U.K. (PV); Center for Nutrition and Health, National Institute for Public Health and the Environ-ment, Bilthoven, The Netherlands (HBB); Julius Center for Health Sciences and Primary Care, University Medical Center, Utrecht, The Netherlands (PHMP); Institute of Community Medicine, University of Tromso, Norway (DE, EL, GS); Department of Epidemiology, Catalan Institute of Oncology, Barcelona, Spain (CG); Epidemiology Department, Health Council of Murcia, Spain (CN); Public Health Institute of Navarra, Pamplona, Spain (EA); Public Health and Health Planning Directorate, Asturias, Spain (JRQ); Andalusian School of Public Health, Granada, Spain (MJS); Malmö Diet and Cancer Study, Lund University, Malmö, Sweden (GB, IM); Department of Nutritional Research (GH) and Department of Medical Biosciences, Pathology (RP), University of Umeå, Sweden; Strangeways Research Laboratory, U.K. (NED); the Clinical Gerontology Unit, University of Cambridge, United Kingdom (KTK); Cancer Research UK Epidemiology Unit, University of Oxford, UK (TJK, MSJ).
Correspondence to: Elio Riboli, MD, MPH, International Agency for Research on Cancer, 150 Cours Albert Thomas, 69372 Lyon cedex 08, France
(e-mail: riboli@iarc.fr ).
The finding that a high intake of red meat but not of chicken or fish might be associated with increased colon cancer risk was first reported in prospective studies by Willett et al. in 1990 (1), from an analysis of 150 colorectal cancer patients in the Nurses’ Health Study. Later, results from a systematic review of observational and experimental studies (2) and two meta-analyses (3,4) also supported the initial finding. However, the association between colon cancer and red meat consumption was slightly weaker in a longer follow-up of the Nurses’ Health Study (5) than in the previous analysis (1) and, in the combined analysis with the Health Professionals Follow-up Study, a statistically significant trend with processed meat but not with beef, pork, or lamb as a main dish was observed (5). Results from another prospective study of American women showed no evidence of an association between meat and colorectal cancer (6). More recently, results of the Cancer Prevention Study II Nutrition Cohort (7) showed that prolonged high consumption of red and processed meat might be associated with an increased risk of cancer of the distal portion of the large intestine; however, the increase was not statistically significant.
The evidence of an inverse association between colon cancer risk and fish intake is less consistent than the evidence of a positive association with red meat (2). An inverse association has been observed in several prospective studies (1,8–16), but the association was statistically significant in only two of them (12,16). Fish intake was not associated with colorectal cancer risk in the most recently published prospective studies (17–19).
No association with intake of poultry and colon cancer has been observed in almost all of the cohort studies (8–10,12–16) that have examined this relationship. One study reported a significant inverse trend (1).
To examine whether associations exist between intakes of red and processed meat, of poultry, and of fish and colorectal cancer risk, we prospectively followed a large Western European population that includes half a million subjects from 10 European countries: the European Prospective Investigation into Cancer and Nutrition (EPIC) (20). People who eat diets rich in meat also tend to eat less fiber and less fish (21), and a statistically significant inverse association between dietary fiber consumption and colorectal cancer risk in this cohort has been reported elsewhere (22). We therefore also investigated the risk of colorectal cancer with intakes of red and processed meat in individuals with different levels of intake of fish and fiber.
Subjects and Methods Study Cohort
EPIC is a prospective study that was designed to investigate the relationships among diet, lifestyle, genetic and environmental factors, and the incidence of different forms of cancer. The study has been described in detail previously (20,23). EPIC includes 366 521 women and 153 457 men, most aged 35–70 years at enrollment between 1992 and 1998, who were recruited in 23 centers in 10 European countries (Table 1). The study subjects were recruited from the general population and resided in defined areas in each country with some exceptions (women who were members of a health insurance scheme for state school employees in France and women attending breast cancer screening in Utrecht, The Netherlands; components of the Italian and Spanish cohorts included members of local blood donor associations).
A large number of subjects who did not eat meat were enrolled in the Oxford ―Health conscious‖ cohort. Eligible participants gave written informed consent and completed questionnaires on their diet, lifestyle, and medical history. Approval for this study was obtained from the ethical review boards of the International Agency for Research on Cancer and from all local institutions where subjects had been recruited for the EPIC study.
For this analysis, we excluded 22 432 cohort members with prevalent cancer at enrollment other than nonmelanoma skin cancer, 10 208 members who were in the lowest and highest 1% of the distribution of the ratio of reported total energy intake to energy requirement (24), and 9298 members with missing questionnaire data or missing dates of diagnosis or follow-up. The number of subjects included in this analysis was 478 040.
Table 1. Description of the centers participating in the European Prospective Investigation into Cancer and Nutrition (EPIC) Study * Mean (standard error) of daily intake (g/day)
No. of colorectal
cancer patients Person – years Red and processed meat Fish Poultry
Center, country Enrollment age, y Men Women Men Women Men Women Men Women Men Women
Aarhus, Denmark Copenhagen, Denmark France Heidelberg, Germany Potsdam, Germany Greece Florence, Italy Turin, Italy Varese, Italy Naples, Italy Ragusa, Italy Bilthoven, Netherlands Utrecht, Netherlands Norwy Granada, Spain Murcia, Spain Asturias, Spain Navarra, Spain San Sebastian, Spain Malmo, Sweden Umea, Sweden Norfolk, U.K. Oxford, U.K.
Oxford, Health Conscious, U.K.
50 – 65 50 – 65 43 – 68 40 – 65 35 – 65 30 – 76 35 – 65 35 – 65 35 – 72 35 – 68 35 – 65 21 – 64 49 – 70 41 – 56 35 – 65 35 – 65 35 – 65 35 – 64 35 – 65 45 – 73 30 – 60 41 – 76 21 – 83 21 – 83 27 67 — 33 39 13 17 18 6 — 2 13 — — 7 7 11 14 20 94 44 82 8 20 29 54 174 15 27 11 30 4 20 3 1 9 75 20 9 10 11 10 11 100 34 68 14 48 25 807 60 476 — 42 033 49 560 37 985 16 598 18 739 7 586 — 10 268 35 278 — — 9 838 14 117 19 679 25 195 22 676 78 719 90 463 51 031 5 041 50 317 26 720 68 822 436 848 45 772 71 605 54 628 49 991 12 430 42 682 18 332 10 050 41 618 84 003 57 409 30 165 29 926 34 291 26 081 23 782 105 514 92 742 61 102 16 705 166 460 119.2 (0.3) 124.9 (0.2) — 143.2 (0.4) 140.9 (0.4) 64.0 (0.2) 102.4 (0.5) 96.3 (0.3) 99.5 (0.5) — 89.2 (0.4) 141.2 (0.5) — — 127.8 (0.8) 134.3 (0.7) 134.9 (0.5) 147.3 (0.5) 141.3 (0.5) 123.1 (0.2) 121.7 (0.2) 78.8 (0.3) 79.9 (0.6) 24.4 (0.2) 68.9 (0.2) 68.6 (0.1) 76.0 (0.1) 75.2 (0.2) 73.5 (0.2) 34.6 (0.1) 64.1 (0.2) 60.6 (0.3) 64.4 (0.2) 59.8 (0.2) 56.8 (0.3) 81.2 (0.3) 78.8 (0.2) 77.8 (0.1) 65.7 (0.2) 72.0 (0.3) 71.3 (0.2) 79.5 (0.3) 71.1 (0.3) 78.5 (0.1) 77.5 (0.1) 46.2 (0.1) 49.4 (0.2) 14.0 (0.1) 43.9 (0.02) 45.2 (0.1) — 17.0 (0.1) 23.6 (0.1) 52.1 (0.2) 33.2 (0.2) 32.0 (0.2) 31.0 (0.3) — 27.4 (0.2) 17.0 (0.1) — — 96.6 (0.7) 90.3 (0.1) 96.1 (0.5) 91.4 (0.5) 99.9 (0.5) 42.0 (0.1) 33.5 (0.1) 31.7 (0.1) 33.0 (0.1) 13.6 (0.2) 31.3 (0.1) 37.5 (0.1) 39.2 (0.04) 14.0 (0.1) 19.3 (0.1) 31.2 (0.1) 21.0 (0.1) 20.3 (0.1) 19.4 (0.1) 26.5 (0.1) 17.6 (0.1) 11.6 (0.1) 14.0 (0.05) 48.6 (0.1) 60.0 (0.2) 59.5 (0.2) 62.8 (0.2) 59.4 (0.2) 64.7 (0.2) 33.1 (0.05) 25.6 (0.03) 28.7 (0.03) 28.2 (0.05) 12.9 (0.02) 14.5 (0.05) 18.5 (0.04) — 19.4 (0.8) 16.7 (0.8) 15.3 (0.4) 41.0 (0.2) 40.4 (0.1) 39.1 (0.2) — 39.5 (0.2) 19.0 (0.1) — — 33.1 (0.2) 36.3 (0.2) 37.7 (0.2) 38.5 (0.2) 40.0 (0.2) 11.5 (0.04) 7.7 (0.03) 26.4 (0.2) 28.6 (0.4) 10.7 (0.2) 17.8 (0.1) 15.3 (0.05) 24.2 (0.1) 15.8 (0.04) 11.9 (0.03) 12.4 (0.03) 24.5 (0.05) 24.0 (0.1) 23.4 (0.05) 24.0 (0.1) 24.0 (0.1) 13.6 (0.1) 13.2 (0.05) 12.8 (0.03) 25.0 (0.1) 28.5 (0.1) 27.8 (0.1) 28.0 (0.1) 28.6 (0.1) 11.2 (0.02) 8.1 (0.02) 22.2 (0.1) 23.2 (0.2) 9.6 (0.05)
*Enrollment ages are the 1st – 99th percentile. Calibrated mean daily intakes of red meat, fish, and poultry are shown. Center- and sex-specific calibration models were obtained by regression of the main dietaryquestionnaires on the 24-hour diet recall values. Models included energy from nonfat sources, energy from fat sources, weight, height, age at recruitment, day of the week, and season of the year on which the 24-hour diet recall was collected.
Diet and Lifestyle Questionnaires
Diet over the 12 months before enrollment was measured between 1992 and 1998 by country-specifi c validated questionnaires. Most centers adopted a self-administered dietary questionnaire of 88 to 266 food items. In Greece, all centers in Spain, and Ragusa, Italy, the questionnaire was administered at a personal interview. In Malmö, Sweden, a questionnaire method combined with a food record was used. Data on height and weight, alcohol use, smoking status, occupational physical activity, and previous illnesses were also collected. Descriptions of the questionnaires used can be found on websites of the participating cohorts (20). The validity of methods used was estab lished in prior studies using 24-hour urine and blood samples as sources of biomarkers (25).
For this analysis, meats were grouped into red meat, processed meat, and poultry. Red meat included all fresh, minced, and frozen beef, veal, pork, and lamb. Processed meats were mostly pork and beef that were preserved by methods other than freezing, such as salting (with and without nitrites), smoking, marinating, air drying, or heating (i.e., ham, bacon, sausages, blood sausages, meat cuts, ―liver paté, ‖ salami, bologna, tinned meat, luncheon meat, corned beef, and others). Lamb and poultry are rarely processed into these types of meats in Europe. Poultry included all fresh, frozen, and minced chicken, and, in some cohorts, turkey. Fish included fresh, canned, salted, and smoked fish.
Identification of Colorectal Cancer Case Patients
The follow-up was based on population cancer registries, except in France, Germany, and Greece, where a combination of methods, including health insurance records, cancer and pathology registries, and active follow-up of study subjects and their next-of-kin was used. Mortality data were collected from either the cancer or mortality registries at the regional or national level.
Follow-up began at the date of enrollment and ended at either the date of diagnosis of colorectal cancer, death, or last complete follow-up. By October 30, 2002, for the centers using record linkage with cancer registry data, complete follow-up was available until December 31, 1998 (Bilthoven, Naples, Ragusa, and Turin), June 30, 1999 (Aarhus and Copenhagen), December 31, 1999 (Murcia and Varese), December 31, 2000 (Asturias, Granada, Navarra, San Sebastian, Florence, Norfolk, Oxford, Utrecht, and Norway), June 30, 2001 (Umea), December 31, 2001 (Malmö), and for the centers using active follow-up, the last contact dates were July 30, 2002 (France) July 15, 2002 (Greece), September 4, 2002 (Heidelberg), and September 20, 2002 (Postdam). Mortality data were coded using the 10th revi sion of the International Classification of Diseases, Injuries and Causes of Death, and cancer incidence following the International Classification of Diseases for Oncology, 2nd version. We included all incident cases of colon (C18) and rectal cancer. Cancer of the rectum included tumors occurring at the rectosigmoid junction (C19) and at the rectum (C20). Anal canal tumors were excluded. Right colon tumors included tumors of the caecum, appendix, ascending colon, hepatic flexure, transverse colon, and splenic flexure (codes C18.0–18.5 of the International Statistical Classification of Diseases for Oncology, version 2). Left colon tumors included those in the descending and sigmoid colon (C18.6 – 18.7).
Statistical Methods
Analyses were conducted using Cox regression. We tested the proportional hazard assumption for red meat, fish, and poultry intake variables in relation to colorectal cancer using the likelihood ratio test, comparing models with and without product terms for the meat and fish variables and follow-up time (years). Data were stratified by center to control for differences in questionnaire design, follow-up procedures, and other center effects. The five Italian centers were combined for analysis, as were the five Spanish centers. The Norfolk and Oxford general U.K. populations were combined. Age was used as the primary time variable, and sex was included as a covariate. The analysis focused on food groups of meats and fish available in all EPIC cohorts: red meat, processed meat, poultry, and fish (26,27). Dietary intakes were analyzed as continuous variables and in five categories using cut points based on the progressive doubling of intake levels. The same cut points were applied to red meat, processed meat, and fish, with the aim of estimating relative risks for comparable levels of intake. Categorical variables were scored from 1 to 5, according to the interval in which an observation lay. Trend tests were calculated on
these scores. Categorical relative risks were calculated from the hazard ratio.
The results were adjusted for estimated energy intake, which was divided into energy from fat and energy from nonfat sources to control partly for error in estimated intakes of foods. To control for body size and obesity, we adjusted for weight and height. Further adjustment included smoking (never, former, and current smoker), alcohol intake (grams per day), dietary fiber (grams per day), and occupational physical activity (no activity, sedentary, standing, manual, and heavy manual). In some models, meat and fish intakes were adjusted for each other. The results were adjusted for dietary folate and use of multivitamin supplements at baseline in 409 135 control subjects and 1176 case patients for whom infor-mation on dietary folate was available in the dataset. Separate analyses were done for men and women. Analyses of women were adjusted for use of hormonal replacement therapy. No important differences between the sexes emerged, and only the results for both sexes combined are presented in this report. Subsequent analyses were performed after the exclusion of case patients who were diagnosed during the first 2 years of follow-up.
Calibration of the Dietary Data
A second dietary measurement was taken from an 8% random sample of the cohort (36 994 participants) using a very detailed computerized 24-hour diet recall method (28) to calibrate dietary measurements across countries and to correct for systematic over- or underestimation of dietary intakes (29–31). The 24-hour diet recall values of these 36 994 cohort participants were regressed on the main dietary questionnaire values for red and processed meat, poultry, and fish. Zero consumption values in the main dietary questionnaires were excluded in the regression calibration models (5% – 13% of the participants depending on the food variable). Energy from nonfat sources, energy from fat sources, weight, height, age at recruitment, day of the week, and season of the year on which the 24-hour recall was collected were included as covariates. Energy from nonfat sources and from fat sources were calibrated following the same approach. Center- and sex-specific calibration models were used to obtain individual predicted values of dietary exposure for all participants.
Cox regression models were then applied using the predicted values for each individual on a continuous scale. The standard error of the de-attenuated coefficient was calculated with bootstrap sampling in the calibration and disease models, consecutively. The Ptrend values for the de-attenuated
coefficient were calculated by dividing the de-attenuated coefficient by the bootstrap derived standard error and approximating the standard normal distribution (31).
The Wald statistic was used to test for homogeneity of risks of the left-sided and right-sided colon tumors (32). To assess heterogeneity of de-attenuated risk estimates across centers, we included center as main effect and interaction terms in Cox models. Heterogeneity was explored by meta-regression using the Genmod procedure. All analyses were performed using SAS Statistical Software, version 8 (SAS Institute, Cary, NC), and all statistical tests were two-sided. For all analyses, P values <.05 were considered statistically significant.
Results
A total of 478 040 participants contributed 2 279 075 person-years in a mean follow-up of 4.8 years since 1992. During follow-up, 1329 participants were diagnosed with colorectal cancer. Of these cancers, 95% were histologically verified; 855 tumors were located in the colon and 474 in the rectum. The number of colorectal cancer subjects, person-years, and the mean calibrated intakes of meat and fish by center are shown in Table 1 . Baseline characteristics of the participants are also given in Table 2 .
Table 2. Baseline characteristics according to colorectal cancer status at the end of follow-up in the
European Prospective Investigation into Cancer and Nutrition (EPIC) *
Men Women Characteristic Cases (n = 542) Noncases (n = 141 445) Cases (n = 787) Noncases (n = 335 265) Age, y Weight, kg Height, cm Fiber, g/day Folate, μg/day†
Smoking, % in each category † Nonsmokers
Former smokers Smokers
Physical activity at work, % in each category ffi
No work activity Sedentary Standing
Manual, heavy manual
59.6 (7.4) 83.3 (12.6) 174.2 (6.8) 21.8 (8.2) 299 (105) 27 48 24 42 26 16 15 52.2 (10.1) 81.3 (12) 174.8 (7.4) 24.1 (9.4) 318 (116) 33 37 29 23 34 21 19 58.7 (7.9) 67.6 (12.1) 161.8 (6.3) 21.6 (7.5) 300 (129) 57 24 17 50 16 24 6 50.8 (9.8) 66.1 (11.8) 162.3 (6.8) 22.3 (7.7) 296 (129) 56 23 20 30 22 28 7
*Mean (standard deviation) or percentage in each group.
†Folate values from 1176 case patients and 409 135 cohort participants. ffiPercentages do not add to 100% due to missing values.
Increasing red and processed meat intake was statistically significantly associated with increasing risk of colorectal cancer (hazard ratio [HR] for highest versus lowest intake level = 1.57, 95% confidence interval [CI] = 1.13 to 2.17, Ptrend = .001) in analysis adjusted for sex and energy intake (Table 3). This
increase in risk was somewhat reduced after adjustment for other covariates (HR = 1.35, 95% CI = 0.96 to 1.88, Ptrend = .03). The association with cancers of the left side of the colon and the rectum was somewhat
stronger than that with cancers of the right side of the colon, but the difference was not statistically significant (Pheterogeneity = .29). In separate analyses, intake of red meat was positively but not statistically
significantly associated with colorectal cancer (HR for highest versus lowest intake = 1.17, 95% CI = 0.92 to 1.49, Ptrend = .08), whereas intake of processed meat was statistically significantly associated with
increased colorectal cancer risk (HR for highest versus lowest intake = 1.42, 95% CI = 1.09 to 1.86, Ptrend
= .02). The results for red meat were similar for colon and rectum and for right and left side of the colon (Pheterogeneity = .72). Hazard ratios for processed meat intakes were somewhat higher for tumors of the left
side of the colon and tumors of the rectum as compared with tumors of the right side of the colon, but the differences were not statistically significant (Pheterogeneity = .87).
In analyses of subgroups of red meats, colorectal cancer risk was statistically significantly
associated with intake of pork (for highest versus lowest intake, HR = 1.18, 95% CI = 0.95 to
1.48, P
trend= .02) and lamb (HR = 1.22, 95% CI = 0.96 to 1.55, P
trend= .03) but not with beef/veal
(HR = 1.03, 95% CI = 0.86 to 1.24, P
trend= .76). In analyses in which intake of each meat was
mutually adjusted for intake of the other meats, only the trend for increased colorectal cancer risk
with increased pork intake remained statistically significant (P
trend= .03). Intakes of ham (for
highest versus lowest intake, HR = 1.12, 95% CI = 0.90 to 1.37, P
trend= .44), of bacon (HR =
0.96, 95% CI = 0.79 to 1.17, P
trend= .34), and of other processed meats (mainly sausages) (HR =
Table 3. Multivariable hazard ratios of colorectal cancer and 95% confidence intervals for categories of consumption of red meat,
processed meat, poultry, and fish, according to anatomic location for participants inthe European Prospective Investigation into Cancer and Nutrition (EPIC)
Colon cancer† Food group, g/day Nffi Colorectal cancer*
(N = 1329) Colorectal cancer† (N = 1329) All colon (N = 855) Right-side (N = 351) Left-side (N = 391)
Rectal cancer: right side (N = 474) Red and processed meat
< 20 20-40 40-80 80-160 ≥160 Ptrend Red meat < 10 10-20 20-40 40-80 ≥80 Ptrend Processed meat < 10 10-20 20-40 40-80 ≥80 Ptrend Fish < 10 10-20 20-40 40-80 ≥80 Ptrend Poultry < 5 5-10 20-20 20-40 ≥40 Ptrend 90 133 466 524 116 132 138 323 486 250 232 256 402 318 121 247 233 428 303 118 368 216 319 235 191 1 (referent) 1.04 (0.79 to 1.38) 1.33 (1.04 to 1.71) 1.39 (1.07 to 1.80) 1.57 (1.13 to 2.17) .001 1 (referent) 1.04 (0.81 to 1.33) 1.09 (0.88 to 1.35) 1.24 (1.01 to 1.54) 1.28 (1.1 to 1.64) .008 1 (referent) 1.15 (0.95 to 1.38) 1.19 (1.00 to 1.43) 1.23 (1.01 to 1.50) 1.54 (1.18 to 2.02) .005 1 (referent) 0.90 (0.75 to 1.08) 0.88 (0.74 to 1.05) 0.70 (0.57 to 0.84) 0.71 (0.55 to 0.91) <.001 1 (referent) 0.92 (0.77 to 1.10) 0.90 (0.77 to 1.06) 0.87 (0.73 to 1.04) 0.94 (0.78 to 1.15) .29 1 (referent) 0.98 (0.74 to 1.30) 1.22 (0.95 to 1.56) 1.23 (0.94 to 1.60) 1.35 (0.96 to 1.88) .03 1 (referent) 1.00 (0.78 to 1.28) 1.03 (0.83 to 1.28) 1.16 (0.94 to 1.43) 1.17 (0.92 to 1.49) .08 1 (referent) 1.10 (0.91 to 1.32) 1.12 (0.94 to 1.35) 1.14 (0.94 to 1.40) 1.42 (1.09 to 1.86) .02 1 (referent) 0.88 (0.74 to 1.06) 0.86 (0.72 to 1.02) 0.67 (0.56 to 0.82) 0.69 (0.54 to 0.88) <.001 1 (referent) 0.90 (0.75 to 1.08) 0.88 (0.75 to 1.03) 0.85 (0.71 to 1.01) 0.92 (0.76 to 1.12) .18 1 (referent) 0.98 (0.70 to 1.37) 1.05 (0.78 to 1.42) 1.17 (0.86 to 1.60) 1.17 (0.78 to 1.77) .15 1 (referent) 1.04 (0.77 to 1.41) 1.02 (0.78 to 1.32) 1.16 (0.90 to 1.51) 1.20 (0.88 to 1.61) .14 1 (referent) 1.08 (0.86 to 1.36) 1.06 (0.85 to 1.32) 1.21 (0.95 to 1.54) 1.30 (0.92 to 1.84) .12 1 (referent) 0.94 (0.74 to 1.18) 0.89 (0.72 to 1.11) 0.69 (0.54 to 0.88) 0.82 (0.60 to 1.11) .01 1 (referent) 0.92 (0.74 to 1.14) 0.83 (0.67 to 1.01) 0.86 (0.69 to 1.07) 0.89 (0.70 to 1.13) .19 1 (referent) 0.89 (0.55 to 1.45) 0.99 (0.64 to 1.51) 1.09 (0.70 to 1.72) 1.03 (0.56 to 1.91) .47 1 (referent) 1.13 (0.70 to 1.84) 1.00 (0.65 to 1.54) 1.36 (0.90 to 2.07) 1.18 (0.73 to 1.91) .22 1 (referent) 1.04 (0.73 to 1.49) 0.95 (0.67 to 1.34) 1.17 (0.80 to 1.70) 1.19 (0.70 to 2.01) .45 1 (referent) 0.97 (0.69 to 1.38) 0.76 (0.54 to 1.08) 0.83 (0.57 to 1.20) 0.85 (0.53 to 1.37) .30 1 (referent) 0.83 (0.59 to 1.16) 0.72 (0.52 to 0.99) 0.87 (0.62 to 1.21) 0.78 (0.53 to 1.16) .21 1 (referent) 1.34 (0.75 to 2.39) 1.34 (0.79 to 2.29) 1.55 (0.89 to 2.69) 1.51 (0.76 to 3.02) .14 1 (referent) 1.07 (0.68 to 1.68) 1.10 (0.65 to 1.63) 1.11 (0.75 to 1.64) 1.24 (0.80 to 1.94) .38 1 (referent) 1.30 (0.92 to 1.83) 1.32 (0.94 to 1.85) 1.45 (1.00 to 2.11) 1.48 (0.87 to 2.53) .08 1 (referent) 0.81 (0.57 to 1.14) 0.96 (0.70 to 1.31) 0.61 (0.42 to 0.88) 0.70 (0.44 to 1.11) .02 1 (referent) 1.00 (0.72 to 1.38) 0.88 (0.65 to 1.18) 0.85 (0.61 to 1.18) 0.87 (0.60 to 1.25) 27 1 (referent) 0.97 (0.57 to 1.64) 1.66 (1.06 to 2.62) 1.40 (0.87 to 2.25) 1.75 (0.98 to 3.10) .06 1 (referent) 0.93 (0.60 to 1.44) 1.07 (0.74 to 1.55) 1.16 (0.80 to 1.66) 1.13 (0.74 to 1.71) .32 1 (referent) 1.13 (0.81 to 1.58) 1.27 (0.93 to 1.74) 1.05 (0.74 to 1.50) 1.62 (1.04 to 2.50) .20 1 (referent) 0.80 (0.59 to 1.09) 0.80 (0.60 to 1.06) 0.64 (0.47 to 0.88) 0.49 (0.32 to 0.76) <.001 1 (referent) 0.87 (0.64 to 1.18) 0.97 (0.75 to 1.27) 0.83 (0.62 to 1.12) 0.99 (0.71 to 1.37) .65 * Cox regression using age, sex, energy from nonfat sources (continuous variable), energy from fat sources (continuous variable), and stratified for center.
† Cox regression using age, sex, energy from nonfat sources (continuous variable), energy from fat sources (continuous variable), height (tertiles defined for each sex and center), weight (tertiles defined for each sex andcenter), occupational physical activity (no activity, sedentary, standing, manual, or heavy manual), smoking status (never, former, or current smoker), dietary fiber (g/day), alcohol intake (g/day), and stratified for center.
Intake of fish was statistically significantly inversely associated with colorectal cancer risk (for highest versus lowest intake HR = 0.69, 95% CI = 0.54 to 0.88, Ptrend<.001). The trend for an inverse
association was statistically significant for cancers of the left side of the colon (Ptrend = .02) and the
rectum (Ptrend<.001), but not for cancers of the right side of the colon (Table 3). Intake of poultry was
not statistically significantly associated with colorectal cancer risk. The inverse association with fish and the positive association with red and processed meat intake persisted when fi sh, poultry, and red and processed meat were all included as continuous variables in the same model (Ptrend<.001 for fish and
Ptrend = .02 for red and processed meat). In this study population, the absolute risk of developing
colorectal cancer within 10 years for a study subject aged 50 years was 1.71% for the highest category of red meat intake and 1.28% for the lowest category of intake, was 1.86% for subjects in the lowest category of fish intake, and was 1.28% for subjects in the highest category of fish intake.
When we adjusted for dietary folate intake in a subset of the cohort including only participants for whom the information on folate intake was available in the core dataset (1176 colorectal cancer case patients and 407 959 participants free of colorectal cancer), the results were not substantially modified. For this subset, the hazard ratio for the highest intake of red and processed meat versus lowest intake was 1.27 (Ptrend = .12) before adjustment for folate and 1.25
(Ptrend = .15) after adjustment. For the highest ver-sus the lowest intake of fish, the hazard ratios
were 0.68 (Ptrend<.001) before and 0.67 (Ptrend<.001) after adjustment for folate.
We tested the consistency of these results after the exclusion of the case patients diagnosed during the first 2 years of followup, because these case patients might have modified their diet during the prediagnostic disease phase that preceded enrollment. The hazard ratios for the group with the highest consumption of red and processed meat were 1.35 (0.95% CI = 0.96 to 1.88) before and 1.35 (95% CI = 0.90 to 2.03) after exclusion (1329 and 861 colorectal cancer case patients, respectively); for fi sh the hazard ratios were 0.69 before and 0.70 after the exclusions.
Calibration of the data for systematic and random dietary intake measurement errors strengthened the observed associations between red and processed meat and fish intake and colorectal cancer risk. The multivariable hazard ratio per 100-g increase in intake of red and processed meat was 1.25 (95% CI = 1.09 to 1.41, Ptrend = .001) before calibration and 1.55 (95% CI = 1.19 to 2.02, Ptrend =
.001) after calibration. In corrected models, the association between intake of processed meat and colon cancer risk (HR per 100-g increase =1.68, 95% CI = 0.87 to 3.27) was stronger than the association between intake of red meat (HR = 1.36, 95% CI = 0.74 to 2.50), but neither association was statistically significant. The corrected estimates for rectal cancer were similar to those for colon cancer (Table 4). The hazard ratios per 100-g increase in fish intake were 0.70 (95% CI = 0.57 to 0.87, Ptrend<.001) and
0.46 (95% CI = 0.27 to 0.77, Ptrend = .003) before and after correction. The association was statistically
significant and similar for both colon and rectal cancers. Uncorrected and corrected hazard ratios across all ranges of red and processed meat and fish consumed are shown (Fig. 1).
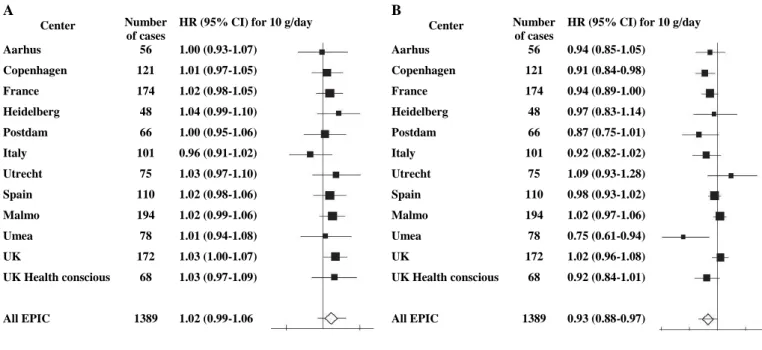
Calibrated hazard ratios were estimated for each center with more than 50 colorectal cancer case patients ( Fig. 2 ). The association of red and processed meat intake with colorectal cancer was consistent across centers (Pheterogeneity = .82). However, the association with fish intake was not consistent
across centers (Pheterogeneity = .03). In meta-regression analyses, none of the following variables
independently explained the heterogeneity: geographic region (Nordic countries, United Kingdom, Central Europe, or South of Europe), mean fish intake in each cohort (27), and proportion of consumed fish that was grilled, fried, or barbecued, as estimated from 24-hour dietary recall (33). In addition, when mean fatty fish intake from 24-hour dietary recall (27) was included in the models instead of mean total fish intake, the results were unchanged.
Table 4. Multivariable hazard ratios (HRs, per 100 g) and 95 % confidence intervals (CIs) of
colorectal cancer for observed and calibrated intakes of red meat, processed meat, fish, and poultry by anatomic location for participants in the European Prospective Investigation into Cancer and Nutrition (EPIC)
Observed Calibrated
Food group Cancer site HR (95% CI), per 100 g Ptrend HR (95% CI), per 100 g Ptrend
Red and processed meat
Red meat Processed meat Fish Poultry Colorectum Colon Rectum Colorectum Colon Rectum Colorectum Colon Rectum Colorectum Colon Rectum Colorectum Colon Rectum 1.25 (1.09 to 1.41) 1.26 (1.07 to 1.48) 1.22 (0.99 to 1.51) 1.21 (1.02 to 1.43) 1.20 (0.96 to 1.48) 1.23 (0.94 to 1.62) 1.32 (1.07 to 1.63) 1.39 (1.06 to 1.82) 1.22 (0.87 to 1.71) 0.70 (0.57 to 0.87) 0.76 (0.59 to 0.99) 0.61 (0.43 to 0.87) 0.92 (0.68 to 1.25) 0.92 (0.63 to 1.35) 0.92 (0.56 to 1.53) .001 .006 .06 .03 .10 .14 .009 .01 .25 <.001 .04 .006 .61 .68 .77 1.55 (1.19 to 2.02) 1.49 (1.03 to 2.16) 1.65 (1.05 to 2.62) 1.49 (0.91 to 2.43) 1.36 (0.74 to 2.50) 1.75 (0.93 to 3.30) 1.70 (1.05 to 2.76) 1.68 (0.87 to 3.27) 1.70 (0.83 to 3.47) 0.46 (0.27 to 0.77) 0.49 (0.26 to 0.93) 0.41 (0.17 to 0.97) 0.85 (0.43 to 1.70) 0.76 (0.29 to 2.03) 1.04 (0.34 to 3.23) .001 .04 .03 .11 .32 .08 .03 .12 .14 .003 .03 .04 .65 .59 .94
*Cox regression with age as primary time variable. Covariates are sex, energy from fat, energy from -nonfat sources except alcohol, height (tertiles defined by sex and center), weight (tertiles defined by sex and center), current alcohol intake (g/day), occupational physical activity, smoking status (never, former, or current smoker), and fiber intake. Stratification by center.
Fig. 1. Hazard ratios of colorectal cancer in the European Prospective Investigation into Cancer and Nutrition cohort. Hazard ratios by A) intake of red and processed meat and B) by intake of fish. Hazard ratios were calculated from Cox regression models adjusted for age, sex, energy from nonfat sources (continuous variable), energy from fat sources (continuous variable), height (tertiles defined for each sex and center), weight (tertiles defined for each sex and center), work-related physical activity (no activity, sedentary, standing, manual, or heavy manual) smoking status (never, former, or current smoker), alcohol consumption (grams per day) and stratified for center. Points in the figure represent median intakes in each category of consumption. Curves generated from calibrated data (solid line) and uncalibrated data (hatched line) and upper and lower confidence intervals for calibrated data (dotted lines) are shown.
1 1,4 1,8 2,2 2,6 3 0 50 100 150 200 g/day H a z a r d R a ti o 0,2 0,4 0,6 0,8 1,0 0 20 40 60 80 100 g/day H a z a r d R a ti o
A
B
A
Center Number
of cases
HR (95% CI) for 10 g/day B Center Number
of cases
HR (95% CI) for 10 g/day Aarhus Copenhagen France Heidelberg Postdam Italy Utrecht Spain Malmo Umea UK UK Health conscious All EPIC 56 121 174 48 66 101 75 110 194 78 172 68 1389 1.00 (0.93-1.07) 1.01 (0.97-1.05) 1.02 (0.98-1.05) 1.04 (0.99-1.10) 1.00 (0.95-1.06) 0.96 (0.91-1.02) 1.03 (0.97-1.10) 1.02 (0.98-1.06) 1.02 (0.99-1.06) 1.01 (0.94-1.08) 1.03 (1.00-1.07) 1.03 (0.97-1.09) 1.02 (0.99-1.06 Aarhus Copenhagen France Heidelberg Postdam Italy Utrecht Spain Malmo Umea UK UK Health conscious All EPIC 56 121 174 48 66 101 75 110 194 78 172 68 1389 0.94 (0.85-1.05) 0.91 (0.84-0.98) 0.94 (0.89-1.00) 0.97 (0.83-1.14) 0.87 (0.75-1.01) 0.92 (0.82-1.02) 1.09 (0.93-1.28) 0.98 (0.93-1.02) 1.02 (0.97-1.06) 0.75 (0.61-0.94) 1.02 (0.96-1.08) 0.92 (0.84-1.01) 0.93 (0.88-0.97)
Fig. 2. Multivariable hazard ratios and 95% confidence intervals from calibrated analyses of colorectal cancer for individual center in the European Prospective Investigation into Cancer and Nutrition (EPIC) cohort. Hazard ratios (HRs) per 100-g increase in intake and 95% confidence intervals (CIs) were calculated for calibrated intakes of A) red and processed meat and B) fish. Hazard ratios were calculated from β coefficients from Cox regression models adjusted for age, sex, energy from nonfat sources (continuous variable), energy from fat sources (continuous variable), height (tertiles defined for each sex and center), weight (tertiles defined for each sex and center), work-related physical activity (no activity, sedentary, standing, manual, or heavy manual) smoking status (never, former, or current smoker), fiber intake (grams per day) and alcohol consumption (grams of day). Centers with fewer than 50 case patients with colorectal cancer are not included . The black squares and horizontal lines correspond to the center-specific hazard ratios (per 100-g increase in intake) and 95% confidence intervals. The area of the square refl ects the center-specific statistical weight (inverse of the variance). The diamond and horizontal lines represent the hazard ratio and 95% confidence intervals in EPIC.
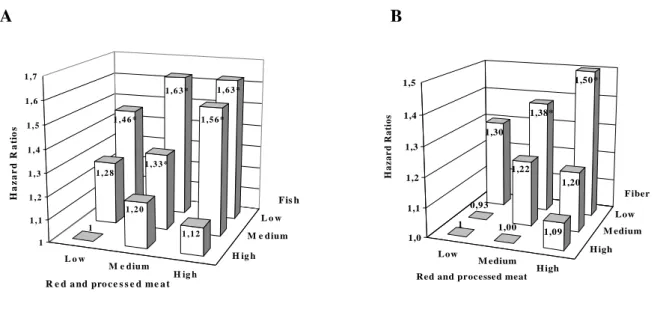
To examine whether the displacement of red and processed meat intake by fish could partially explain the inverse association of fish intake with colorectal cancer risk, we conducted cross-clas-sified analyses by sex-defined tertiles of fish and red and processed meat intake (Spearman correlation coefficient r, between intake levels of fish and red and processed meat after adjustment for age, sex, center, energy intake, height, and weight = .04 in men and .07 in women). No interaction between fish and meat was ob served (Pinteraction = .82). The risk increase associated with high consumption of red
and processed meat versus low consumption (>129 g/day in men and >85 g/day in women versus <30 g/day in men and <13 g/day in women) was 12%–20%, independent of the levels of fish consumption (Fig. 3). The risk increase associated with low versus high fish consumption (<14 g/day in both men and women versus >50 g/day in men and women) was approximately 40%, independent of the levels of red and processed meat intake. Subjects with high red meat and low fish intake were at 63% increased risk of colorectal cancer (HR = 1.63, 95% CI = 1.22 to 2.16), compared with subjects with low red meat and high fish intake.
Fig. 3. Multivariable hazard ratios for colorectal cancer in the European Prospective Investigation into Cancer and Nutrition Cohort. Hazard ratios for intakes of A) red and processed meat and fish and B) red and processed meat and fiber. Multivariable analysis was performed using Cox regression models adjusted for age, sex, energy from nonfat sources (continuous variable), energy from fat sources (continuous variable), height (tertiles defined for each sex and center), weight (tertiles defined for each sex and center), work-related physical activity (no activity, sedentary, standing, manual, or heavy manual) smoking status (never, former, or current smoker), alcohol consumption (grams per day) and stratified by center. Low, medium, and high represent sex-specific tertiles. For red meat intake, low was less than 30 g/day of red and processed meat in men and less than 13 g/day in women, medium was 30–129 g/day in men and 13 to 85 g/day in women, and high was more than 129 g/day in men and 85 g/day in women. Cut points for fish intake were the same for men and women, with low being less than 14 g/day, medium being 14–50 g/day, and high being more than 50 g/day. For fiber intake, low was less than 17 g/day in men and women, medium was 17–28 g/day in men and 17–26 g/day in women, and high was more than 28 g/day in men and 26 g/day in women. * P <.05 relative to the group of subjects with low red and processed meat and high fish intake (A) or high fiber intake (B).
We also used cross-classified analysis to investigate whether low fiber intake could partially explain the increase in colorectal cancer risk in high consumers of red and processed meat (Spearman correlation coeffi cient between fiber and red and processed meat after adjustment for age, sex, center, energy intake, height, and weight = −.18 in men and −.21 in women). The increase in colorectal cancer risk associated with high intake of red and processed meat was more apparent in the group of par-ticipants in the categories of low (<17 g/day) and medium (17 to 26 g/day in women and 17 to 28 g/day in men) fiber intake than in the high (>26 g/day in women and >28 g/day in men) intake group (Pinteraction
= .06). The hazard ratio in the cohort participants with high intake of red and processed meat was 1.09 (95% CI = 0.83 to 1.42) for the group with high intake of fi ber, 1.20 (95% CI = 0.93 to 1.56) for the group with medium intake of fiber, and 1.50 (95% CI = 1.15 to 1.97) for the group with low intake of fiber compared with the group with low intake of red and processed meat and high intake of fi ber. A significant risk increase was also observed for the group of subjects with low intake of fiber and medium intake of red and processed meat (HR= 1.38, 95% CI = 1.06 to 1.80) compared with the group with high intake of fiber and low intake of red and processed meat. The risk reduction associated with high fiber intake was of similar magnitude in all categories of intake of red and processed meat.
Discussion
The results reported here are from one of the largest cohorts of men and women that has been developed specifically to examine the relationship between diet and cancer. We found a consistent positive association between high intake of red and processed meat and colorectal cancer and an inverse association between high intake of fish and colorectal cancer. These findings held in models adjusted for age, sex, and energy and in models adjusted for other covariates.
In this study population, the absolute risk of developing colorectal cancer within 10 years for a study subject aged 50 years was 1.71% for the highest category of red meat intake and 1.28% for the lowest category of intake; risk was 1.86% for subjects in the lowest category of fish intake and 1.28% for subjects in the highest category of fish intake. We found that the associations of red meat and fish
L o w M e d iu m H ig h L o w M e d iu m H ig h 1 , 4 6 * 1 , 6 3 * 1 , 6 3 * 1 , 2 8 1 , 3 3 * 1 , 5 6 * 1 1 , 2 0 1 , 1 2 1 1 , 1 1 , 2 1 , 3 1 , 4 1 , 5 1 , 6 1 , 7 H a z a r d R a ti o s R e d a nd pro c e s s e d me a t Fis h Low M edium H igh Low M edium H igh 1,30 1,38* 1,50* 0,93 1,22 1,20 1 1,00 1,09 1,0 1,1 1,2 1,3 1,4 1,5 H a z a r d R a ti o s
Red and processed meat
F iber
intake with cancer risk were stronger for tumors of the rectum and left side of the colon than for right-sided colon tumors, although differences were not statistically significant. The opposing associations of red meat and fi sh intake were not explained by the displacement of one by the other, be-cause the associations did not disappear when fish and red meat were mutually adjusted for each other. Colorectal cancer risk was not associated with poultry intake.
The mechanisms underlying the association between colorectal cancer risk and high intake of red and processed meat are uncertain. Controlled human intervention studies have raised the possibility that the endogenous nitrosation that arises from ingestion of heme iron but not of inorganic iron or protein may account for the increased risk associated with red and processed meat consumption (34,35). Heterocyclic amines (HCAs) and polycyclic aromatic hydrocarbons (PAH) in diet may pose a potential risk of cancer to humans (36), depending on the extent to which the compounds are activated in vivo by metabolic enzymes. HCAs are formed as a byproduct of reactions during the cooking of meat, poultry, and fish at high temperatures, such as pan-frying or grilling with charcoal or on a gas grill; PAHs are formed in grilled and barbecued meat and in cured, processed foods (36). The results of studies of the association of polymorphisms of genes encoding for enzymes associated with the metabolism and disposition of HCAs and PAHs and risk of colorectal cancer are inconsistent (37–41). Information on cooking methods to estimate dietary exposure to HCAs and PAHs produced from pyrolysis of meat and fish was not systematically collected in the baseline EPIC dietary questionnaires. However, this information was systematically collected in the 24-hour diet recall study. Chicken is a major contributor to HCA intake, but we observed no association between poultry intake and colorectal cancer risk in this study. Furthermore, although analyses of the 24-hour recall data showed a high variation in meat and fish cooking practices across cohorts participating in EPIC (33), we did not observe heterogeneity of association of colorectal cancer risk with red meat intake across the centers (Fig. 2).
It has been suggested that processed meat intake has a stronger association with colorectal cancer than red meat intake (3,7). Indeed, in this European study, we found that the overall association with colorectal cancer risk was stronger for processed than for unprocessed red meat. However, we could not determine whether one particular type of either red meat or processed meat was more strongly associated with colorectal cancer risk than others. In Europe, processed meat is a mixed category of mainly pork and beef meats that are preserved by mechanical, chemical, or enzymatic procedures. The methods of preparing processed meat vary across Europe and have changed over time. Common ingredients used in processed meats are salt, phosphates, nitrite, nitrate, water, sugar, fat, and spices (26). To our knowledge, there are no clearly demonstrated biologic mechanisms that could explain why the observed association of colorectal cancer risk with processed meat might be stronger than that with unprocessed red meat. Nitrites or nitrates added to meat for preservation could increase exogenous exposure to nitrosamines, other N - nitrosocompounds, and their precursors, but not all processed meats contain added nitrites — for example, most sausages andair-dried hams do not.
All of the red and virtually all of the processed meat studied here would have contained greater amounts of heme, which is known to stimulate production of endogenous N -nitroso compounds in the human gastrointestinal system (34), than poultry, which contains much lower amounts of heme and does not stimulate endogenous N -nitroso compound formation (35). Endogenous N -nitrosation, arising from ingestion of heme, may account for the increased risk of colorectal cancer associated with high consumption of red meat and the lack of association with intake
of poultry.
The trend in the association between increased fish consumption and decreased colorectal cancer risk was highly statistically significant (P trend<.001). Results from animal and in vitro studies
indicate that n−3 fatty acids, especially the long-chain polyunsaturated fatty acids eicosapentaenoic and docosahexaenoic acids, which are present in fatty cold-water fish and fish oils, inhibit carcinogenesis (42). However, we were unable to differentiate between intakes of fatty fish, which contains the majority of n–3 fatty acids and other fish. Furthermore, heterogeneity was encountered among the different cohorts, and it is not clear whether this heterogeneity could be explained by unaccounted for differences in the fat content of fish (27), in cooking practices across EPIC cohorts (33), or by the small numbers of case patients in some centers.
Our study has several limitations. Most important, methods used in nutritional epidemiology are known to provide imprecise estimates of food intake. Random measurement errors of food intake lead to the attenuation of the disease risk estimates (43). We attempted to correct for this error by adjusting
for total energy intake and body weight, because adjustment for self-reported total energy intake is thought to partially correct for measurement error (44). Body weight was also included because it has been suggested to be a better measure of real, unmeasured energy intake than energy intake derived from dietary questionnaires (45). Furthermore, as a novel procedure to correct the relative risk estimates for de-attenuation, we calibrated the dietary questionnaires using a more detailed reference method, the 24-hour diet recall, under the assumption that a single 24-hour recall provides unbiased estimates of dietary intake at a group level. This choice maximizes the statistical power for adjusting relative risk estimates, but it does not permit the correction of hazard ratios associated with quantiles of intakes (43). The method of calibration that we used assumes that there are no correlations of errors produced by the reference method (24-hour diet recall) and the dietary questionnaire (46,47). In practice, however, there is evidence that the individual errors of dietary measurements obtained with dietary questionnaires and 24-hour diet recalls tend to be positively correlated (48); such correlation would lead to an underestimation of the de-attenuation factor and therefore would bias the hazard ratio estimates toward the null value of 1.
The assumption that the more detailed reference method provides unbiased estimates of dietary intake at a group level was tested using biomarkers of intake in a validation study involving 1103 volunteers of both sexes from 12 centers participating in EPIC (49). Group mean nitrogen intakes obtained with the 24-hour diet recalls, used as the reference for calibration, were compared against mean 24-hour urinary nitrogen, a quantitative marker of protein intake. The sex-adjusted partial Pearson’s correlation coefficient between urinary and dietary nitrogen at the mean group level was .84 (.90 after exclusion of outliers), and the calculated β regression coefficients were not statistically significantly different from 1, suggesting that, overall, systematic bias across centers was modest and of uniform magnitude. Nevertheless, because calibration adjusts only partially for measurement error, the almost two-fold increase in colorectal cancer risk for the highest versus lowest daily intake of red and processed meat, estimated after the calibration (Fig.1), should still be considered a conservative estimate of the real underlying association.
It has been recently estimated that approximately 70% of colorectal cancer could be avoided by changes in lifestyle in Western countries (50). Risk factors included in this recent estimate were obesity, physical inactivity, high alcohol consumption, early adulthood cigarette smoking, high red meat consumption, and low intake of folic acid. The investigation of the combined association of these factors with colorectal cancer risk is ongoing in EPIC. Our results published here support the hypothesis that colorectal cancer risk is positively associated with high consumption of red and processed meat and inversely associated with the intake of fish and confirm in a larger number of case patients our previous results (22) of a significant inverse association between intake of fiber and colorectal cancer risk.
References
(1) Willett WC, Stampfer MJ, Colditz GA, Rosner BA, Speizer FE. Relation of meat, fat, and fiber intake to
the risk of colon cancer in a prospective study among women. N Engl J Med 1990 ; 323 : 1664 – 72.
(2) WCRF-AICR. Food, nutrition and the prevention of cancer: a global perspective. Washington DC:
American Institute for Cancer Research, 1997.
(3) Norat T, Lukanova A, Ferrari P, Riboli E. Meat consumption and colorectal cancer risk: dose-response
meta-analysis of epidemiological studies. Int J Cancer 2002 ; 98 : 241 – 56.
(4) Sandhu MS, White IR, McPherson K. Systematic review of the prospective cohort studies on meat
consumption and colorectal cancer risk: a metaanalyticalapproach. Cancer Epidemiol Biomarkers Prev 2001 ; 10 : 439 – 46.
(5) Wei EK, Giovannucci E, Wu K, Rosner B, Fuchs CS, Willett WC, et al. Comparison of risk factors for
colon and rectal cancer. Int J Cancer 2004 ; 108 : 433 – 42.
(6) Flood A, Velie EM, Sinha R, Chaterjee N, Lacey JV Jr, Schairer C, et al. Meat, fat, and their subtypes as
risk factors for colorectal cancer in a prospective cohort of women. Am J Epidemiol 2003 ; 158 : 59 – 68.
(7) Chao A, Thun MJ, Connell CJ, McCullough ML, Jacobs EJ, Flanders WD, et al. Meat consumption and
risk of colorectal cancer. JAMA 2005 ; 293 : 172 – 82.
(8) Giovannucci E, Rimm EB, Stampfer MJ, Colditz GA, Ascherio A, Willett WC. Intake of fat, meat, and
fiber in relation to risk of colon cancer in men. Cancer Res 1994 ; 54 : 2390 – 7.
(9) Bostick RM, Potter JD, Kushi LH, Sellers TA, Steinmetz KA, McKenzie DR, et al. Sugar, meat, and fat
intake, and non-dietary risk factors for colon cancer incidence in Iowa women (United States). Cancer Causes Control 1994 ; 5 : 38 – 52.
(10) Goldbohm RA, van den Brandt PA, van’t Veer P, Brants HA, Dorant E, Sturmans F, et al. A prospective
cohort study on the relation between meat consumption and the risk of colon cancer. Cancer Res 1994 ; 54 : 718 – 23.
(11) Gaard M, Tretli S, Loken EB. Dietary factors and risk of colon cancer: a prospective study of 50,535
young Norwegian men and women. Eur J Cancer Prev 1996 ; 5 : 445 – 54.
(12) Kato I, Akhmedkhanov A, Koenig K, Toniolo PG, Shore RE, Riboli E. Prospective study of diet and
female colorectal cancer: the New York University Women’s Health Study. Nutr Cancer 1997 ; 28 : 276 – 81.
(13) Pietinen P, Malila N, Virtanen M, Hartman TJ, Tangrea JA, Albanes D, et al. Diet and risk of colorectal
cancer in a cohort of Finnish men. Cancer Causes Control 1999 ; 10 : 387 – 96.
(14) Singh PN, Fraser GE. Dietary risk factors for colon cancer in a low-risk population. Am J Epidemiol
1998 ; 148 : 761 – 74.
(15) Hsing AW, McLaughlin JK, Chow WH, Schuman LM, Co CH, Gridley G, et al. Risk factors for
colorectal cancer in a prospective study among U.S. white men. Int J Cancer 1998 ; 77 : 549 – 553.
(16) Tiemersma EW, Kampman E, Bueno de Mesquita HB, Bunschoten A, van Schothorst EM, Kok FJ, et al.
Meat consumption, cigarette smoking, and genetic susceptibility in the etiology of colorectal cancer: results from a Dutch prospective study. Cancer Causes Control 2002 ; 13 : 383 – 93.
(17) Kobayashi M, Tsubono Y, Otani T, Hanaoka T, Sobue T, Tsugane S; JPHC Study Group. Fish,
long-chain n-3 polyunsaturated fatty acids, and risk of colorectal cancer in middle-aged Japanese: the JPHC study. Nutr Cancer 2004 ; 49 : 32 – 40.
(18) English DR, MacInnis RJ, Hodge AM, Hopper JL, Haydon AM, Giles GG. Red meat, chicken, and fish
consumption and risk of colorectal cancer. Cancer Epidemiol Biomarkers Prev 2004 ; 13 : 1509 – 14.
(19) Larsson SC, Rafter J, Holmberg L, Bergkvist L, Wolk A. Red meat consumption and risk of cancers of
the proximal colon, distal colon and rectum: the Swedish Mammography Cohort. Int J Cancer 2005 ; 113 : 829 – 34.
(20) Bingham S, Riboli E. Diet and cancer — the European Prospective Investigation into Cancer and
Nutrition. Nat Rev Cancer 2004 ; 4 : 206 – 15.
(21) Two studies find high-fiber diet lowers colon cancer risk. CA Cancer J Clin 2003 ; 53 : 201 – 2.
(22) Bingham SA, Day NE, Luben R, Ferrari P, Slimani N, Norat T, et al. Dietary fibre in food and protection
against colorectal cancer in the European Prospective Investigation into Cancer and Nutrition (EPIC): an observational study. Lancet 2003 ; 361 : 1496 – 501.
(23) Riboli E, Hunt KJ, Slimani N, Ferrari P, Norat T, Fahey M, et al. European Prospective Investigation into
Cancer and Nutrition (EPIC): study populations and data collection. Public Health Nutr 2002 ; 5 : 1113 – 24.
(24) Ferrari P, Slimani N, Ciampi A, Trichopoulou A, Naska A, Lauria C, et al. Evaluation of under- and
overreporting of energy intake in the 24-hour diet recalls in the European Prospective Investigation into Cancer and Nutrition (EPIC). Public Health Nutr 2002 ; 5 : 1329 – 45.
(25) European Prospective Investigation into Cancer and Nutrition. Validity studies on dietary assessment
methods. Int J Epidemiol 1997 ; 26 Suppl. 1: S1 – S189.
(26) Linseisen J, Kesse E, Slimani N, Bueno-de-Mesquita HB, Ocke MC, Skeie G, et al. Meat consumption in
the European Prospective Investigation into Cancer and Nutrition (EPIC) cohorts: results from 24-hour dietary recalls. Public Health Nutr 2002 ; 5 : 1243–58.
(27) Welch AA, Lund E, Amiano P, Dorronsoro M, Brustad M, Kumle M, et al. Variability of fish
consumption within the 10 European countries participating in the European Investigation into Cancer and Nutrition (EPIC) study. Public Health Nutr 2002 ; 5 : 1273 – 85.
(28) Slimani N, Kaaks R, Ferrari P, Casagrande C, Clavel-Chapelon F, Lotze G, et al. European Prospective
Investigation into Cancer and Nutrition (EPIC) calibration study: rationale, design and population characteristics. Public Health Nutr 2002 ; 5 : 1125 – 45.
(29) Kaaks R, Plummer M, Riboli E, Esteve J, van Staveren W. Adjustment for bias due to errors in exposure
assessments in multicenter cohort studies on diet and cancer: a calibration approach. Am J Clin Nutr 1994 ; 59 (Suppl 1): 245S – 50S.
(30) Ferrari P, Kaaks R, Fahey M, Slimani N, Day NE, Pera G, et al. Within and between cohort variation in
measured macro-nutrient intakes in the EPIC study taking account of measurement errors. Am J Epidemiol 2004;160:814 –22.
(31) Rosner B, Gore R. Measurement error correction in nutritional epidemiology based on individual foods,
with application to the relation of diet to breast cancer. Am J Epidemiol 2001 ; 154 : 827 – 35.
(32) Greenland S, Rothman KJ. Introduction to stratified analysis. In: Rothman KJ, Greenland S, editors.
Modern epidemiology. 2nd ed. Philadelphia (PA): Lippincott-Raven; 1998 . p. 53 – 79.
(33) Rohrmann S, Linseisen J, Becker N, Norat T, Sinha R, Skeie G, et al. Cooking of meat and fish in
Europe — results from the European Prospective Investigation into Cancer and Nutrition (EPIC). Eur J Clin Nutr 2002 ; 56 : 1216 – 30.
(34) Cross AJ, Pollock JR, Bingham SA. Haem, not protein or inorganic iron, is responsible for endogenous
intestinal N-nitrosation arising from red meat. Cancer Res 2003 ; 63 : 2358 – 60.
(35) Bingham SA, Hughes R, Cross AJ. Effect of white versus red meat on endogenous N-nitrosation in the
human colon and further evidence of a dose response. J Nutr 2002 ; 132 (11 Suppl): 3522S – 5S.
(36) Sugimura T. Nutrition and dietary carcinogens. Carcinogenesis 2000 ; 21 : 387 – 95.
(37) Sachse C, Smith G, Wilkie MJ, Barrett JH, Waxman R, Sullivan F, et al. A pharmacogenetic study to
investigate the role of dietary carcinogens in the etiology of colorectal cancer. Carcinogenesis 2002 ; 23 : 1839 – 49.
(38) Kampman E, Slattery ML, Bigler J, Leppert M, Samowitz W, Caan BJ, et al. Meat consumption, genetic
susceptibility, and colon cancer risk: a United States multicenter case-control study. Cancer Epidemiol Biomarkers Prev 1999 ; 8 : 15 – 24.
(39) Lang NP, Butler MA, Massengill J, Lawson M, Stotts RC, Hauer-Jensen M, et al. Rapid metabolic
phenotypes for acetyltransferase and cytochrome P4501A2 and putative exposure to food-borne heterocyclic amines increase the risk for colorectal cancer or polyps. Cancer Epidemiol Biomarkers Prev 1994 ; 3 : 675 – 82.
(40) Roberts-Thomson IC, Butler WJ, Ryan P. Meat, metabolic genotypes and risk for colorectal cancer. Eur J
Cancer Prev 1999 ; 8 : 207 – 11.
(41) Murtaugh MA, Sweeney C, Ma KN, Caan BJ, Slattery ML. The CYP 1A1 genotype may alter the
association of meat consumption patterns and preparation with the risk of colorectal cancer in men and women. J Nutr 2005 ; 135 : 179 – 86.
(42) Larsson SC, Kumlin M, Ingelman-Sundberg M, Wolk A. Dietary long-chain n-3 fatty acids for the
prevention of cancer: a review of potential mechanisms. Am J Clin Nutr 2004 ; 79 : 935 – 45.
(43) Kaaks R, Riboli E, van Staveren W. Calibration of dietary intake measurements in prospective cohort
studies. Am J Epidemiol 1995 ; 142 :548 – 56.
(44) Willett W. Commentary: Dietary diaries versus food frequency questionnaires — a case of undigestible
data. Int J Epidemiol 2001 ; 30:317 –9.
(45) Jakes RW, Day NE, Luben R, Welch A, Bingham S, Mitchell J, et al. Adjusting for energy intake —
what measure to use in nutritional epidemiological studies? Int J Epidemiol 2004 ; 33 : 1382 – 6.
(46) Day N, McKeown N, Wong M, Welch A, Bingham S. Epidemiological assessment of diet: a comparison
of a 7-day diary with a food frequency questionnaire using urinary markers of nitrogen, potassium and sodium. Int J Epidemiol 2001 ; 30 : 309 – 17.
(47) Kipnis V, Carroll RJ, Freedman LS, Li L. Implications of a new dietary measurement error model for
estimation of relative risk: application to four calibration studies. Am J Epidemiol 1999;150:642–51.
(48) Kipnis V, Midthune D, Freedman L, Bingham S, Day NE, Riboli E, et al. Bias in dietary-report
instruments and its implications for nutritional epidemiology. Public Health Nutr 2002 ; 5 : 915 – 23.
(49) Slimani N, Bingham S, Runswick S, Ferrari P, Day NE, Welch AA, et al. Group level validation of
protein intakes estimated by 24-hour diet recall and dietary questionnaires against 24-hour urinary nitrogen in the European Prospective Investigation into Cancer and Nutrition (EPIC) calibration study. Cancer Epidemiol Biomarkers Prev 2003 ; 12 : 784 – 95.
(50) Willett WC. Balancing life-style and genomics research for disease prevention. Science 2002 ; 296 : 695
– 8.
Notes
The work described in this article was carried out with financial support of the ―Europe Against Cancer Program‖ of the European Commission (SANCO); the Danish Cancer Society; German Cancer Aid; Ligue Nationale contre le Cancer, the 3M Company, INSERM; the German Cancer Research Center; the GermanFederal Ministry of Education and Research; the Dutch Ministry of Public Health, Welfare and Sports; the National Cancer Registry and the Regional Cancer Registries Amsterdam, East and Maastricht of The Netherlands; the Norwegian Cancer Society; the Norwegian Research Council; the Health Research Fund (FIS) of the Spanish Ministry of Health; the Greek Ministry of Health; the Greek Ministry of Education; the Italian Association for Research on Cancer; Spanish Regional Governments of Andalucia, Asturias, Basque Country, Murcia and Navarra, and ISCIII; Red de Centros RCESP, C03/09; the Swedish Cancer Society; the Swedish Scientific Council; the Regional Government of Skane, Sweden; Cancer Research UK; the Medical Research Council, U.K.; the Stroke Association, U.K.; the British Heart Foundation; the Department of Health, U.K.; the Food Standards Agency, U.K.; and the Wellcome Trust, U.K.