HAL Id: inserm-00452796
https://www.hal.inserm.fr/inserm-00452796
Submitted on 26 Jan 2011
HAL is a multi-disciplinary open access
archive for the deposit and dissemination of sci-entific research documents, whether they are pub-lished or not. The documents may come from teaching and research institutions in France or abroad, or from public or private research centers.
L’archive ouverte pluridisciplinaire HAL, est destinée au dépôt et à la diffusion de documents scientifiques de niveau recherche, publiés ou non, émanant des établissements d’enseignement et de recherche français ou étrangers, des laboratoires publics ou privés.
Investigating the spatial variability in incidence of
coronary heart disease in the Gazel cohort: the impact
of area socioeconomic position and mediating role of risk
factors.
Romain Silhol, Marie Zins, Pierre Chauvin, Basile Chaix
To cite this version:
Romain Silhol, Marie Zins, Pierre Chauvin, Basile Chaix. Investigating the spatial variability in incidence of coronary heart disease in the Gazel cohort: the impact of area socioeconomic position and mediating role of risk factors.. Journal of Epidemiology and Community Health, BMJ Publishing Group, 2011, 65 (2), pp.137-43. �10.1136/jech.2009.087379�. �inserm-00452796�
Investigating the spatial variability in incidence of coronary heart disease in the Gazel Cohort: the impact of area socioeconomic position and mediating role of risk factors
Romain Silhol, Marie Zins, Pierre Chauvin, Basile Chaix
Author’s affiliations
Romain Silhol, Pierre Chauvin, Basile Chaix, Inserm U707, Paris, 75012, France; Romain Silhol, Pierre Chauvin, Basile Chaix, Université Pierre et Marie Curie-Paris6,
UMR-S 707, Paris, France;
Marie Zins, Inserm, U687, Saint Maurice, France
Correspondance to: Basile Chaix, UMR-S 707 (Inserm – UPMC-Paris6), Faculté de Médecine Saint-Antoine, 27 rue Chaligny, 75012 Paris, France. Tel: +33 1 44 73 84 43. Fax: +33 1 44 73 86 63. Email: chaix@u707.jussieu.fr
Key Words: cardiovascular diseases; social environment; socioeconomic factors; follow-up
Abstract:
Study objective: The study aim was to improve our understanding of the relationships
between contextual socioeconomic characteristics and coronary heart disease (CHD) incidence in France. Several authors have suggested that CHD risk factors (diabetes,
hypertension, cholesterol, overweight, tobacco consumption) may partly mediate associations between socioeconomic environmental variables and CHD. However, studies have assessed the overall mediating role of CHD risk factors, but have never investigated the specific mediating role of each risk factor, not allowing disentangling their specific contribution to the area socioeconomic position–CHD association.
Design: After assessing geographical variations in CHD incidence and socioeconomic
environmental effects on CHD using a multilevel Cox model, we assessed the extent to which this contextual effect was mediated by each of the CHD risk factors.
Participants: We used data of the French GAZEL cohort (n = 19808).
Main results: After adjustment for several individual socioeconomic indicators, we
found, among men from highly urbanized environments, that CHD incidence increased with decreasing socioeconomic position of the residential environment. After individual-level adjustment, a higher risk of obesity, smoking, and cholesterol was observed in the most deprived residential environments. When risk factors were introduced into the model, we observed a modest decrease in the magnitude of the association between the socioeconomic contextual variable and CHD. Risk factors that contributed most to the decrease of the association were smoking and cholesterol.
Conclusions: Classical risk factors, though some of them more than others, mediated a
modest part of the association between area socioeconomic position and CHD.
There is growing evidence that the social determinants of disease risk can intervene both at the individual level and at the level of different life contexts (residential environment, workplace environment, etc.).[1][2] Contextual studies, investigating the influence of the residential environment on health, may be useful to develop efficient policies through a better targeting of populations with a higher risk of diseases and a better understanding of
mechanisms producing health disparities. For example, studies have shown that
neighbourhood socioeconomic characteristics can influence tobacco use,[3][4] physical activity[5] and mortality,[6] independently of the effects of individual socioeconomic characteristics.
The association between individual socioeconomic factors and incidence of coronary heart disease (CHD) has been extensively investigated in previous literature.[7] It has also been shown that incidence of and mortality by CHD varies across space.[8] Such
geographical variations between and within large regions remain largely unexplained, which has led researchers to study contextual effects operating on different scales.[9] Several studies have shown associations between socioeconomic contextual characteristics and incidence of CHD or mortality by CHD.[2][10][11][12][13][14][15][16] However, no study to date has tested this specific hypothesis in France, not permitting to assess whether CHD risk also depends on the poverty level of the residential environment in the French context.
A limitation of current literature is that it does not allow understanding the mechanisms through which the area socioeconomic environment may influence coronary health. A commonly evoked hypothesis is that classical CHD risk factors may intervene as mediators in these associations. It has been shown that the spatial distribution of CHD risk factors (physical inactivity, overweight, tobacco consumption, hypertension, cholesterol) is shaped by individuals’ residential environment, including its socioeconomic
The present study had three objectives: first, to quantify the magnitude of geographic variability in CHD incidence, attempting to determine the spatial scale on which variations were operating; second, to estimate associations between socioeconomic contextual factors and CHD incidence, after controlling for the sociodemographic characteristics of individuals; third, to examine the extent to which the association between area socioeconomic position and CHD was mediated by each of the classical cardiovascular risk factors (diabetes,
hypertension, cholesterol, overweight, and tobacco consumption).
Methods Population
In the present study, we used the data of the GAZEL cohort.[18][19][20] There were 20 542 women and men at baseline in 1989. Women (27% of the sample) were 35 to 50 year old, and men were 40 to 50 year old at baseline. All the participants were working for the companies EDF (Electricity of France) and GDF (Gas of France) and were volunteer to participate. They all receive an annual questionnaire since 1989, which investigates participants’ physical and mental health, health behaviours, and other issues. Occupational and personal data are updated through human resources department files. Information on incidence of coronary heart diseases was obtained from the company's Health Insurance Department.[21][22]
We combined different datasets at the individual level:
- a demographic database including the age, gender, dates of death or retirement, and municipality of residence of individuals in 1990;
- data from the 1989 and 1990 auto-questionnaires containing information on household composition, household income, educational attainment of individuals, weight, height,
tobacco consumption, cholesterol, hypertension, diabetes, and prevalent common chronic conditions assessed from a checklist.
- a dataset on the occupational trajectory of individuals;
- a dataset reporting the incident cases of CHD from January 1st 1990 to December 31st 2000 and their nature (angina pectoris, acute myocardial infection, sudden death); people who stopped answering to the annual questionnaires over the study period were nevertheless followed in this register, but those who retired were no longer followed.
We excluded the following participants from our database: those for whom the occupation was unknown [N = 501], those who had had a CHD event before January 1st 1990 [N = 37], those from the French overseas territories [N = 136], and those with a missing or inadequate municipality code [N = 66]. Our final database includes 19 808 participants. We used the 1990 French census to determine characteristics of residential municipalities.
Measures
In this study, the main outcome variable was incidence of CHD. For each individual, we only considered the first incident event (only 4% of the participants with an incident CHD had had more than one event).
As explanatory variables, we took into account both individual characteristics and area characteristics. We considered age as a continuous variable. Educational attainment was coded in two classes: (i) people who completed secondary school or had a university degree and (ii) those who did not. Regarding baseline occupation,[23] a categorisation from the French National Institute of Statistics and Economic Studies (INSEE) allowed us to
distinguish between high white-collar workers, intermediate occupation, and low white- and blue-collar workers. Household income was divided by the number of consumption units, and
categorised into three classes. Marital status was coded in two classes: alone (single, divorced, or widowed) or not (married or in couple).
Regarding CHD risk factors, smoking was coded in four classes: non-smokers,
previous-smokers, light-to-moderate smokers (20 cigarettes per day or less), and hard smokers (more than 20 cigarettes). Body mass index (BMI) was defined as self-reported weight (in kg) divided by the square of self-reported height (in m). Overweight corresponds to a BMI
between 25 and 30, and obesity to a BMI greater than 30. We also constituted 3 binary variables based on questions asking to the participants whether they suffered from diabetes, hypertension, or cholesterol.
Using the 1990 census, we defined two contextual variables at the municipality level, i.e., the percentage of chief executive officers (CEO) of companies comprising 10 employees or more among inhabitants aged 25 to 60 years, and the percentage of inhabitants aged 25 to 60 years who had a university degree or equivalent. The percentage of CEOs was selected on the basis of the a priori argument that CEOs are among those who have no financial
constraint when choosing their residential environment; thus the area percentage of CEOs may constitute a particularly accurate proxy of desirable, high-social status, and advantaged areas. The two area variables were divided in four classes comprising a similar number of GAZEL participants (cutoffs were redefined in each specific sample).
Statistical analysis
To quantify the geographical variability in CHD incidence and estimate individual and contextual effects on the incidence of the disease, we estimated multilevel Cox models. The multilevel Cox model can be written as:
where X corresponds to a vector of explanatory variables and u0j to the area-level random effect for area j. The model assumes that this area-level random effect follows a normal distribution, and estimates the variance σu02of its distribution.[24]
To quantify geographic variations in CHD incidence, we first estimated an empty model (that did not include any explanatory variable except age and gender). Geographic variability was assessed with the variance of the area-level random effect.[25][26][27] We estimated separate two-level models (individuals nested within areas), considering different area subdivisions at the 2nd level of the hierarchy (municipalities, counties, and regions). There were 3235 municipalities represented in our database, 96 counties, and 22 regions. For the GAZEL participants, the median number of inhabitants in those areas were 6871, 472325, and 1919847, respectively. The median number of GAZEL participants in those areas were 3, 127, and 597, respectively. To assess spatial autocorrelation in CHD incidence, i.e., whether areas adjacent one to the other had a more similar incidence risk that areas located further apart on the territory, we computed the Moran’s I statistic for the area-level residuals of the multilevel model.[28] In the absence of spatial autocorrelation, the Moran’s I statistic has a small negative expectation when applied to regression residuals.[29] In comparing the 95% confidence interval with the value 0, we have therefore applied a conservative test.
After estimating a model for the whole database, we estimated separate empty models among people living in highly urban territories and people from territories with a lower urbanicity degree, in order to compare the geographical variability in those distinct territories. Based on a definition of the French Institute of Statistics and Economic Studies, highly urban territories corresponded to urban municipalities or groupings of interconnected urban
municipalities of 100 000 inhabitants or more.
Individual characteristics (marital status, education, occupation, and income) were then introduced into the model to examine whether geographical variability in CHD incidence
was due to compositional effects related to those individual variables. Contextual factors were then introduced into the model, to estimate associations between contextual factors and CHD adjusted for individual variables.
To assess whether cardiovascular risk factors (diabetes, hypertension, cholesterol, overweight, and tobacco consumption) had a mediating role in the associations between contextual variables and CHD incidence, we first estimated separate multilevel logistic models with those risk factors as the outcomes.
As a rough approximation of the extent to which each specific CHD risk factor mediated part of the area–CHD association, we finally compared the socioeconomic contextual effect (adjusted for individual socioeconomic variables) before and after
controlling for each specific risk factor separately. In this final analysis, the area variable was included as an ordinal variable taking values from 1 to 4. We determined the proportional change in the socioeconomic area effect when including each specific risk factor separately, allowing to assess the mediating role of each risk factor.
We used SAS[30] to perform the statistical analysis. Cox models were estimated with R.[31][32]
Results
In our sample (19 808 participants), there were 27% of women. Participants were 36 to 51 year old on January 1st 1990. Between January 1 1990 and December 31 2000, 325 participants (1.6%) had an incident CHD (angina pectoris, acute myocardial infarction, or sudden death), including 195 myocardial infarctions (0.9%).
Table 1: Characteristics of the GAZEL participants and socioeconomic characteristics of their residential municipality according to the urbanicity degree of municipality, GAZEL cohort, 1990–2000, men and women
High urbanicity degree (n = 10303) Intermediate or low urbanicity degree (n = 9505) Full sample (n = 19808) p Individual characteristics
Age (in years) * 44.7 44.8 44.7 0.15
Women § 33.5% 20.5% 27.3% <0.0001
Low educational level § 67.2% 78.1% 72.4% <0.0001
High white-collar workers § 27.9% 17.3% 22.8% <0.0001
Median monthly household
income (in euros) 985€ 812€ 902€ <0.0001
Municipality characteristics
Percentage of CEOs in the
municipality ‡ 0.7% 0.6% 0.7% <0.001
Percentage with a university
degree in the municipality ‡ 19.6% 11.1% 15.5% <0.001
* Student test; § Khi-square test; ‡ Wilcoxon test (the test was performed at the individual level with the municipality variable attributed to each individual)
In our population, 0.3% of women had an incident CHD event (15 out of 5387), and 2.2% of men (310 out of 4096). As a consequence, most of the analyses were only conducted among men. Table 1 describes the socioeconomic characteristics of the participants according to the urbanicity degree of their municipality. Participants residing in high-urbanicity degree municipalities had a higher educational level, a higher occupational status, and a higher household income.
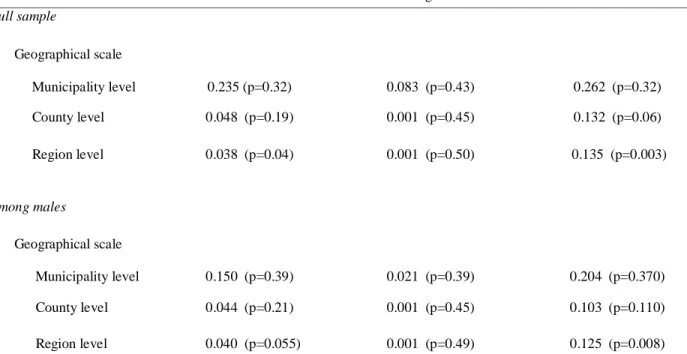
To assess geographic variability in CHD incidence, we estimated empty multilevel survival models for CHD incidence, adjusted for age and gender only (see Table 2). Because of sample size limitations, a statistically significant area-level variance was only observed on a regional scale, even if much higher point estimates were observed at the municipality level. Investigating further spatial variations in CHD on a regional scale, the Moran’s I indicated that there was no spatial autocorrelation in the residuals of the model. Significant variations in
CHD incidence were observed between regions among high urbanicity participants (area-level variance = 0.125, p =0.008). In contrast, there was no variability at all among participants from intermediate or low urbanicity degree territories (area-level variance = 0.001, p =0.49). Accordingly, all the following analyses are conducted among men from municipalities with a high urbanicity degree (6852 men, 127 CHD incident events), using multilevel models with individuals nested within region.
Table 2: Variance of the area random effect estimated from separate two-level (individuals, areas) empty multilevel survival models for CHD incidence (adjusted for age and gender), GAZEL cohort, 1990-2000, men and women
Full population Intermediate or low urbanicity
degree
High urbanicity degree
Full sample Geographical scale Municipality level 0.235 (p=0.32) 0.083 (p=0.43) 0.262 (p=0.32) County level 0.048 (p=0.19) 0.001 (p=0.45) 0.132 (p=0.06) Region level 0.038 (p=0.04) 0.001 (p=0.50) 0.135 (p=0.003) Among males Geographical scale Municipality level 0.150 (p=0.39) 0.021 (p=0.39) 0.204 (p=0.370) County level 0.044 (p=0.21) 0.001 (p=0.45) 0.103 (p=0.110) Region level 0.040 (p=0.055) 0.001 (p=0.49) 0.125 (p=0.008)
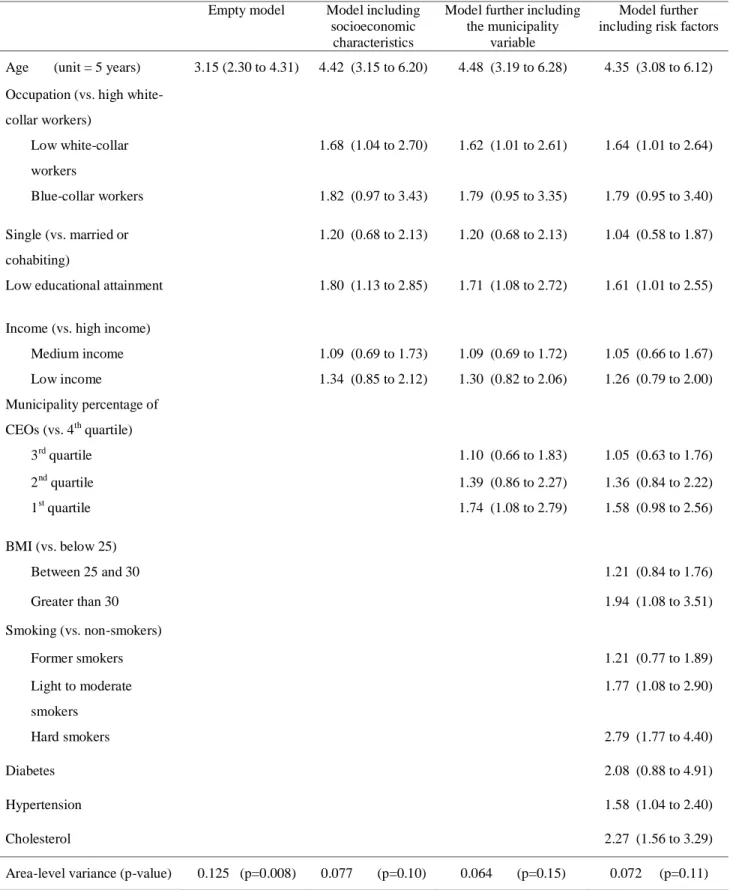
Individual sociodemographic characteristics were then included into the model for CHD incidence (among male residents of high-urbanicity degree municipalities). As seen in Table 3, CHD incidence increased with decreasing occupational status and decreasing educational attainment. CHD incidence was not associated with household income. After including individual sociodemographic characteristics, the between-region variance decreased by 38%.
Table 3: Associations between individual and municipality characteristics and CHD incidence (hazard ratios and 95% CI), GAZEL cohort, 1990-2000, men residing in high-urbanicity degree municipalities
Empty model Model including
socioeconomic characteristics
Model further including the municipality
variable
Model further including risk factors
Age (unit = 5 years) 3.15 (2.30 to 4.31) 4.42 (3.15 to 6.20) 4.48 (3.19 to 6.28) 4.35 (3.08 to 6.12)
Occupation (vs. high white-collar workers) Low white-collar workers 1.68 (1.04 to 2.70) 1.62 (1.01 to 2.61) 1.64 (1.01 to 2.64) Blue-collar workers 1.82 (0.97 to 3.43) 1.79 (0.95 to 3.35) 1.79 (0.95 to 3.40) Single (vs. married or cohabiting) 1.20 (0.68 to 2.13) 1.20 (0.68 to 2.13) 1.04 (0.58 to 1.87)
Low educational attainment 1.80 (1.13 to 2.85) 1.71 (1.08 to 2.72) 1.61 (1.01 to 2.55)
Income (vs. high income)
Medium income 1.09 (0.69 to 1.73) 1.09 (0.69 to 1.72) 1.05 (0.66 to 1.67) Low income 1.34 (0.85 to 2.12) 1.30 (0.82 to 2.06) 1.26 (0.79 to 2.00) Municipality percentage of CEOs (vs. 4th quartile) 3rd quartile 1.10 (0.66 to 1.83) 1.05 (0.63 to 1.76) 2nd quartile 1.39 (0.86 to 2.27) 1.36 (0.84 to 2.22) 1st quartile 1.74 (1.08 to 2.79) 1.58 (0.98 to 2.56) BMI (vs. below 25) Between 25 and 30 1.21 (0.84 to 1.76) Greater than 30 1.94 (1.08 to 3.51) Smoking (vs. non-smokers) Former smokers 1.21 (0.77 to 1.89) Light to moderate smokers 1.77 (1.08 to 2.90) Hard smokers 2.79 (1.77 to 4.40) Diabetes 2.08 (0.88 to 4.91) Hypertension 1.58 (1.04 to 2.40) Cholesterol 2.27 (1.56 to 3.29)
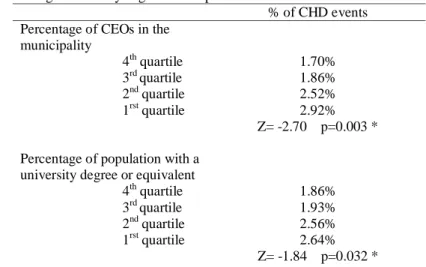
The two municipality socioeconomic variables were then considered in the analyses. For each of them, we observed a graded increase in CHD incidence with decreasing
socioeconomic position of the municipality of residence (Table 4, descriptive data). A perhaps stronger gradient was observed for the municipality percentage of CEOs than for the
percentage of inhabitants with a university degree.
Table 4: Percentage of CHD incident cases in each quartile of municipality characteristics, GAZEL cohort, 1990-2000, men residing in high-urbanicity degree municipalities
% of CHD events Percentage of CEOs in the
municipality 4th quartile 3rd quartile 2nd quartile 1rst quartile 1.70% 1.86% 2.52% 2.92% Z= -2.70 p=0.003 * Percentage of population with a
university degree or equivalent 4th quartile 3rd quartile 2nd quartile 1rst quartile 1.86% 1.93% 2.56% 2.64% Z= -1.84 p=0.032 * * Cochran-Armitage trend test, bilateral
These two municipality variables were then introduced each into a separate multilevel model for CHD incidence adjusted for individual sociodemographic characteristics. As shown in Table 3 (third column), the municipality percentage of CEOs was significantly associated with CHD incidence after individual-level adjustment. In contrast, the association between municipality education and CHD incidence was no longer significant after controlling for individual sociodemographic characteristics (not shown in a table; hazard ratios for the third, second, and first quartiles of municipality education were 1.02 [95% CI: 0.61 to 1.70], 1.42 [95% CI: 0.88 to 2.30], and 1.34 [95% CI: 0.82 to 2.22]).
Original to the present article is the aim to assess how each of the CHD risk factors may contribute, independently, to the association between area socioeconomic position and CHD incidence. First, we estimated associations between each of the two area variables
considered separately and the different risk factors, adjusted for individual socioeconomic characteristics (Tables 5a and 5b). Overall, increased risks of overweight and obesity, smoking, and cholesterol were observed in low socioeconomic position municipalities (however, the municipality socioeconomic variables associated with the outcome was not the same for all risk factors).
All five risk factors were simultaneously introduced into the multilevel model for CHD. People with a higher BMI, smokers, and persons with hypertension and cholesterol had a higher risk of CHD incidence (Table 3). After controlling for risk factors, the CHD risk difference between municipalities with a low and high percentage of CEOs was not longer statistically significant, even if a pattern of association remained apparent.
In a final step, to assess the extent to which controlling for risk factors resulted in a decrease of the association between area socioeconomic position and CHD incidence, models for CHD incidence were reestimated with the percentage of CEOs introduced as an ordinal variable coded from 1 to 4. Such model was fitted to the data with either (i) no risk factors introduced into the model, (ii) each of the CHD risk factors included separately, or (iii) all risk factors considered simultaneously (results not shown). The association between the municipality percentage of CEOs and CHD incidence decreased by 13% when including all risk factors simultaneously into the model, suggesting that only a small part of the association was “explained” by risk factors. Inclusion of each risk factor into a separate model suggested that cholesterol (9% decrease) and smoking (6% decrease) made the largest contribution to this modest reduction in effect size.
Table 5a: Associations between municipality characteristics and body mass index (overweight and obesity) and smoking (former smoker and current smoker), from multilevel logistic models adjusted for individual socioeconomic characteristics, GAZEL cohort, 1990-2000, men residing in high-urbanicity degree municipalities
Overweight (vs. normal weight) Obesity (vs. normal weight) Former smoker (vs. non-smoker) Current smoker (vs. non-smoker) OR 95% CI OR 95% CI OR 95% CI OR 95% CI Percentage of CEOs in the municipality 4th quartile 3rd quartile 2nd quartile 1rst quartile Trend test 1.00 0.91 1.05 1.02 (0.78 to 1.06) (0.90 to 1.22) (0.88 to 1.19) p=0.54 1.00 0.80 1.08 0.99 (0.56 to 1.15) (0.76 to 1.52) (0.69 to 1.40) p=0.61 1.00 1.14 1.10 1.13 (0.96 to 1.34) (0.93 to 1.29) (0.96 to 1.34) p=0.22 1.00 1.17 1.11 1.30 (0.99 to 1.39) (0.94 to 1.32) (1.10 to 1.54) p=0.02 Percentage of population with a university degree or equivalent 4th quartile 3rd quartile 2nd quartile 1rst quartile Trend test 1.00 0.96 1.26 1.28 (0.83 to 1.12) (1.08 to 1.47) (1.10 to 1.50) p<0.001 1.00 1.23 1.43 1.61 (0.85 to 1.80) (0.98 to 2.01) (1.11 to 2.35) p<0.01 1.00 1.11 0.99 1.21 (0.94 to 1.31) (0.83 to 1.17) (1.01 to 1.44) p<0.11 1.00 1.04 0.94 1.04 (0.88 to 1.23) (0.79 to 1.12) (0.95 to 1.35) p=0.54
Table 5b: Associations between municipality characteristics and diabetes, hypertension, and cholesterol, from multilevel logistic models adjusted for individual socioeconomic characteristics, GAZEL cohort, 1990-2000, men residing in high-urbanicity degree municipalities
Diabetes Hypertension Cholesterol
OR 95% CI OR 95% CI OR 95% CI
Percentage of CEOs in the municipality 4th quartile 3rd quartile 2nd quartile 1rst quartile Trend test 1.00 1.69 1.21 1.31 (0.94 to 3.05) (0.65 to 2.28) (0.71 to 2.44) p=0.74 1.00 1.02 1.13 1.00 (0.82 to 1.27) (0.91 to 1.40) (0.80 to 1.25) p=0.86 1.00 1.08 1.16 1.20 (0.88 to 1.31) (0.95 to 1.40) (0.99 to 1.46) p=0.10 Percentage of population
with a university degree or equivalent 4th quartile 3rd quartile 2nd quartile 1rst quartile Trend test 1.00 1.00 0.73 1.17 (0.56 to 1.78) (0.39 to 1.37) (0.66 to 2.07) p=0.76 1.00 1.03 1.21 1.05 (0.83 to 1.29) (0.97 to 1.51) (0.83 to 1.32) p=0.34 1.00 1.19 1.18 1.23 (0.98 to 1.45) (0.97 to 1.44) (1.00 to 1.51) p=0.23 Discussion
As in other previous studies conducted in the US or Europe,[2][11][14][16][33][34] the present work reports an association between an area socioeconomic variable and CHD
incidence, beyond effects of individual characteristics. Moreover, it was found that traditional CHD risk factors, though strongly associated with CHD, only mediated a modest part of the association between area socioeconomic position and CHD incidence. Perhaps smoking and cholesterol had a larger mediating role than other risk factors.
However, there are limitations to the present study. First, residential areas were defined on a broader scale than in previous studies.[34] It is interesting to note that an area “effect” was observed even at this scale. Second, assessment of common chronic conditions based on self-reports is a potential source of misclassification. However, some studies have reported a high agreement between self-reports and medical records for diabetes and hypertension,[35] even if self-reported chronic diseases are likely to be affected by under-reporting because of the associated stigma or lack of knowledge or denial.[36] Despite this limitation, associations between these risk factors and CHD were observed in our data. A reason may be that the participants, as part of a large national company, are followed yearly by physicians of the company.[19]
Strengths of the present study include the careful follow-up of CHD events[18] and the rather long follow-up period (11 years), as well as the fact that, to the best of our
knowledge, no previous multilevel study of the association between area social variables and CHD has been conducted in France.
We first assessed geographic variations in CHD incidence over the French territory. Of interest was the finding that only high-urbanicity residents contributed to between-region variations in CHD incidence. This finding is coherent with those of a previous study that reported a certain homogeneity in CHD incidence among non-urban residents.[37]
The percentage of CEOs in the municipality was used to characterize the
socioeconomic environment. Our a priori assumption in using this indicator was that CEOs may have the opportunity to choose the most attractive residential environments; thus the area
percentage of CEOs may constitute an accurate proxy of desirable, high-social status, and advantaged areas. After adjustment for several individual socioeconomic characteristics, we found that CHD risk increased with decreasing area percentage of CEOs (it should be noted, however, that the other area variable considered based on residents’ educational attainment was not associated with the outcome). Based on previous literature,[38] a stronger association may be expected if the association was estimated on a more local scale (e.g., at the
neighbourhood level).
In the literature, it is generally hypothesized that associations between area socioeconomic variables and CHD are to some extent mediated by the traditional
cardiovascular risk factors.[34][39] However, empirically, most studies that explicitly tested this association[11][14][33][40][41][42][43][44][45][46][47][48][49][50] observed that the area–CHD associations remained unchanged or only slightly decreased or increased after introduction of the risk factors. The present study is coherent with this literature as the area– CHD incidence association only decreased by slightly more than 10% when 5 of the traditional risk factors were introduced into the model.
Original to the present study was the attempt to assess whether some of the traditional risk factors may have a more important role than other in mediating the association between area socioeconomic position and CHD incidence. To the best of our knowledge, all studies that considered several risk factors as potential mediators included them simultaneously into the model, not allowing to separate the mediating role of the different factors. Our results suggest that smoking and cholesterol may have a greater contribution than other risk factors in the area–CHD association.
Future studies will have to assess whether this result is generalisable to other
part of the association between area socioeconomic position and CHD that is not “explained” by traditional cardiovascular risk factors.
References
1 Kawachi IB, L. Neighborhoods and health. New York: Oxford University Press, 2003. 2 Chaix B. Geographic life environments and coronary heart disease: a systematic review, theoretical contributions, methodological updates, and a research agenda. Annu Rev Public
Health 2009;30, in press.
3 Duncan C, Jones K, Moon G. Smoking and deprivation: are there neighbourhood effects?
Soc Sci Med 1999;48:497-505.
4 Kleinschmidt I, Hills M, Elliott P. Smoking behaviour can be predicted by neighbourhood deprivation measures. J Epidemiol Community Health 1995;49 Suppl 2:S72-S7.
5 Sundquist J, Malmstrom M, Johansson SE. Cardiovascular risk factors and the neighbourhood environment: a multilevel analysis. Int J Epidemiol 1999;28:841-5. 6 Yen IH, Kaplan GA. Neighborhood social environment and risk of death: multilevel evidence from the Alameda County Study. Am J Epidemiol 1999;149:898-907.
7 Kaplan GA, Keil JE. Socioeconomic factors and cardiovascular disease: a review of the literature. Circulation 1993;88:1973-98.
8 Lawlor DA, Bedford C, Taylor M, et al. Geographical variation in cardiovascular disease, risk factors, and their control in older women: British Women's Heart and Health Study. J
Epidemiol Community Health 2003;57:134-40.
9 Morris RW, Whincup PH, Lampe FC, et al. Geographic variation in incidence of coronary heart disease in Britain: the contribution of established risk factors. Heart 2001;86:277-83.
10 Chaix B, Rosvall M, Merlo J. Recent increase of neighborhood socioeconomic effects on ischemic heart disease mortality: a multilevel survival analysis of two large Swedish cohorts.
Am J Epidemiol 2007;165:22-6.
11 Diez-Roux AV, Nieto FJ, Muntaner C, et al. Neighborhood environments and coronary heart disease: a multilevel analysis. Am J Epidemiol 1997;146:48-63.
12 Diez Roux AV. Residential environments and cardiovascular risk. J Urban Health 2003;80:569-89.
13 Davey Smith G, Hart C, Watt G, et al. Individual social class, area-based deprivation, cardiovascular disease risk factors, and mortality: the Renfrew and Paisley Study. J Epidemiol
Community Health 1998;52:399-405.
14 Diez Roux AV, Merkin SS, Arnett D, et al. Neighborhood of residence and incidence of coronary heart disease. N Engl J Med 2001;345:99-106.
15 Chaix B, Rosvall M, Merlo J. Assessment of the magnitude of geographic variations and socioeconomic contextual effects on ischaemic heart disease mortality: a multilevel survival analysis of a large Swedish cohort. J Epidemiol Community Health 2006;in press.
16 Chaix B, Rosvall M, Merlo J. Neighborhood socioeconomic deprivation and residential instability: effects on incidence of ischemic heart disease and survival after myocardial infarction. Epidemiology 2007;18:104-11.
17 Chaix B, Chauvin P. Tobacco and alcohol consumption, sedentary lifestyle and
overweightness in France: a multilevel analysis of individual and area-level determinants. Eur
J Epidemiol 2003;18:531-8.
18 Goldberg M, Chastang JF, Leclerc A, et al. Socioeconomic, demographic, occupational, and health factors associated with participation in a long-term epidemiologic survey: a prospective study of the French GAZEL cohort and its target population. Am J Epidemiol 2001;154:373-84.
19 Goldberg M, Chastang JF, Zins M, et al. Health problems were the strongest predictors of attrition during follow-up of the GAZEL cohort. J Clin Epidemiol 2006;59:1213-21.
20 Goldberg M, Leclerc A, Bonenfant S, et al. Cohort profile: the GAZEL Cohort Study. Int
J Epidemiol 2007;36:32-9.
21 Allonier C, Chevalier A, Zins M, et al. Anxiety or depressive disorders and risk of ischaemic heart disease among French power company employees. Int J Epidemiol 2004;33:779-86.
22 Chevalier A, Zins M, Godard C, et al. [ A registry of ischaemic cardiopathies among active workers at Electricite de France-Gaz de France. Program development and first results]. Rev Epidemiol Sante Publique 2001;49:51-60.
23 INSEE. Nomenclature des professions et catégories socioprofessionnelles [List of
professions and social categories] (in French). Paris, France: Institut National de la
Statistique et des Etudes Economiques, 1994.
24 Snijders T, Bosker R. Multilevel Analysis. An introduction to basic and advanced
multilevel modelling. London, UK: Sage Publications, 1999.
25 Merlo J, Chaix B, Yang M, et al. A brief conceptual tutorial of multilevel analysis in social epidemiology – linking the statistical concept of clustering to the idea of contextual phenomenon. J Epidemiol Community Health 2005;59:443-9.
26 Merlo J, Chaix B, Yang M, et al. A brief conceptual tutorial on multilevel analysis in social epidemiology: interpreting neighbourhood differences and the effect of neighbourhood characteristics on individual health. J Epidemiol Community Health 2005;59:1022-8.
27 Merlo J, Yang M, Chaix B, et al. A brief conceptual tutorial of multilevel analysis in social epidemiology - investigating contextual phenomena in different groups of individuals. J
28 Walter SD. The analysis of regional patterns in health data. II. The power to detect environmental effects. Am J Epidemiol 1992;136:742-59.
29 Odland J. Spatial autocorrelation. Newbury Park, CA: Sage Publications, 1988.
30 Rice N, Carr-Hill R, Dixon P, et al. The influence of households on drinking behaviour: a multilevel analysis. Soc Sci Med 1998;46:971-9.
31 O'Campo P, Gielen AC, Faden RR, et al. Violence by male partners against women during the childbearing year: a contextual analysis. Am J Public Health 1995;85:1092-7. 32 Therneau T. Survival R package, version 2.20: (Accessed November 15, 2005, at
http://www.r-project.org/):(Available at http://www.r-project.org/).
33 Chaix B, Lindstrom M, Merlo J, et al. Neighbourhood social interactions and risk of acute myocardial infarction. J Epidemiol Community Health 2008;62:62-8.
34 Chaix B, Rosvall M, Merlo J. Recent increase of neighborhood socioeconomic effects on ischemic heart disease mortality: a multilevel survival analysis of two large Swedish cohorts.
Am J Epidemiol 2007;165:22-6.
35 Okura Y, Urban LH, Mahoney DW, et al. Agreement between self-report questionnaires and medical record data was substantial for diabetes, hypertension, myocardial infarction and stroke but not for heart failure. J Clin Epidemiol 2004;57:1096-103.
36 Metzger MH, Goldberg M, Chastang JF, et al. Factors associated with self-reporting of chronic health problems in the French GAZEL cohort. J Clin Epidemiol 2002;55:48-59. 37 Chaix B, Rosvall M, Merlo J. Assessment of the magnitude of geographic variations and socioeconomic contextual effects on ischaemic heart disease mortality: a multilevel survival analysis of a large Swedish cohort. J Epidemiol Community Health 2007;61:349-55.
38 Chaix B, Merlo J, Subramanian SV, et al. Comparison of a spatial perspective with the multilevel analytic approach in neighborhood studies: the case of mental and behavioral
disorders due to psychoactive substance use in Malmö, Sweden, 2001. Am J Epidemiol 2005;162:171-82.
39 Stjarne MK, Fritzell J, De Leon AP, et al. Neighborhood socioeconomic context, individual income and myocardial infarction. Epidemiology 2006;17:14-23.
40 Kolegard Stjarne M, Diderichsen F, Reuterwall C, et al. Socioeconomic context in area of living and risk of myocardial infarction: results from Stockholm Heart Epidemiology Program (SHEEP). J Epidemiol Community Health 2002;56:29-35.
41 Borrell LN, Diez Roux AV, Rose K, et al. Neighbourhood characteristics and mortality in the Atherosclerosis Risk in Communities Study. Int J Epidemiol 2004;33:398-407.
42 Diez Roux AV, Borrell LN, Haan M, et al. Neighbourhood environments and mortality in an elderly cohort: results from the cardiovascular health study. J Epidemiol Community
Health 2004;58:917-23.
43 Horne BD, Muhlestein JB, Lappe DL, et al. Less affluent area of residence and lesser-insured status predict an increased risk of death or myocardial infarction after angiographic diagnosis of coronary disease. Ann Epidemiol 2004;14:143-50.
44 Nordstrom CK, Diez Roux AV, Jackson SA, et al. The association of personal and neighborhood socioeconomic indicators with subclinical cardiovascular disease in an elderly cohort. The cardiovascular health study. Soc Sci Med 2004;59:2139-47.
45 Steenland K, Henley J, Calle E, et al. Individual- and area-level socioeconomic status variables as predictors of mortality in a cohort of 179,383 persons. Am J Epidemiol 2004;159:1047-56.
46 Stjarne MK, Ponce de Leon A, Hallqvist J. Contextual effects of social fragmentation and material deprivation on risk of myocardial infarction - results from the Stockholm Heart Epidemiology Program (SHEEP). Int J Epidemiol 2004;33:732-41.
47 Sundquist K, Winkleby M, Ahlen H, et al. Neighborhood socioeconomic environment and incidence of coronary heart disease: a follow-up study of 25,319 women and men in Sweden.
Am J Epidemiol 2004;159:655-62.
48 Lawlor DA, Davey Smith G, Patel R, et al. Life-course socioeconomic position, area deprivation, and coronary heart disease: findings from the British Women's Heart and Health Study. Am J Public Health 2005;95:91-7.
49 Carson AP, Rose KM, Catellier DJ, et al. Cumulative socioeconomic status across the life course and subclinical atherosclerosis. Ann Epidemiol 2007;17:296-303.
50 Rosvall M, Engstrom G, Hedblad B, et al. Area social characteristics and carotid atherosclerosis. Eur J Public Health 2007;17:333-9.
What this paper adds
What is already known on this subject?
Several studies have suggested that cardiovascular risk factors may partly mediate the well-documented association between socioeconomic environmental variables and coronary heart disease (CHD). However, previous studies have assessed the overall mediating role of
cardiovascular risk factors, but have never investigated the specific mediating role of each risk factor, not allowing disentangling their specific contribution to the area socioeconomic
position–CHD association.
What does this study add?
After estimating socioeconomic environmental effects on CHD, we assessed the extent to which this contextual effect was mediated by each of the CHD risk factors. When risk factors were introduced into the model for CHD, we observed a modest decrease in the association
between area socioeconomic position and CHD. Risk factors that contributed most to the association were smoking and cholesterol.