HAL Id: halshs-00727623
https://halshs.archives-ouvertes.fr/halshs-00727623
Submitted on 4 Sep 2012
HAL is a multi-disciplinary open access archive for the deposit and dissemination of sci-entific research documents, whether they are pub-lished or not. The documents may come from teaching and research institutions in France or
L’archive ouverte pluridisciplinaire HAL, est destinée au dépôt et à la diffusion de documents scientifiques de niveau recherche, publiés ou non, émanant des établissements d’enseignement et de recherche français ou étrangers, des laboratoires
The diffusion of regional innovation capabilities:
Evidence from Italian patent data
Francesco Quatraro
To cite this version:
Francesco Quatraro. The diffusion of regional innovation capabilities: Evidence from Italian patent data. Regional Studies, Taylor & Francis (Routledge), 2009, 43, pp.1333-1348. �halshs-00727623�
The Diffusion of Regional Innovation Capabilities:
Evidence from Italian Patent Data
1Francesco Quatraro
BRICK (Bureau of Research on Innovation, Complexity and Knowledge) Collegio Carlo Alberto, Moncalieri (Torino)
and
Laboratory of Economics of Innovation “F. Momigliano” Department of Economics University of Turin Tel. +390116704980 Fax + 390116703895 francesco.quatraro@unito.it ABSTRACT.
This paper investigates the diffusion of regional innovation capabilities within the manufacturing sector. The competence-based theory of the region allows for combining the Schumpeterian view upon innovation and business cycles and the growth poles theory. Innovation capabilities spread within the region after the expansion of the propulsive sector, due to learning dynamics. Adopting a methodology for the analysis of diffusion processes, the paper presents empirical evidence on Italian regions. The results show that in late-industrialized regions the diffusion of innovation capabilities is faster than in the early-industrialized ones. The role of R&D and complementary changes in the economic structure is also investigated.
1 Introduction
Different schools of thought have stressed the importance of innovation to regional competitive advantage in the last decades. On the one hand, the concept of learning regions refers to the capacity of areas featured by systemic ties, to enhance the creation of new knowledge and foster innovation (ASHEIM, 1996). On the other hand the Regional Innovation System (RIS) approach, drawing explicitly upon the notion of national innovation systems, has emphasized the relevance of interactive learning for the different kinds of actors involved in the innovation process (COOKE et al., 1997).
Besides these perspectives, a new one recently emerged which extends the concept of firms capabilities to the regional domain. FOSS (1996) proposed the concept of “higher-order capabilities”, i.e. capabilities going beyond the scope of single firm command, which may be key to regional competitive advantage. The idea has been further articulated in the competence-theory of the region, where new knowledge is created by combining both internal and external resources. The density and the quality of network relationships, as well as the appropriate institutional endowment, are the main pillars of regional capabilities. These have to be accumulated over time, as they stem from daily activities and interactions of economic agents (FOSS, 1996; LAWSON, 1999; LAWSON and LORENZ, 1999).
In particular, innovation capabilities may be defined as the degree of technological accumulation and the efficiency of search processes (DOSI, 1988). They emerge out of the learning process, and refers to the ability to both absorb and create technological knowledge (LALL, 1992). Areas characterized by institutional variety, high degrees of
proximity among the innovating agents, low communication costs and relevant knowledge externalities, will hence show better technological performances, other things being equal (ANTONELLI, 2000; PATRUCCO, 2003; BOSCHMA, 2005).
The appreciation of regional innovation capabilities provides an interesting bridge with Schumpeter’s business cycles theory. The geographical bearings of Schumpeter’s analysis have been emphasized by PERROUX (1955) and further articulated at regional level by THOMAS (1975). On the one hand radical innovations enable sustained economic growth by creating new industries within the regional economy. On the other hand it allows firms within an industry to gain competitiveness.
Innovation efforts tend to emerge with a sensible delay with respect to the expansion stage of the industry within which they are generated. This is due to a delayed diffusion of innovation capabilities (SCHUMPETER, 1939). Industries grouping around the dynamic core then develop the set of competences and skills that make it possible the systematic application of knowledge to economic activities through the working of interactive learning and network externalities. Innovation capabilities hence gradually emerge within the propulsive industry, and then spread to closely related industries.
In this paper we enquire into the emergence of regional innovation capabilities within the manufacturing sectors, by grafting the regional capabilities approach into the analytical framework of innovation diffusion (GRILICHES, 1957; MANSFIELD, 1961). We specifically focus on the diffusion of innovation capabilities within the
manufacturing sectors, using patent applications as a reliable proxy. The context of the analysis consists of the 20 Italian regions in the 1981-2003 period.
The case of Italy within this picture is very peculiar. Indeed, already in the 1970s eminent scholars maintained that the Italian economic system was characterized by a dualism in the industrial structure. On the one hand North-West regions were the cradle of modern industrial firms, and during the 1980s the manufacturing sectors had already completed their growth phase, leaving the floor to service industries. On the other hand, North-Eastern-Central (NEC) regions showed a delayed process of manufacturing activities, carried out mostly by small and medium sized enterprises (SMEs) often operating in peculiar economic and social environments (FUÀ, 1983). It follows that the Italian case provides a good benchmark to investigate the patterns of diffusion of innovating capabilities, and its relationships with the stages of industrial development.
In this context, the contribution of this paper to the literature is twofold. On the one hand it aims at rejuvenating a field of enquiry which has been lacking appropriate consideration since the 1980s. For this reason, the debate about the economic development of Italian regions has somehow missed the important opportunity of investigating cross-regional differences in the light of the economics of innovation. On the other hand, such an analysis is also relevant for its theoretical implications concerning the relationships between development patterns and technological change.
The remainder of the paper is organized as follows. In Section 2 we articulate the theoretical framework and the working hypotheses. Section 3 presents the background
economic context. Section 4 discusses the methodology and the data. In Section 5 we present the results of the empirical analysis. Finally the conclusions follow in Section 6.
2 Regional Industrial Development and the Diffusion of
Innovation Capabilities
Since the seminal contribution by SCHUMPETER (1911), innovation has been regarded as crucial to the process of economic development. The main agents of innovation firstly were new firms created by risk-taking entrepreneurs and then large corporations, which sacrifice static to dynamic efficiency (SCHUMPETER, 1942). PERROUX (1955) integrated the role of technological change in his “growth pole” theory following Schumpeter’s legacy. Regional economic systems are characterized by
rounds of growth, i.e. periods in which firms within the propulsive industry grow at
faster rates, propagating the positive effects across firms directly and indirectly relate to the propulsive industry. The main driving factor of such expansion is technical efficiency gained through innovation efforts.
The competitive forces driving the expansion of such an industry however do not work indefinitely. Sooner or later growth rates starts declining and a new industry is likely to emerge, as an effect of the introduction of radical innovations within the system. Within the new industry firms will innovate to gain competitive advantages and gales of innovations show up at some point in time. In the positive climate related to the expansion of the industry one firm will introduce an innovation, stimulating other creative agents.
THOMAS (1975) articulated the implications of Perroux’ framework on regional economic growth using a product life-cycle perspective, wherein the saturation of product markets are the main responsible for the slowdown of growth rates and the quest for innovations aims at opening new markets2. Although mainly focused on the
demand side, an important link is identified therein, i.e. the one between innovation as a process of creative destruction and the reduction of industry’s growth rates (KUZNETS, 1930; BURNS, 1934).
In the retardation theory framework new industries emerge as an effect of radical innovation. This generates a cycle which terminates when the related technological opportunities are exhausted. Of course, not all industries declines at the same time, and performances of a region are strictly related to its leading industry3. When the expansion
stage is exhausted, a clustering of innovations emerges within sectors, as an effect of delayed diffusion of innovation capabilities, which spread like a disease (SCHUMPETER, 1939). Innovating efforts are then stimulated in the decreasing stages of the business cycles by creative response mechanisms of firms which perceive the threat of new emerging sectors in the economic environment (SCHUMPETER, 1947).
The recent research on innovation capabilities enhances the understanding of the process through which they emerge in regional contexts. Within a context shaped by Schumpeterian competition, firms dynamic capabilities stand for the “ability to integrate, build, and reconfigure internal and external competences to address rapidly changing environments” (TEECE et al., 1997: p. 516). Innovation and technological
capabilities specifically denote the firm’s capacity to combine internal and external sources of both tacit and codified knowledge, directed towards the introduction of product and process innovations (LALL,1992; ANTONELLI, 1999).
The emphasis on external linkages calls the attention upon factors going beyond the firm level. Higher-order innovation capabilities relates to knowledge which resides in the region, and “emerge in a historical process from the systemic interaction among firms” (FOSS, 1996: p.3). The different institutions involved in the innovation process need time to learn to interact. This requires iterate interactions, the development of common communication codes and the availability of effective channels to access external knowledge. Such a kind of learning is highly localized in the specific context in which it takes place. As a result, regional innovation capabilities are highly idiosyncratic and related to the conditions of the economic and institutional environment, and hence they are difficult to replicate in the same way in other regions (LAWSON and LORENZ, 1999; ANTONELLI, 2000; ROMIJN and ALBU, 2002).
Different propulsive industries feature diverse regional systems. Long after the growth stages, innovation capabilities come out as the result of learning activities, which gradually infect creative agents. The grafting of innovation capabilities framework into the diffusion theory provides suitable methodological tools to investigate such dynamics at the regional aggregate level. The pioneering work in this respect is the analysis of diffusion of hybrid corn across US states, carried out by GRILICHES (1957).
Within epidemic models, bounded rationality, information asymmetries and networks effects are the major forces determining the characteristic S-shape of the diffusion process. Learning dynamics are gradual, and the working of communication channels is crucial to the diffusion of an innovation within a system. The increase in the number of adopters makes it available more information about the possible applications and consequences of the innovation, and hence it helps the diffusion process within the particular subset of the social system which is defined by the potential adopters. This gradually reduces the uncertainty about the innovation, and stimulates its adoption (GRILICHES, 1957; MANSFIELD, 1961; HALL, 2004).
According to the growth pole theory, industries tend to group around a central core of other industries, which act as catalyst to economic growth in the area. Proximity among firms enhances the probability of interactions and stimulates the flow of knowledge. Innovation capabilities within local contexts are thus likely to emerge as the result of an endogenous process in which firms within the propulsive industry play as pioneers. The emergence of local competences can hence be seen as the outcome of learning processes occurring in time, triggered by local interactions and network effects.
Therefore the development of innovation capabilities by firms needs time to both ignite and propagate. In the early stages of the innovation cycle a few firms innovate and the system is characterized by low levels of technological performance. The stimulus to innovate spread to other firms, which realize the benefit from innovating within a competitive context. Where possible, they eventually commit financial resources to more formalized search activities. Where internal R&D is not feasible due to financial
constraints, the availability of high quality public research centres within the region enhances the innovation capabilities of the system.
In such a context, the availability of effective protection tools may increase the returns to R&D. The higher returns to R&D in turn may well determine an increase in patenting activities (JAFFE, 2000; WEBSTER, 2004; KORTUM and LERNER, 2003). Moreover, patents also represent a tool through which firms can exchange knowledge on the markets, making it easier for interactive learning to work in environments characterized by the existence of strong systemic ties (LUNDVALL, 1992; ARORA et
al. , 2001; PEETERS and VAN POTTELSBERGHE, 2006).
Drawing upon the argument elaborated so far, we may now spell out our hypotheses as follows:
1) Regional innovation capabilities emerge over time, as an outcome of the increase of innovation activities within the system, and the working of learning dynamics which enhance agents’ capacity to interact and combine external with internal inputs. At the aggregate level this would amount to an initial exponential stage in which there is an explosion of technological performances, followed by a gradual saturation due to the infection of all potential innovators. 2) Regional innovation capabilities appear with a sensible delay with respect to the
expansion of the propulsive industry within the area. This leads us to expect that over the same period, the speed of diffusion of regional innovation capabilities
in an industry will be faster in areas where the expansion has come out late, than in areas where the same industry has developed earlier.
3) Regional innovation capabilities vary across different regions. In contexts characterized by the predominance of SMEs the interaction between firms and public research institutions is expected to be more crucial than in areas characterized by large firms.
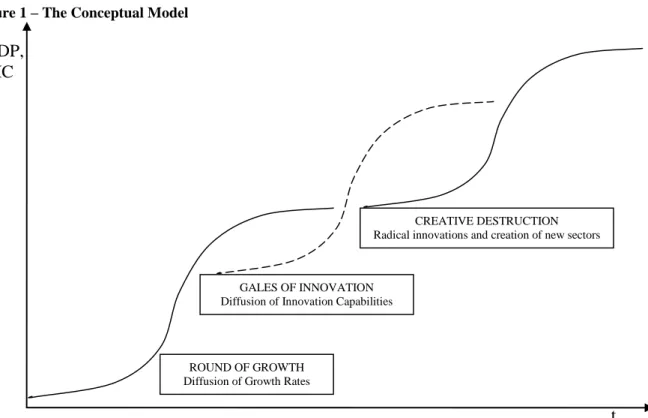
INSERT FIGURE 1 ABOUT HERE
Figure 1 summarizes the theoretical framework elaborated so far. Continuous lines refer to industry cycle, while the dashed line refers to innovation cycle. The focus of the empirical analysis will be mainly on the emergence of innovation capabilities within Italian regions in manufacturing sectors. However we firstly need to identify the different patterns the process of industrialization followed in different areas, in order to make it clear which one is early-industrialized and which is late-industrialized. This is the purpose of the following Section.
3 The Economic Context
In the 1950s most Italian regions were rural, and populated by a large share of small- and medium-sized enterprises, as opposed to North-Western regions, which specialized in manufacturing activities, carried out by large firms. Analyzing the distribution of growth rates and structural change at the regional level in the period 1950-1970, the Ancona School identified and found the clues of a successful diffusion process of manufacturing activities towards such rural regions in the North-East and eventually in
Central Italy, along the Adriatic coast. For this reason they proposed to group such regions into a larger macro-area which has been eventually called NEC (North-East-Centre)4. At the same time, the growth of manufacturing industries was slowing down
in the North-West, wherein the growth of business service industries was already in
nuce (PETTENATI, 1991; FUÀ and ZACCHIA, 1983).
Different factors were proposed in the 1970s as conducive to the successful territorial diffusion of manufacturing activities towards the NEC. On the one hand it has been argued that the widespread presence of small- and medium-sized firms contributed to create a favourable environment, characterized by low costs of living, intense utilization of labour potential, and the persistence of pretty informal labour relationships. Firms in turn benefited from these peculiarities in terms of lower costs and better business efficiency. Moreover they maintained that the small size scale and the specialization in labour-intensive activities, permitted in many ways swifter adaptation to changes in markets and technologies (FUÀ, 1983, 1991a and 1991b; FUÀ and ZACCHIA, 1983; GAROFOLI, 1981 and 1983).
On the other hand the relevance of the features of the social texture has been stressed, whereby the traditions rooted into the sharecropping system largely drawing on the informal institution of the “extended family” were persisting. The gradual diffusion of manufacturing did not seem to be paralleled by a simultaneous change of the social organization. Low wages and temporary jobs were accepted because of the weakness of labour market as an institution, substituted by the “extended family” which worked as a real self-regulatory system. In such a context dynamic pressures and attitude toward
self-employment represented a key factor for the successful creation of manufacturing enterprises5 (PACI, 1973 and 1992). The boosting role of institutional factors (above all
embedded in the labour market) and the peculiarities of the economic structure, were maintained to lead to the set of positive-feedbacks well described by the industrial district theorists (BRUSCO, 1982; BECATTINI, 1989).
3.1 The Recent Evidence
To investigate the persistence of late industrialization and its geographical distribution, we use time series data on employment at the regional level, drawn from the Italian National Institute of Statistics (ISTAT). The issue of territorial diffusion of manufacturing activities can be addressed by looking at the dynamics of regional specialization index, defined as the region’s relative share of employment within an industry. Formally it is defined as employment in sector i located in region j at time t (ILijt), divided by the region’s total employment in all industries, compared to the same
measure at the national level6.
In Table 1 we report the results of the calculations for manufacturing industries7. North-Western and NEC regions are characterized by well differentiated patterns. The former indeed show up decreasing values, both as an aggregate and singling out the regions. The Lombardy and Piedmont regions are characterized by the highest specialization indexes in 1982. It must be considered that, according to Fuà and his colleagues, the process of territorial diffusion started in the late 1960s.
This is the reason why regions like Veneto, Emilia-Romagna, Umbria and Marches are characterized by values just slightly lower than in the above mentioned North-Western regions. The main important aspect is that the North-Eastern and Central regions are characterized by specialization indexes increasing over time. It is worth stressing that in Veneto and Marches the specialization in manufacturing grew very impressively along the 1980s (respectively +13.6% and +19.6% in the period 1981-1991), slowing down in 1990s (but still growing). In Emilia-Romagna and Molise its growth was sustained both in the 1980s and the 1990s, while in the Umbria region the index decreased until the first half of the 1990s, and then started increasing steadily. At the end of the observed period, it seems that North-Eastern and Central regions are characterized by specialization indexes very close to (and in the case of Marches even higher than) the values featuring North-Western regions. Moreover the trend appears to be soundly positive in the former, while the values in the latter are continuously decreasing since the early 1980s.
4 Data and Methodology
The empirical analysis of the diffusion of regional innovation capabilities within manufacturing sectors in Italy, is based on the evidence about the evolution of patent applications to the EPO8. The limits of patent statistics as indicators of innovation
activities are well known. The main drawbacks can be summarized in their sector-specificity, the existence of non patentable innovations and the fact that they are not the only protecting tool. Moreover the propensity to patent tends to vary over time as a
function of the cost of patenting, and it is more likely to feature large firms (PAVITT, 1985; LEVIN et al., 1987; GRILICHES, 1990).
Nevertheless, previous studies highlighted the usefulness of patents as measures of production of new knowledge, above all in the context of analyses of innovation performances at the aggregate regional level (ACS et al., 2002). Besides the debate about patents as an output rather than an input of innovation activities, empirical analyses showed that patents and R&D are dominated by a contemporaneous relationship, providing further support to the use of patents as a good proxy of innovation (HALL et al., 1986).
The emergence of regional innovation capabilities manifest itself in high quality innovation processes, wherein firms commit internal resources to R&D and cooperate with other firms and R&D institutions. Patenting represents the last stage of this process. The application to the European Patent Office is a time- and resource-consuming process, which is likely to exert an ex-ante selection of the innovations to be patented. This allows us to identify high-value innovations stemming from systematic more formalized innovation efforts, which are precisely the object of our analysis.
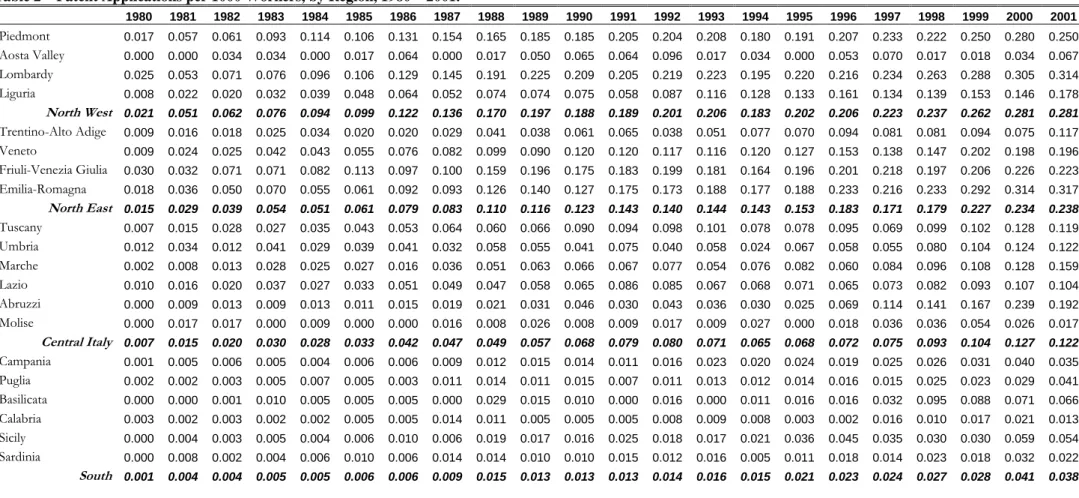
Table 2 provides empirical evidence of the regional diffusion of innovation capabilities9, over the time span 1980-2001. Absolute value data about patent
applications are not that suitable for comparative purposes, due to cross-regional dimensional differences. In order to investigate the diffusion of innovation capabilities the data about patent applications need to be somehow normalized. Different
alternatives could apply to the case. First of all we ruled out population statistics, in that their link with innovation variables is too weak and difficult to assess10. A variable
related to the dimension of the production system would be more appropriate to our analysis. The alternatives are thus either the regional number of firms or the number of workers. The former seem to be inappropriate as there can be a bias towards those areas characterized by a large number of small and medium-sized firms, with the consequent underestimation of dimensions in areas characterized by a lower number of large firms. Thus we decided to take the number of patent applications per worker as the indicator of the level of diffusion of innovation capabilities within each region.
INSERT TABLE 2 ABOUT HERE
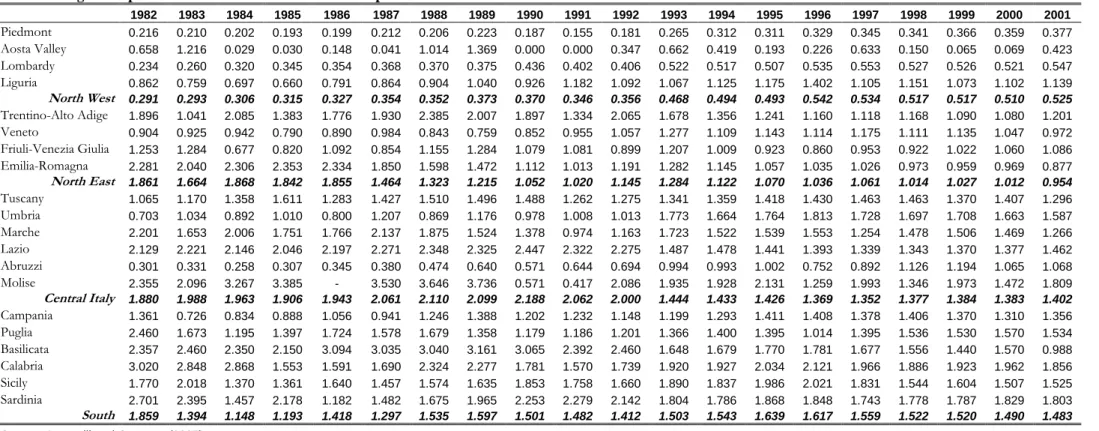
With the help of Figure 2, we focus on the differences among early- and late-industrialized regions. As far as the former are concerned, the dynamics of Lombardy and Piedmont are characterized by high levels in the early 1980s in both of them, but in 1988 it can be noted a further speeding up of Lombardy which clearly overtake Piedmont, outperforming it until 2001. Around 1991 the growth of patent applications begins to slow down in both regions, but more markedly in Piedmont. The evidence about Emilia-Romagna is of much interest for the purpose of our analysis. Indeed the diffusion of patent applications seem to be more sustained all over the period observed. Innovation capabilities diffuse at a very fast pace, such that Emilia-Romagna outperformed Piedmont already in 1998 and Lombardy in 1999. Friuli-Venezia Giulia and Veneto are characterized by fairly opposite dynamics, as the former appears to grow sensibly along the 1980s and then slowing down in the 1990s, while the latter is
characterized by modest growth rate until the late 1990s, and then a sudden acceleration. Finally Umbria, Marches and Abruzzi show up dynamics very similar to Veneto’s, in that the hastening of growth in patent applications can be devised around 1995.
INSERT FIGURE 2 ABOUT HERE
In Table 3 we report the breakdown of quinquennial growth rates of patent applications by region. It is evident that in most Italian regions in the period such growth rates were higher in the first five years, then it lowers in the second one, becoming even negative in the third one. The last quinquennial is then characterized by very low growth rates. It is moreover fair to note that in the first five years the growth rates of Piedmont and Lombardy were higher than those of Emilia-Romagna, Marches and Umbria, while in the last five years the situation is reversed, the latter showing higher growth rates then the former. The evidence in Tables 2 and 3 shows that, with obvious cross-regional differences in absolute levels, the dynamics of patent applications across Italian regions are interpretable as a diffusion process. Insofar as patents are reliable indicators of innovative activity, the sequence of growth rates suggests that innovation capabilities have diffused in most Italian regions following an S-shaped time path, and that the patterns characterizing North-Eastern-Central regions are different from those characterizing North-Western regions.
In conclusion, the preliminary evidence about data applications appears to suggest that the territorial diffusion of manufacturing activities is still ongoing in the North-East-Central regions, as they are sustained by the diffusion of innovation capabilities, and the consequent advantages stemming from innovation. Emilia-Romagna seems to be the leading region in such a process, whereby Marches, Abruzzi and to some extent Umbria are the immediate followers. The case for a possible extension towards Molise and Puglia seems very difficult to assess, as the data up to 2001 are not very supportive.
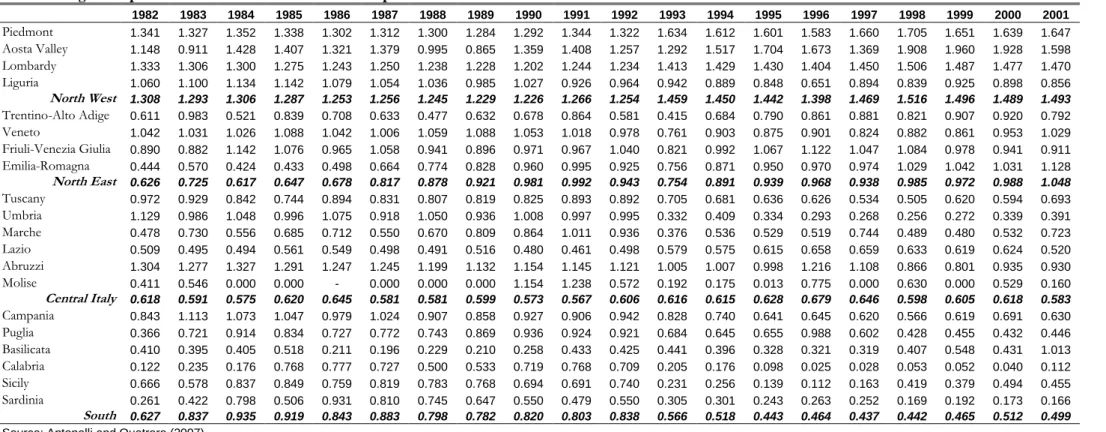
The regional aggregate data on R&D expenditure, both private and public, have been drawn from the ISTAT to provide a suggestive evidence of the increase in the availability of the knowledge stock accessible in the area11. To gain better
understanding of the regional dynamics, in Tables 4 and 5 we calculated a regional specialization index for public and private R&D expenditure, defined as R&D in sector
i (public vs. private) located in region j at time t, divided by the region’s total R&D
expenditure, compared to the same measure at the national level. It is straightforward from the data that North Western regions are characterized by strong concentration of private R&D expenditure, with the only exception of the Liguria region. The Piedmont region turned out to have the highest value for the index, followed by Valle d’Aosta and Lombardy. Some regions with an index value above 1 can be found also in the North-East. They are Veneto and Emilia-Romagna, which is not so surprising considering that high tech sectors increasingly gained relevance in the area, due to the local positive feedbacks characterizing the upgrading from consumer goods to dedicated capital goods of the manufacturing activity in the area. In the remainder regions the value of the index is below one, above all in the regions along the Adriatic coast.
As far as the public R&D expenditure is concerned, of course in the North-West the only region that can be defined public-R&D-intensive is the Liguria one. It is worth noting that in the North-East, the value of the index for Emilia-Romagna and Veneto is just slightly below 1. This means that in the area the public and the private inputs for innovative activity are pretty balanced. The highest value for the index can be found in the regions along the Adriatic coast, and in Southern Italy in general.
INSERT TABLES 4 AND 5 ABOUT HERE
Thus the Italian case seems to be characterized by a clear and strong divide also according to the path of change followed by the old industrialized regions and the late industrializing ones. While within the former firms seem exposed to raising problems, unable to cope with the decline of performances in both domestic and international markets, in the latter they seem better able to take advantage of the new technologies by means of a process of creative adoption (Quatraro, 2007).
4.1 Econometric Strategy
The econometric strategy is articulated in two steps. Firstly, in order to estimate the different rates of diffusion of patent application across Italian regions, we use the standard logistic equations proposed by GRILICHES (1957) and MANSFIELD (1961). A similar exercise was put forth by ANDERSEN (1999) in her analysis of differential growth rates at the industry level12. The logistic function can formally be written as
t e K P 1
(2)
where P is the level of adoption, t the time and K the ceiling. The features of this curve are well known, in that it is asymptotic to 0 and K, it is symmetric around the inflexion point and its time derivative is dP/dt = -b/(P/K)(K-P), which confers the S-shape. Equation (2) is well suited to represent the diffusion process as the result of learning and imitation dynamics. It can be rearranged dividing both sides by (K-P) and taking logs, to obtain the following econometric specification:
t P K P t t ln (3)
Secondly, we investigate the relationships diffusion of innovation capabilities and structural change on the one hand, and the links with the availability of accessible knowledge stocks on the other. This is done by taking the estimated time coefficients from the logistic fit and regressing them as follows:
u TRA d FIN c MAN b a i i i i (4) z GRPRD n GRPUR m GRGFI h e i i i i (5)
Where β clearly stands for the estimated time coefficients of the logistic equation, and u and z are the respective error terms. In Equation (4) MAN, FIN and TRA are respectively
the average annual growth rates of the employment share of manufacturing, finance business services and trade industries. In Equation (5) the rates of diffusion are instead regressed against the average growth rate of public and private R&D (respectively
GRPUD and GRPRD), plus the average annual growth rate of gross fixed investment
(GRGFI) as control variable accounting for the embodiment hypothesis.
5 The Empirical Results
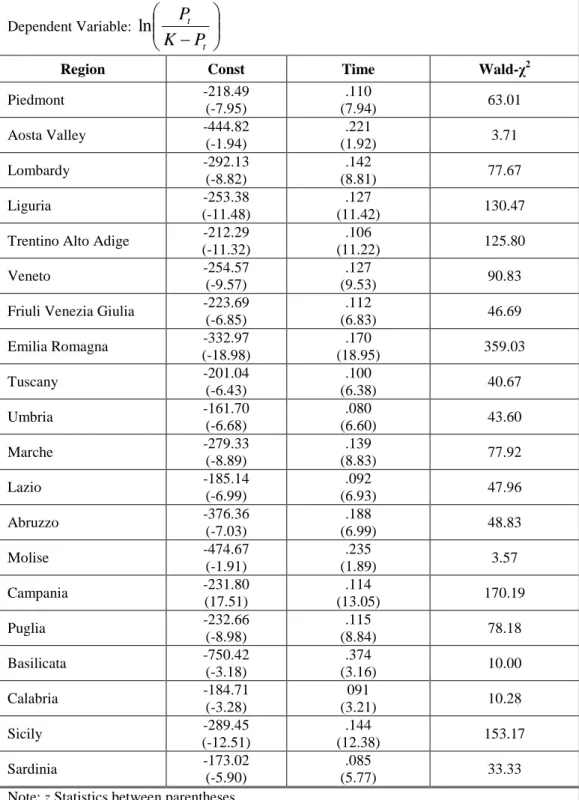
In order to investigate the patterns of diffusion of innovation capabilities within regional contexts we fitted the data by using the logistic function specified in Equation (3)13. Due
to the problem of auto correlated disturbances affecting this kind of time series relationship, the choice of a Chi-square estimator seemed to be the most appropriate. We thus carried out a feasible GLS regression by region, yielding the results displayed in Table 6. The coefficient β is interpreted as the rate at which local competences emerged over time. In this case, through the diffusion of patents applications, we obtain a measure of how fast the innovation capabilities have spread within each Italian region in the period 1981-2001. Although this measure is affected by the definition of K, nonetheless it can provide very useful information to understanding regional differences in economic and industrial dynamics. In particular, we start with a simple comparison among the different levels of β yielded in each region.
INSERT TABLE 6 ABOUT HERE
North-Eastern and Central regions is very instructive. Actually, within this subgroup the first rank goes to the Abruzzi region, immediately followed by Emilia-Romagna and Marches, while the Umbria region instead features a low coefficient. At a comparative level it is worth noting that the speed at which innovation capabilities spread within the Abruzzi region is 76.6% greater than that of Piedmont and 40% than that of Lombardy. For what concerns the Emilia-Romagna region the magnitude of the difference is of +55.1% and +23% as compared to Lombardy and Piedmont respectively. The Marches region has a β value 25.2% higher than that of Piedmont, but almost equal to that of Lombardy. It must be also noted that the rate of appearance in Liguria is in between that of Piedmont and that Lombardy The results of the econometric estimations therefore provide strong support not only to the idea that the emergence of innovation capabilities followed a logistic path, but also to the hypothesis concerning cross-regional differences. Some regions in the North-East-Centre, specifically Emilia-Romagna, Marches and Abruzzi are characterized by diffusion rates systematically higher than those of Piedmont, and equal or higher to those of Lombardy. The Emilia-Romagna region, in particular, can be considered as the first region in the North-East-Centre side of Italy in which the diffusion of innovation capabilities took place, while Abruzzi and Marches seem to follow it with a slight delay14.
As far as the relationship between the emergence of innovation capabilities and the change in the economic structure is concerned, Equation (4) has been estimated through OLS with robust standard errors. The estimation yielded the following results:
(2.89) (-1.57) (0.59)
F = 2.93, t of Student between parentheses. As expected the coefficient on the growth rate of the employment share of manufacturing industries is positive and significant, while the coefficients for the two service industries are not statistically significant. The evidence of higher diffusion rates of innovation capabilities in some NEC regions is hence to be related to the evidence, already presented in Section 2, about the enduring growth of manufacturing activities in the area. This process could be thus interpreted as a specific stage in the development of manufacturing activities, according to which learning dynamics and the increasing international competition are likely to foster innovative efforts, as long as technological opportunities are at the same time on hand.
In this direction the availability of an accessible knowledge stock is supposed to be closely related to the diffusion of innovation capabilities. To this purpose Equation (5) has been estimated through OLS with Huber-White heteroscedastic consistent standard errors. The econometric test yielded the following result:
β = 0.172 - 0.026∙GRGFI + 0.076 ∙10-3∙GRPRD*** + 0.379∙10-3∙GRPUR ***
(7)
(-1.06) (3.05) (3.74)
F=84.9, t of Student between parentheses (coefficients on R&D are both significant at 1%). It is worth emphasizing that the coefficient on public R&D is far larger than that on private one. This confirms that faster rates of diffusion of innovation, and faster rates of public R&D, are at the heart of the process leading to faster growth rates in late-industrializing regions. The stronger impact of public R&D also suggests that the
absorption of formal inventive activity within firms’ productive routine doesn’t imply necessarily a parallel process of dimensional growth. It is likely that within areas characterized by local capitalism, firms may also outsource R&D services, particularly relying on the public knowledge infrastructure. In this direction, it is worth mentioning that also the organization of public R&D labs (say the National Research Council) is becoming more and more functional to the needs of local production systems, trying to exploit the advantages of the competencies and the reputation that such areas gained in some particular markets (CNR, 2005).
6 Concluding Remarks
In this paper we tried to shed new light onto the persistent process of diffusion of manufacturing activities, integrating the analysis with the study of the regional patterns of innovation within the NEC regions. While in the 1970s the explanations were mainly based on aspects related to institutional conditions and the structure of local economic and social systems, we proposed an interpretation in the light of the economics of innovation. The combination between the diffusion theory and the concept of growth poles has allowed us to appreciate the emerging development of innovation capabilities within the late-industrializing regions.
Growth poles theory suggest that regions are dominated by propulsive industries, which act as catalyst to economic performances of close economic activities. Core industries however are not evenly distributed across regions and they are not static, as mature industries within regional contexts are possibly characterized by slackening growth rates, while some other industries gain momentum (PERROUX, 1955; FUÀ 1983).
The emergence of innovation capabilities within a regional context is strictly related to the relative stage of development of the propulsive industry and of its related industries. Therefore, regions in which the process of industrialization occurred with some delay, are also likely to experience a delayed emergence of innovation capabilities within the manufacturing sectors. The competences about how to innovate spread over time as the outcome of learning dynamics, in which local interactions and networking play a crucial role.
The results obtained through the analysis of the diffusion of patent applications strongly support the hypothesis according to which the NEC regions are still exploiting the advantages of the late industrialization. The exploitation of the innovative potential stemming from learning dynamics is actually fed by the parallel growth of technological opportunities and the strengthening of the productive system. Indeed the thickening of the manufacturing production system and the increasing availability of accessible knowledge stock proved to be positive related to the rate of diffusion of innovation capabilities across Italian regions.
It is also fair to note that in the econometric test the impact of public R&D expenditure on the speed of diffusion of innovation capabilities, turned out to be far higher than that of private R&D expenditure. This suggests that the idiosyncratic features of the regions mostly affected by the process played a crucial role. The increasing availability of public knowledge represents a competitive advantage, provided the existence of conditions enabling knowledge communication and absorption. This is the case for
many areas in the NEC regions, wherein the dynamics typical of industrial districts have allowed for the evolution towards either technology districts, or technology-based industrial districts.
Along the lines of Kuznets, industrial development does not take a unique shape, but followed different paths according to the specific regional characteristics of economic activities. The capitalization of the benefits stemming from innovation can be, in this light, interpreted as a distinct stage in the industrialization process, which characterizes an industry as old enough to properly manage emerging technological opportunities, but not so mature to incur in the slackening of growth rates.
NOTES
1 Part of the background research for this paper has been carried out during my visiting periods at the
CRIC – University of Manchester and at the Columbia University of New York. Preliminary versions was presented at the CESPRI lunch seminar at the Bocconi University of Milan on 10 May 2006, the CRIC “Monday afternoon” seminar at the University of Manchester on 7 July 2006 and the Annual CCC Doctoral Colloquium held at the GeorgiaTech College of Management in Atlanta on 13-15 April 2007. I wish to thank Cristiano Antonelli, Davide Consoli, Giovanni Dosi, Roberto Mazzoleni, Stan Metcalfe, Dick Nelson, Pier Paolo Patrucco and two anonymous referees for their useful comments. The usual disclaimers on errors and inadequacies apply.
3
The theory about the retardation of growth rates of mature industries was elaborated by KUZNETS (1930) by considering the evolution of industries within different countries. Like all models it maybe provides a simplified view of reality, which nonetheless enhances the understanding of evolutionary processes at aggregate levels. This perspective was then successfully articulated also at the regional level by Giorgio Fuà and subsequentely by the scholars belonging to the so-called School of Ancona, e.g. FUÀ (1977), GAROFOLI (1981) and PETTENATI (1991).
4
The grouping of Italian regions is as follows. North-West: Piedmont, Lombardy, Valle d’Aosta and Liguria. North-East: Veneto, Emilia-Romagna, Friuli Venezia-Giulia,Trentino Alto-Adige. Centre: Tuscany, Abruzzi, Marches, Lazio, Umbria and Molise. South: Campania, Apulia, Calabria, Basilicata, Sicilia and Sardegna.
5
The empirical analysis carried out by GAROFOLI (1994) addresses the issue of firms creation very exhaustively. 6
i j ijt j ijt i ijt ijt t i IL IL IL IL S, 7 ISIC 15-37.8 The debate about the nature of innovation activities within service sectors have recently received
increasing attention. TETHER (2005) and CONSOLI (2007) offer good critical syntheses of it. EVANGELISTA and SIRILLI (1998) and EVANGELISTA (2000) present the Italian evidence, emphasizing the very marginal role played by patents in innovation dynamics within service sectors.
9 Patent applications are classified according to the inventor’s residence address. 10 As also emphasized by KUZNETS (1930).
11 Time series concerning public and private R&D expenditure at the regional level are available since
1982 on. Moreover, it is worth noting that public expenditure is not comprehensive of expenditure by Universities, as these data are available since 1993 on.
12 S-shaped curves were used also in the study of business cycles, many years before they entered the
study of technological change. It is fair to recall, in this direction, the works by KUZNETS (1930) and MERTON (1935).
13
The fit of the logistic equation through linear techniques allow for estimating two parameters, requiring the ceiling to be specified ex-ante. As a reference, we used the overall maximum value of the dependent variable, and we multiplied it by the annual average growth rate of added value in manufacturing industries.
14
These results are consistent with the empirical analyses carried out by PATRUCCO (2005) concerning the Emilia-Romagna technology district, the works by BELUSSI (2003) and by BELUSSI and ARCANGELI (1998) concerning both the North-Eastern regions, and BELUSSI (1999), QUATRARO (2005) and BOSCHMA and TER VAL (2005) for more recent evidence about Southern regions. The work at the aggregate level by CAINELLI and DE LISO (2005) is also particularly interesting in pinpointing innovation dynamics within Italian industrial districts. It is worth stressing that in some contexts the evolution of the industrial structure is led by the emergence of groups of firms within the districts, i.e. by peculiar forms of evolution of local capitalism (BRIOSCHI et al., 2002; CAINELLI et
References
ACS Z.J., L. ANSELIN and A. VARGA (2002) Patents and innovation counts as measures of regional production of new knoweldge, Research Policy, 31, 1069-1085.
ANDERSEN, B. (1999) The hunt for s-shaped growth paths in technological innovation: A patent study, Journal of Evolutionary Economics, 9, 487-526.
ANTONELLI C. (1999) The microdynamics of technological change, Routledge, London. ANTONELLI C. (2000) Collective knowledge communication and innovation: The evidence of technological districts, Regional Studies, 34, 535-547.
ANTONELLI C. and QUATRARO F. (2007), Information and communication technologies and productivity growth: How to disentangle creative adoption from radical innovation. The Italian evidence, 1981-2001, Department of Economics, University of Torino, mimeo.
ARORA, A., A. FOSFURI. and A. GAMBARDELLA, A. (2001) Markets for technology, Cambridge, MIT Press.
ASHEIM B. T. (1996) Industrial districts as ‘learning regions’: A condition for prosperity,
European Planning Studies, 4, 379-400.
BECATTINI G. (1989) Modelli Locali di Sviluppo, Bologna, Il Mulino.
BELUSSI F. (1999) Path Dependency vs. Industrial Dynamics: An Analysis of Two Heterogeneous Districts, Human Systems Management, 18, 161-174.
BELUSSI F. (2003) The Generation of Contextual Knowledge. The Case of the Packaging Machinery Industry in The Bologna District in Belussi, F., Gottardi, G., and Rullani, E. (Eds) The
Technological Evolution of Industrial Districts, Boston, Kluwer Academic.
BOSHMA R. (2005) Proximity and Innovation: A critical assessment, Regional Studies, 39, 61-74.
BOSCHMA, R. and A.L.J. TER VAL (2005), Knowledge Networks and Innovative Performances in an Industrial District. The Case of a Footwear District in the South of Italy, Papers in Evolutionary Economic Geography n. 06.01, University of Utrecht.
BRIOSCHI, F., M. S. BRIOSCHI and G. CAINELLI, G. (2002) From the industrial district to the district group: An insight into the revolution of local capitalism in Italy, Regional Studies, 36, 1037-1052.
BRUSCO, S., 1982, The Emilian model: Productive decentralization and social integration,
Cambridge Journal of Economics, 6, 167-184.
BURNS A. F. (1934) Production trends in the United States since 1870, Boston, NBER. CAINELLI, G. and N. DE LISO (2005) Innovation in industrial districts: Evidence from Italy, Industry and Innovation, 383-398.
CAINELLI, G., D. IACOBUCCI and MORGANTI, E. (2006) Spatial agglomeration and business groups: New evidence from industrial districts, Regional Studies, 40, 507-518.
CNR (National Research Council) (2005), Piano Annuale 2005, http://www.cnr.it/documenti/DocumentiProgrammatici/PA2005_07MaterialieDispositivi.pdf
CONSOLI D. (2007) Services and Systemic Innovation: A Cross-Sectoral Analysis, Journal
of Institutional Economics, 3, 71-89.
COOKE P., M. URANGA and G. ETXEBARRIA (1997) Regional innovation systems: Institutional and organizational dimensions, Research Policy, 26, 475-491.
DOSI G. (1988) Sources, procedures and microeconomic effects of innovation, Economic
Journal, 26, 1120-1171.
EVANGELISTA R. (2000) Sectoral patterns of technological change in services, Economics
EVANGELISTA, R. and G. SIRILLI (1998) Innovation in the service sector. results from the Italian innovation survey, Technological Forecasting and Social Change, 58, 251-269.
FOSS N. J. (1996) Higher-order industrial capabilities and competitive advantage, Journal of
Industrial Studies, 3, 1-20.
FUÀ G. (ed) (1991a) Orientamenti per la Politica del Territorio, Bologna, il Mulino.
FUÀ, G (1991b) The environmental bases of diffuse industrialization, International Studies of
Management & Organization, vol. XXI, n. 1, pp. 5-20.
FUÀ G. (1983) Industrializzazione nel Nord Est e nel Centro, in G. Fuà e C. Zacchia (ed.),
Industrializzazione senza fratture, Bologna, il Mulino, pp. 7-46.
FUÀ G. (1977) Sviluppo ritardato e dualismo, Moneta e Credito, pp. 355-366.
FUÀ G. and C. ZACCHIA (eds.) (1983) Industrializzazione senza fratture, Bologna, il Mulino.
GAROFOLI G. (1994) New firm formation and regional development: The Italian case,
Regional Studies, 28, 381-393.
GAROFOLI G. (1981) Lo Sviluppo delle aree periferiche nell’economia italiana degli anni Settanta, L’Industria, a. II, n. 3, pp. 391-404.
GAROFOLI G. (1983) Aree di specializzazione produttiva e piccole imprese in Europa,
Economia Marche, a. II, n. 1, pp. 3-43.
GRILICHES, Z. (1957) Hybrid corn: An exploration in the economics of technological change, Econometrica, 25, 501-522.
GRILICHES Z. (1990) Patent statistics as economic indicators: A survey, Journal of
Economic Literature, 28, 1661-1707.
HALL, B.H., Z. GRILICHES and J. A. HAUSMAN (1986) Patents and R and D: Is There a Lag?, International Economic Review, 27, 265-283.
JAFFE A. B. (2000), The US patent system in transition: Policy innovation and the innovation process, Research Policy, 29, 531-557.
KLEPPER S. (1997) Industry life cycles, Industrial and Corporate Change, 6, 145-181. KORTUM S. and J. LERNER (2003) Unravelling the Patent Paradox, AEA Annual Meeting, Washington, DC, 2003.
KUZNETS S. (1930) Secular Movements in Production and Prices, Boston, Houghton Mifflin.
LALL S. (1992) Technological capabilities and industrialization, World Development, 20, 165-186.
LAWSON C. (1999) Towards a competence theory of the region, Cambridge Journal of
Economics, 23, 151-166.
LAWSON C. and E. LORENZ (1999) Collective learning, tacit knowledge and regional innovative capacity, Regional Studies, 33, 305-317.
LEVIN R.C., A.K. KLEVORICH, R.R. NELSON and S.G. WINTER (1987), Appropriating the returns from industrial research and development, Brooking Papers on Economic Activity, 3, 783-831.
LUNDVALL B.A. (ed.) (1992) National Systems of Innovation, London, Pinters.
MANSFIELD E. (1961) Technical change and the rate of imitation, Econometrica, 29, 741-766.
MERTON R.K. (1935) Fluctuations in the rate of industrial invention, Quarterly Journal of
Economics, 49, 454-474.
PACI M. (1973) Mercato del Lavoro e Classi Sociali in Italia. Ricerche sulla Composizione
PATRUCCO P.P. (2003) Institutional variety, networking and knowledge exchange: Communication and innovation in the case of the Brianza technological district, Regional Studies, 37, 159-172.
PATRUCCO P.P. (2005) The emergence of technology systems: Knowledge production and distribution in the case of the Emilian plastics district, Cambridge Journal of Economics, 29, 37-56.
PAVITT K. (1985) Patent statistics as indicators of innovative activities: Possibilities and problems, Scientometrics, 7, 77-99.
PEETERS, C. and B. VAN POTTELSBERGHE (2006) Innovation strategy and the patenting behavior of firms, Journal of Evolutionary Economics, 16, 109-135.
PERROUX F. (1955) Note sur la notion de ‘pole de croissance’, Èconomie Appliquèe, 7, 307-320.
PETTENATI P. (1991) I Modelli di Organizzazione Economica del Territorio, in Fuà, (ed).,
Orientamenti per la Politica del Territorio, Bologna, Il Mulino.
QUATRARO, F. (2005) A Schumpeterian approach to innovation clustering in a low-tech technology in a peripheral region: The case of garments in Mezzogiorno, Innovation: Management,
Policy& Practice, 7, 435-450.
QUATRARO F. (2007) Change vs. decline: A comparative analysis of the evolution of TFP in Italian regions, with a particular attention to the case of Turin, International Review of
Economics, 54, 86-105.
ROMIJN H. and M. ALBU (2002) Innovation, networking and proximity: Lessons from small high technology firms in the UK, Regional Studies, 36, 81-86.
SCHUMPETER J. A. (1911) (1934) The theory of economic development, Galaxy Books, Oxford.
SCHUMPETER J. A. (1939) Business cycles. A theoretical, historical and statistical analysis
SCHUMPETER J. A. (1947) The creative response in economic history, Journal of Economic
History, 7, 149-159.
TEECE D, G. PISANO and A. SHUEN (1997) Dynamics capabilities and strategic management, Strategic Management Journal, 18, 509-533.
TETHER B. (2005) Do services innovate (differently)? Insights from the European innobarometer survey, Industry and Innovation, 12, 153-184.
THOMAS M. J. (1975) Growth pole theory, technological change and regional economic growth, Papers in Regional Science, 34, 3-25.
WEBSTER E. (2004) Firms’ decisions to innovate and innovation routines, Economics of
Figure 1 – The Conceptual Model GDP,
RIC
t
ROUND OF GROWTH Diffusion of Growth Rates
GALES OF INNOVATION Diffusion of Innovation Capabilities
CREATIVE DESTRUCTION Radical innovations and creation of new sectors
Figure 2 – Diffusion of Innovating Capabilties in Early- and Late-Industrialized Regions 0.000 0.050 0.100 0.150 0.200 0.250 0.300 0.350 1980 1981 1982 1983 1984 1985 1986 1987 1988 1989 1990 1991 1992 1993 1994 1995 1996 1997 1998 1999 2000 2001 Piedmont Lombardy Liguria Venetia Friuli-Venezia Giulia Emilia-Romagna Umbria Marche Abruzzi
Source: Elaborations on EPO and ISTAT Data. Note: Patent Applications per 1000 Workers on Y-axis.
Table 1 - Regional Specialization Index for Manufacturing Sectors† 1980 1981 1982 1983 1984 1985 1986 1987 1988 1989 1990 1991 1992 1993 1994 1995 1996 1997 1998 1999 2000 2001 Piedmont 1.362 1.359 1.381 1.369 1.319 1.333 1.350 1.376 1.389 1.380 1.358 1.313 1.290 1.257 1.277 1.291 1.290 1.300 1.306 1.285 1.280 1.278 Aosta Valley 0.720 0.737 0.781 0.823 0.786 0.744 0.711 0.655 0.668 0.594 0.578 0.583 0.579 0.558 0.561 0.531 0.538 0.548 0.567 0.554 0.536 0.548 Lombardy 1.505 1.503 1.499 1.500 1.478 1.469 1.459 1.440 1.407 1.416 1.445 1.416 1.428 1.447 1.434 1.404 1.395 1.377 1.381 1.361 1.355 1.355 Liguria 0.783 0.769 0.756 0.758 0.740 0.698 0.681 0.700 0.657 0.670 0.659 0.652 0.658 0.619 0.631 0.627 0.626 0.615 0.602 0.615 0.655 0.644 North West 1.377 1.374 1.379 1.378 1.346 1.339 1.338 1.337 1.317 1.321 1.333 1.303 1.305 1.303 1.304 1.290 1.285 1.275 1.278 1.262 1.261 1.259 Trentino-Alto Adige 0.657 0.655 0.641 0.643 0.696 0.656 0.654 0.697 0.724 0.698 0.691 0.688 0.725 0.709 0.708 0.701 0.709 0.718 0.705 0.713 0.716 0.733 Veneto 1.230 1.198 1.213 1.213 1.265 1.343 1.320 1.307 1.326 1.344 1.346 1.361 1.349 1.383 1.360 1.372 1.384 1.397 1.397 1.403 1.381 1.370 Friuli-Venezia Giulia 0.971 0.898 0.911 0.909 0.910 0.927 0.953 0.978 0.993 1.001 0.993 1.014 0.999 1.016 1.005 1.054 1.082 1.101 1.080 1.049 1.061 1.036 Emilia-Romagna 1.112 1.141 1.157 1.162 1.213 1.220 1.222 1.270 1.280 1.274 1.247 1.196 1.200 1.207 1.215 1.218 1.218 1.222 1.233 1.242 1.249 1.257 North East 1.101 1.090 1.104 1.105 1.150 1.183 1.179 1.200 1.216 1.219 1.208 1.196 1.195 1.212 1.205 1.216 1.225 1.235 1.235 1.239 1.234 1.231 Tuscany 1.155 1.176 1.161 1.213 1.199 1.212 1.230 1.187 1.167 1.104 1.126 1.132 1.168 1.170 1.162 1.157 1.158 1.150 1.153 1.131 1.131 1.142 Umbria 1.133 1.072 1.075 1.132 1.135 1.106 1.049 0.959 1.014 1.006 1.005 1.042 1.057 1.020 1.001 0.992 0.998 0.990 1.011 1.026 1.052 1.058 Marche 1.154 1.133 1.168 1.186 1.224 1.239 1.239 1.342 1.323 1.365 1.328 1.355 1.333 1.371 1.329 1.339 1.347 1.332 1.349 1.376 1.351 1.390 Lazio 0.591 0.591 0.581 0.569 0.583 0.555 0.574 0.546 0.536 0.546 0.530 0.551 0.547 0.542 0.544 0.528 0.521 0.518 0.514 0.517 0.525 0.517 Abruzzi 0.799 0.802 0.792 0.814 0.831 0.811 0.820 0.805 0.831 0.812 0.830 0.926 0.910 0.925 0.935 0.935 0.975 0.986 0.988 1.021 1.034 1.013 Molise 0.505 0.532 0.526 0.536 0.569 0.565 0.541 0.642 0.683 0.696 0.699 0.673 0.735 0.726 0.737 0.763 0.776 0.787 0.817 0.833 0.820 0.837 Central Italy 0.913 0.914 0.906 0.918 0.922 0.911 0.919 0.899 0.888 0.881 0.872 0.890 0.897 0.898 0.891 0.883 0.882 0.875 0.877 0.876 0.879 0.884 Campania 0.689 0.699 0.700 0.704 0.690 0.674 0.622 0.631 0.639 0.637 0.632 0.688 0.679 0.667 0.676 0.685 0.676 0.682 0.666 0.682 0.680 0.688 Puglia 0.665 0.694 0.682 0.687 0.692 0.701 0.726 0.727 0.743 0.728 0.713 0.717 0.727 0.686 0.694 0.694 0.684 0.708 0.720 0.719 0.706 0.700 Basilicata 0.441 0.436 0.465 0.453 0.439 0.458 0.477 0.429 0.420 0.440 0.498 0.493 0.482 0.492 0.544 0.657 0.678 0.685 0.698 0.748 0.793 0.837 Calabria 0.363 0.369 0.387 0.370 0.388 0.346 0.388 0.362 0.342 0.312 0.348 0.389 0.393 0.359 0.371 0.377 0.366 0.363 0.351 0.358 0.385 0.392 Sicily 0.502 0.507 0.507 0.493 0.482 0.485 0.471 0.457 0.462 0.482 0.460 0.476 0.466 0.465 0.467 0.457 0.446 0.452 0.450 0.467 0.470 0.471 Sardinia 0.580 0.567 0.542 0.554 0.574 0.580 0.560 0.551 0.536 0.537 0.563 0.560 0.569 0.577 0.527 0.522 0.511 0.496 0.491 0.483 0.495 0.532 South 0.598 0.606 0.605 0.605 0.604 0.597 0.588 0.583 0.589 0.586 0.588 0.617 0.615 0.601 0.606 0.610 0.605 0.612 0.609 0.622 0.625 0.630
Source: Elaboration on ISTAT data. Note: † ISIC codes 15-37
Table 2 – Patent Applications per 1000 Workers, by Region, 1980 – 2001. 1980 1981 1982 1983 1984 1985 1986 1987 1988 1989 1990 1991 1992 1993 1994 1995 1996 1997 1998 1999 2000 2001 Piedmont 0.017 0.057 0.061 0.093 0.114 0.106 0.131 0.154 0.165 0.185 0.185 0.205 0.204 0.208 0.180 0.191 0.207 0.233 0.222 0.250 0.280 0.250 Aosta Valley 0.000 0.000 0.034 0.034 0.000 0.017 0.064 0.000 0.017 0.050 0.065 0.064 0.096 0.017 0.034 0.000 0.053 0.070 0.017 0.018 0.034 0.067 Lombardy 0.025 0.053 0.071 0.076 0.096 0.106 0.129 0.145 0.191 0.225 0.209 0.205 0.219 0.223 0.195 0.220 0.216 0.234 0.263 0.288 0.305 0.314 Liguria 0.008 0.022 0.020 0.032 0.039 0.048 0.064 0.052 0.074 0.074 0.075 0.058 0.087 0.116 0.128 0.133 0.161 0.134 0.139 0.153 0.146 0.178 North West 0.021 0.051 0.062 0.076 0.094 0.099 0.122 0.136 0.170 0.197 0.188 0.189 0.201 0.206 0.183 0.202 0.206 0.223 0.237 0.262 0.281 0.281 Trentino-Alto Adige 0.009 0.016 0.018 0.025 0.034 0.020 0.020 0.029 0.041 0.038 0.061 0.065 0.038 0.051 0.077 0.070 0.094 0.081 0.081 0.094 0.075 0.117 Veneto 0.009 0.024 0.025 0.042 0.043 0.055 0.076 0.082 0.099 0.090 0.120 0.120 0.117 0.116 0.120 0.127 0.153 0.138 0.147 0.202 0.198 0.196 Friuli-Venezia Giulia 0.030 0.032 0.071 0.071 0.082 0.113 0.097 0.100 0.159 0.196 0.175 0.183 0.199 0.181 0.164 0.196 0.201 0.218 0.197 0.206 0.226 0.223 Emilia-Romagna 0.018 0.036 0.050 0.070 0.055 0.061 0.092 0.093 0.126 0.140 0.127 0.175 0.173 0.188 0.177 0.188 0.233 0.216 0.233 0.292 0.314 0.317 North East 0.015 0.029 0.039 0.054 0.051 0.061 0.079 0.083 0.110 0.116 0.123 0.143 0.140 0.144 0.143 0.153 0.183 0.171 0.179 0.227 0.234 0.238 Tuscany 0.007 0.015 0.028 0.027 0.035 0.043 0.053 0.064 0.060 0.066 0.090 0.094 0.098 0.101 0.078 0.078 0.095 0.069 0.099 0.102 0.128 0.119 Umbria 0.012 0.034 0.012 0.041 0.029 0.039 0.041 0.032 0.058 0.055 0.041 0.075 0.040 0.058 0.024 0.067 0.058 0.055 0.080 0.104 0.124 0.122 Marche 0.002 0.008 0.013 0.028 0.025 0.027 0.016 0.036 0.051 0.063 0.066 0.067 0.077 0.054 0.076 0.082 0.060 0.084 0.096 0.108 0.128 0.159 Lazio 0.010 0.016 0.020 0.037 0.027 0.033 0.051 0.049 0.047 0.058 0.065 0.086 0.085 0.067 0.068 0.071 0.065 0.073 0.082 0.093 0.107 0.104 Abruzzi 0.000 0.009 0.013 0.009 0.013 0.011 0.015 0.019 0.021 0.031 0.046 0.030 0.043 0.036 0.030 0.025 0.069 0.114 0.141 0.167 0.239 0.192 Molise 0.000 0.017 0.017 0.000 0.009 0.000 0.000 0.016 0.008 0.026 0.008 0.009 0.017 0.009 0.027 0.000 0.018 0.036 0.036 0.054 0.026 0.017 Central Italy 0.007 0.015 0.020 0.030 0.028 0.033 0.042 0.047 0.049 0.057 0.068 0.079 0.080 0.071 0.065 0.068 0.072 0.075 0.093 0.104 0.127 0.122 Campania 0.001 0.005 0.006 0.005 0.004 0.006 0.006 0.009 0.012 0.015 0.014 0.011 0.016 0.023 0.020 0.024 0.019 0.025 0.026 0.031 0.040 0.035 Puglia 0.002 0.002 0.003 0.005 0.007 0.005 0.003 0.011 0.014 0.011 0.015 0.007 0.011 0.013 0.012 0.014 0.016 0.015 0.025 0.023 0.029 0.041 Basilicata 0.000 0.000 0.001 0.010 0.005 0.005 0.005 0.000 0.029 0.015 0.010 0.000 0.016 0.000 0.011 0.016 0.016 0.032 0.095 0.088 0.071 0.066 Calabria 0.003 0.002 0.003 0.002 0.002 0.005 0.005 0.014 0.011 0.005 0.005 0.005 0.008 0.009 0.008 0.003 0.002 0.016 0.010 0.017 0.021 0.013 Sicily 0.000 0.004 0.003 0.005 0.004 0.006 0.010 0.006 0.019 0.017 0.016 0.025 0.018 0.017 0.021 0.036 0.045 0.035 0.030 0.030 0.059 0.054 Sardinia 0.000 0.008 0.002 0.004 0.006 0.010 0.006 0.014 0.014 0.010 0.010 0.015 0.012 0.016 0.005 0.011 0.018 0.014 0.023 0.018 0.032 0.022 South 0.001 0.004 0.004 0.005 0.005 0.006 0.006 0.009 0.015 0.013 0.013 0.013 0.014 0.016 0.015 0.021 0.023 0.024 0.027 0.028 0.041 0.038 Italy 0.011 0.026 0.032 0.042 0.046 0.051 0.064 0.071 0.089 0.100 0.101 0.108 0.111 0.112 0.104 0.114 0.124 0.127 0.138 0.159 0.174 0.173
Table 3 – Patent Applications Growth Rates, by Region† 1980-1984 1985-1989 1990-1994 1995-1999 Piedmont 0.307 0.099 -0.013 0.047 Aosta Valley - 0.183 -0.116 - Lombardy 0.224 0.137 -0.019 0.050 Liguria 0.251 0.069 0.075 0.025 North West 0.250 0.123 -0.012 0.048 Trentino-Alto Adige 0.220 0.116 0.036 0.057 Veneto 0.272 0.095 -0.003 0.083 Friuli-Venezia Giulia 0.169 0.096 -0.021 0.011 Emilia-Romagna 0.186 0.144 0.051 0.078 North East 0.209 0.117 0.021 0.071 Tuscany 0.281 0.069 -0.025 0.049 Umbria 0.153 0.063 -0.093 0.082 Marche 0.462 0.147 0.015 0.050 Lazio 0.186 0.093 0.004 0.051 Abruzzi - 0.183 -0.083 0.312 Molise - - 0.183 - Central Italy 0.243 0.093 -0.012 0.074 Campania 0.231 0.159 0.058 0.047 Puglia 0.251 0.127 -0.037 0.079 Basilicata - 0.183 0.000 0.289 Calabria -0.116 0.000 0.085 0.268 Sicily - 0.170 0.030 -0.025 Sardinia - 0.030 -0.116 0.085 South 0.257 0.134 0.020 0.051 Italy 0.239 0.118 -0.002 0.059
Source: Elaborations on EPO data.