HAL Id: hal-02597960
https://hal.inrae.fr/hal-02597960
Submitted on 15 May 2020HAL is a multi-disciplinary open access
archive for the deposit and dissemination of sci-entific research documents, whether they are pub-lished or not. The documents may come from teaching and research institutions in France or abroad, or from public or private research centers.
L’archive ouverte pluridisciplinaire HAL, est destinée au dépôt et à la diffusion de documents scientifiques de niveau recherche, publiés ou non, émanant des établissements d’enseignement et de recherche français ou étrangers, des laboratoires publics ou privés.
Evaluating management solutions for WETwin case
studies
R. Johnston, D. Coertjens, S. Liersch, M. Mahieu, Clément Murgue, Sylvie
Morardet, J. Cools, M. Diallo, B. Kone, G. Villa Cox, et al.
To cite this version:
R. Johnston, D. Coertjens, S. Liersch, M. Mahieu, Clément Murgue, et al.. Evaluating management solutions for WETwin case studies. [Research Report] irstea. 2012, pp.108. �hal-02597960�
Evaluating management solutions
for WETwin case studies
Deliverables: D8.1 , D5.2 Version 5 Date 26/4/2012 Lead Authors: Robyn Johnston Dries Coertjens Stefan Liersch Contributors: Marie Mahieu Clement Murgue Dries Coertjens Parvaneh Honarmand Sylvie Morardet Jan Cools Diallo Mori Bakary Kone Gonzalo Villa Cox Susan Namaalwa Rose Kaggwa Samuel Fournet Istvan Zsuffa Beata Pataki Andrea Funk Thomas Hein Peter Winkler Adrienn Hunyady
Document Information
Title Evaluating management solutions for WETwin case studies Lead authors Robyn Johnston (IWMI), Dries Coertjens, Stefan Liersch (PIK) Contributors
Marie Mahieu; Clement Murgue; Sylvie Morardet; Jan Cools; Diallo Mori; Bakary Kone; Gonzalo Villa Cox; Susan Namaalwa; Rose Kaggwa; Parvaneh Honarmand; Samuel Fournet; Istvan Zsuffa; Andrea Funk; Thomas Hein; Peter Winkler; Adrienn Hunyady
Deliverable number D8.1 , D5.2 Deliverable description
D8.1 Report on the identification of the best-compromise solution for each study area
D5.2 Report on advanced vulnerability assessments (where possible) Report number
Version number V5
Due deliverable date
Actual delivery date April 2012
Work Package WP8 , WP5
Dissemination level PU Reference to be used for
citation Same as title
Prepared under contract from the European Commission
Grant Agreement no 212300 (7th Framework Programme)
Collaborative Project (Small or medium-scale focused research project) Specific International Cooperation Action (SICA)
Start of the project: 01/11/2008 Duration: 3 years
Acronym: WETwin
Full project title: Enhancing the role of wetlands in integrated water resources management for twinned river basins in EU, Africa and South-America in support of EU Water Initiatives
TABLE OF CONTENTS
PART A – Methods and approach ... 5
1
Introduction ... 5
1.1 WETwin conceptual framework ... 5
1.2 Evaluation framework ... 6
2
Constructing the decision space ... 7
2.1 Characterisation and problem definition ... 8
2.2 Stakeholder engagement ... 10
2.3 Scenarios ... 10
2.4 Management options and solutions ... 11
2.5 Criteria and indicators ... 11
2.6 Evaluation matrices, scoring and value functions ... 12
3
Evaluation of management solutions ... 13
3.1 Multi-criteria analysis ... 14
3.2 Trade-off analysis ... 15
3.3 Vulnerability, resilience and adaptive capacity ... 16
4
Finding “best compromise” solutions ... 17
4.1 Discussion ... 17
4.2 Conclusions ... 19
PART B – Case studies ... 22
5
Ga Mampa (South Africa) ... 22
5.1 Decision space ... 22
5.2 Results of expert analysis ... 26
5.3 Results of stakeholder consultations (equity matrix) ... 37
5.4 Summary and recommendations ... 38
6
Nabajjuzi... 41
6.1 Decision space ... 41
6.2 Results of expert analysis ... 43
6.3 Impact of scenarios – vulnerability and robustness ... 47
6.4 Results of stakeholder consultations (equity matrix) ... 50
7.1 Decision space ... 52
7.2 Ranking from MCA ... 54
7.3 Vulnerability analysis ... 64
7.4 Summary and recommendations ... 66
8
Inner Niger Delta (IND), Mali ... 67
8.1 Decision space ... 67
8.2 Results of Expert Analysis ... 74
8.3 Trade-Off Analysis ... 79
8.4 Impact of scenarios – vulnerability and robustness ... 83
8.5 Sensitivity analysis ... 86
8.6 Results of stakeholder consultations ... 86
8.7 Summary and recommendations ... 86
9
Abras de Mantequilla ... 87
9.1 Decision space ... 87
9.2 Rankings from MCA ... 89
9.3 Vulnerability analysis ... 93
9.4 Sensitivity analysis ... 95
9.5 Summary and recommendations ... 96
10
Lobau ... 97
11
Gemenc ... 98
11.1 Decision space ... 98
11.2 Results of expert analysis ... 105
11.3 Vulnerability ... 107
PART A – Methods and approach
1 Introduction
Decisions about wetland management are made in a complex and dynamic context involving a range of stakeholders with different and sometime competing objectives. The aim of the WETwin project is to provide a rigorous framework for evaluating the effects of alternative development strategies to identify best compromise management solutions that are ecologically sustainable, socially acceptable, and economically sound, taking into account values of different stakeholders.
This report describes application of the WETwin decision framework to identify and assess management solutions for each case study. Chapter 1 outlines the theoretical framework used in the analysis and discusses general conclusions and lessons learnt; the remaining chapters describes application of the DSF to each case study site.
1.1 WETwin conceptual framework
WETwin starts from four basic premises of wetland management:
Wise use (Ramsar Convention Secretariat, 2007) encapsulates the understanding that wetlands provide a wide range of ecosystem services and are an important component of livelihood systems. As such, the aim is to manage for a range of functions, not only for conservation values, but to do this in ways that protect and enhance ecological status.
Adaptive management recognises management as an on-going cyclical process, not an end point; the critical components of such an approach for wetland have been described by Dickens et al. (2004) in the “Critical Path” approach, adopted by Ramsar as a standard for wetland management (Ramsar Convention Secretariat 2007).
Integrated water resource management acknowledges that wetlands function within a hydrological context, where the management of the catchment impacts on the health of the wetland; and the wetland contributes to the overall functioning of the catchment (CIS, 2003; UNESCO, 2009). The Conceptual Framework for wetland management developed in the WETwin project nests adaptive management of the wetland within the adaptive management cycle of the river basin, with on-going feedback between the two (Zsuffa et al., this volume). Participatory planning and management recognises that local communities and
stakeholders are ultimately both the actors and the beneficiaries of management, and must be involved at all stages (UN, 1994).
The focus of WETwin was the preparatory and planning stages of the Critical Path adaptive management cycle. This sub-system has been developed into a Decision Support Framework (DSF) (Figure 1), drawing on concepts from Gamboa (2006) and Paneque Salgado et al. (2009), which was applied and tested on the case studies under WP8. This report will focus on the process of evaluation of proposed solutions, and multi-criteria analysis (MCA) to determine best compromise solutions. It builds on existing reports covering other aspects of the decision framework, as follows:
Characterisation and problem definition: D3.1, D3.2 (Zsuffa et al 2010)
Stakeholder analysis, consultation and preference elicitation: D2.1 (Van Ingen 2010), D4.2 (Ostrovskaya et al. 2010)
Evaluation criteria: WP7 (Funk et al., 2011)
Identifying management options and solutions: D7.2 (Johnston et al., 2012) Definition of local and global scenarios: D5.1 (Liersch et al., 2011)
Figure 1.1 DSF framework
1.2 Evaluation framework
Evaluation of different potential management paths for the case study wetlands is a complex, inherently multi-dimensional problem, needing to take account of multiple functions and values of the wetland, multiple stakeholders with varying perspectives, feedback between the wetland and the catchment, and vulnerability to external pressures.
In assessing management interventions in WETwin, five key questions were considered: 1. Does it work? (impact assessment)
2. Is it technically feasible and cost effective? (feasibility assessment)
3. Will it work in the future if external conditions change? (vulnerability assessment)
4. Who wins and who loses? Are there trade-offs or synergies between different sectors or stakeholders? (trade-off analysis)
5. Does it have local support? (stakeholder acceptance)
The WETwin decision support framework explicitly acknowledges that decision processes are often subjective, driven by the needs and interests of particular groups. Thus management solutions are evaluated in two parallel pathways in WETwin: expert evaluation carried out by independent scientists, which aims to be as objective as possible (see Figure 1.2); and evaluation by interested stakeholders, which is explicitly subjective.
Figure 1.2 Components of the generic framework for expert evaluation, from Zsuffa et al (2010).
2 Constructing the decision space
Defining “best” management involves a complex interplay between values and aspirations of different stakeholders and the constraints imposed by the physical and economic realities of the system. This complexity can conceptualized as a decision space (see Figure 2-1a), where
the dimensions of the decision space are defined by key system values (represented by criteria);
the state of the system is defined in terms of these values / criteria; state can be changed either by management or by external drivers / pressures
feasible limits of decision space are determined by external physical, social and economic conditions (described by scenarios)
acceptable outcome domains for different stakeholders are defined on the basis of stakeholder values and preferences (expressed as ranges for criteria).
The aim of management is to shift or maintain the state of the wetland system so that it delivers specific values, in line with stakeholder requirements. Management must work within the constraints of the physical, social and economic realities of the external context. In WETwin, these are described in terms of scenarios, which can be seen as setting the overall shape and location of the feasible decision space. Different scenarios will thus define different decision spaces: for example, a shift in climate may restrict ecological values; or economic growth may open up new development possibilities. Different scenarios may mean that currently acceptable practices move into infeasible space under new external conditions; or that new management possibilities open up. Although these forces are beyond the control of managers, management must take account of these shifts. The distinction between external pressures and internal (manageable) components is not always clear-cut, but depends on the scale at which management occurs. For example, operation of a dam
Figure 2-1 illustrates these concepts. In a hypothetical wetlands, the feasible set of states for the wetland under current conditions is limited by biophysical and socio-economic conditions to the illustrated zone of values for criteria 1 (ecological values) and criteria 2 (economic values). Stakeholder 1 (SH1) has a strict requirement that ecological state remain above an identified threshold, but has no interest in use values. Stakeholder 2 is prepared to trade ecological values for economic use. The current state of the wetland (S0) satisfies neither. Three management solutions are proposed: ecological restoration with no new economic uses (MS1); large increase in wetland use with some decrease in ecological values (MS3); and a compromise solution with some increase in both economic uses and ecological health (MS2). Under current conditions, MS3 is acceptable only to SH2 but both MS1 and MS2 are acceptable solutions. However, under climate change the ecological values of this wetland are significantly reduced (Scenario A, Figure 2.1b); redefining the decision space so that MS1 is no longer a feasible option. (Changed conditions under the new scenario mean that the outcomes from the other proposed solutions also change). MS2 is thus the preferred solution, robust under a range of conditions and acceptable to all stakeholders.
2.1 Characterisation and problem definition
The initial stage of each case study involved a review of current understanding of the wetland and its context, to define the components of the decision space. The initial assessment covered biophysical, socio-economic and the institutional and governance context (see Zsuffa et al 2010, D3.2). Information on the wetland and basin was collated using the structure of the Ramsar Information Sheets (Ramsar 2010). Information was collected by case study teams based on literature review, reports of previous projects and consultation with stakeholders. An assessment was also undertaken of the management structures and institutions and the related legal framework for both wetlands and river basins for each case study site (Ostrovskaya et al., 2011).
An important component of WETwin was to establish methods that can be applied in data-poor contexts, by combining best available local information and knowledge with understanding of wetland processes garnered from international experience. Structured frameworks were developed to guide and document qualitative assessments by both technical “experts” and local stakeholders. Methods were explored to summarise and present information in simple, standard formats that could be used to compare results across the different case studies.
2.1.1 Rapid assessment tools
DSIR analysis: problems and issues to be dealt with in each wetland case study were characterised
through analysis of Drivers – State – Impacts – Responses (DSIR, modified from the DPSIR approach developed by the European Environmental Agency (EEA, 2005). The DSIR chains are described in detail in Zsuffa (2010) (WP3, D3.2). As part of this analysis, potential trade-offs between different ecosystem services were also identified.
WET-Health and WET-Ecoservices: in South Africa, rapid assessment tools have been developed
using semi-quantitative methods to assess wetland health (WET-Health – Macfarlane et al., 2008)) and ecosystem services provision (WET-EcoServices - Kotze et al., 2009). These tools allow different levels of assessment, based on the degree of available information, from simple desktop analysis to rigorous field-based assessments. They are structured using checklists with detailed descriptions of the features to be scored and the rationale for assigning scores. These tools were adapted for use in WETwin case studies to provide a structured approach to assessing ecological status.
TEEB Report Cards: based on concepts outlined in TEEB (2010) and Ranganathan et al. (2008), a
summary “report card” of wetland status and sensitivity to future changes was produced for each wetland.
Figure 2-1: Illustration of the WETwin decision space.
a). The deep blue area represents the feasible decision space under current conditions (as defined by criteria 1 and 2). Domains of acceptable values for stakeholders are represented by the shaded areas. Current state of the system at S0 is not acceptable to either stakeholder 1 (SH1) or SH2. Proposed management solutions MS1 and MS2 are acceptable to both stakeholders; MS3 is not acceptable to SH1.
b). The purple area represents the feasible decision space under Scenario A – feasible region for Criteria 1 has been significantly reduced. Solution MS1 is no longer within the feasible space; MS2 is thus a more robust solution, acceptable to all stakeholders under a range of conditions.
Institutional context – Twin2Go: for the assessment of institutional capacity, a similar questionnaire
method using standard criteria and scoring rubrics has been developed under the European-funded FP7 project Twin2Go (Pahl-Wostl et al., 2009, Lebel et al., 2011) and applied to the WETwin river basins. The scoring represents relative (rather than absolute) strengths and weaknesses of each criterion, based on the perceptions of stakeholders within the basin. Results are presented as simple “spider” diagrams, allowing comparison between basins.
2.2 Stakeholder engagement
Stakeholder involvement plays a fundamental role in the WETwin decision process. The WETwin DSF explicitly acknowledges that decision processes are subjective, driven by the needs and interests of particular groups. Local knowledge is a valuable resource, particularly in contexts where data is otherwise lacking. Knowledge, opinions and preferences of stakeholders are incorporated into the evaluation at several stages. Management solutions are evaluated in two parallel pathways: expert evaluation carried out by independent scientists which aims to be as objective as possible; and evaluation by interested stakeholders, which is explicitly subjective.
An analysis of relevant stakeholders was conducted for each case study, and a strategy for stakeholder engagement was formulated (van Ingen, 2010). Stakeholders were involved through consultation in workshops, small groups and individual discussions. Innovative methods for consultation were explored - for example, the use of role-playing games to structure discussions in Ga-Mampa (Morardet and Milhau, 2010) and the Inner Niger Delta. Input from stakeholders was used in four main ways:
to identify and refine management solutions for further assessment; to reveal stakeholder preferences and perceptions;
to elucidate the preferences underlying decisions (used to establish criteria categories and weightings in MCA);
to assist in the qualitative scoring of indicators; and to identify preferred management solutions directly, for comparison with results from expert evaluation.
In most cases, local experts are also interested stakeholders (e.g. wetland managers), so to avoid bias in the expert judgment, scoring was done by multiple experts. In order to better understand the given scores, the reasons behind are also collected, and where scores differ, the motivations behind the scores are compared to find a compromise.
2.3 Scenarios
An important component of the initial analysis was to define the management domain for each case study site: which actions are within the scope of management and which are external pressures that must be dealt with, but cannot be influenced directly (for example, population growth, climate change). The distinction between external pressures and internal (manageable) components is not always clear-cut, but depends on the scale at which management occurs. For example, operation of a dam upstream of a wetland is within the management sphere of a catchment management agency; but is an imposed external condition for a wetland community. In WETwin, external drivers and pressures are described in terms of scenarios.
The aim of scenario analysis in WETwin is twofold: firstly, to illustrate the potential range of future conditions under which wetland management may operate, and the way external factors influence what will or won’t work; and secondly to find management responses that are robust under a range of external conditions. Different scenarios define different decision spaces: economic growth may open up new development possibilities; or a shift in climate may change ecological values. Although these forces may be beyond local control, managers must take account of the shifts entailed. Conditions under different scenarios are compared to baseline conditions (formulated to represent current conditions). “Business as usual” (BAU) scenarios (with external changes, but no change in
management) are used to distinguish the effects of external (scenario) change from management impacts.
At the global scale, Liersch and Hattermann (2010) identified population growth, climate change and different trajectories of economic development as the main drivers of changes affecting wetland management; and delineated three representative global scenarios which define boundary conditions for regional and local change. Within these bounds, local, site-specific scenarios were developed for each case study, to represent a range of different long-term outcomes (to 2050). Formulation and analysis of scenarios is discussed in detail in D5.2 (Liersch and Hatterman 2010).
2.4 Management options and solutions
The Millenium Ecosystem Assessment (MA, 2003) defined management responses as actions, policies, strategies and interventions undertaken by different actors, from governments to communities. Responses can operate from local to international scales, depending on the driver or issue being addressed. As well as technological and infrastructural measures, management interventions can range from legal and economic measures (such as land use regulations and payment for environmental services) to social and cognitive responses aiming to change behavior (such as public education and awareness campaigns) (Chambers and Toth, 2005).
In each case study, management responses to address specific wetland issues were identified in consultation with stakeholders, drawing on international experience. In most cases, a mix of technological and local regulatory responses (mainly land use zoning and restriction of agrochemicals) was proposed. Working at the community level, economic and legal mechanisms were not favored, or were perceived as beyond the capacity or responsibility of local groups.
Because of the multiple values of wetlands, management usually addresses more than one component or ecosystem value. Interventions addressing specific components or issues are combined in packages of complementary or compatible interventions as management solutions that will provide desired outcomes for the wetland system as a whole. Options can be combined as complementary (addressing different elements of system); enabling (interventions designed to support or enhance another intervention – for example, land tenure changes to support land use change); or mitigating (interventions designed to offset or compensate for adverse impacts of another intervention). Many of the interventions identified are “no regrets” options, where impacts are positive or neutral across all criteria: for example, improvements in wastewater treatment and agricultural practices.
Formulation of management solutions from a long list of potential options requires a pragmatic approach to selecting feasible combinations and narrowing down to a practical number for evaluation, based on stakeholder preferences and practical considerations for implementation. The diversity of the WETwin case studies required somewhat different approaches in each case study. Management options and solutions for each case study are described in detail in Johnston and Mahieu (2012), D7.2.
2.5 Criteria and indicators
Management solutions were evaluated and compared against criteria chosen to represent the main values of the system. Criteria were selected to reflect the values and interests of all stakeholders, in three key domains:
Ecosystem services (including livelihood support, agricultural production, water supply, sanitation)
Criteria represent broad values, and are described and quantified using specific indicators. Indicators are variables that reflect change, and which can be measured or estimated. Where possible, quantitative indicators were identified for each criterion, but measurable indicators could not be identified for all important criteria. Setting the criterion aside would skew the analysis by ignoring important values, simply because they could not be quantified. To avoid this, qualitative indicators scored by combining available information and expert judgement were used where other options were not available.
The number and type of indicators used in each case study varied, reflecting the different issues and priorities, and the availability of data. Criteria and indicators for each case study are described in detail in Funk et al. (2011), D7.1.
2.6 Evaluation matrices, scoring and value functions
Evaluation matrices to compare management solutions are constructed by scoring each solution in terms of its impact on each indicator / criteria. Scoring can be qualitative or quantitative. To compare disparate criteria, indicator scores are normalised to a common unit and range.
A range of quantitative biophysical and socio-economic modelling approaches was used to assess impacts, where sufficient data were available to construct and calibrate them. Hydrological models of different complexity were used to describe flows and in some cases water. In Ga-Mampa, a dynamic simulation model (WETSYS) combining biophysical and socio-economic components was developed using the STELLA® platform (Costanza et al., 1998) to simulate the impacts of wetland management strategies and external pressures on wetland ecosystem functioning, ecosystem services and ultimately on community well-being in Ga-Mampa area (Morardet et al., 2010). Modelling tools used in the case studies are described in detail in Funk et al (2011) (D7.2)
Qualitative scoring is used in WETwin in three different contexts. The first is where the indicator / criterion of interest is inherently qualitative – for example, indicators relating to institutional capacity. The second is in cases where insufficient data were available to measure or score an indicator quantitatively. The third case is where the criteria is a complex variable integrating several components, for example the Wet-Health scores. In many cases, qualitative assessment and scoring is a subjective process based on expert judgement but it is also possible to establish more structured, repeatable and transparent approaches using scoring rubrics which describe in detail the logic behind allocating particular scores: for example, the WET-Health and WET-EcoServices tools described above.
In order to compare disparate criteria in MCA, indicator scores must be translated to a common unit and range. Normalization enables comparison and combination of raw evaluation results (indicator values), which are otherwise non-commensurable. The role of the value function is to capture the target state, and so to give a normative direction in relation to the planned management solutions (Boulanger 2008). Value functions were used to normalise scores to a range from 0 (representing the worst outcome) to 1 (best outcome). Value functions can be defined for quantitative and qualitative indicators; the shape of the function can be varied to describe different relationships between the indicator and the criteria score, including thresholds. It is important to note that value functions inherently imply subjectivity (since the concept of worst and best varies between stakeholders), and so it is possible for different stakeholders to define different value functions for the same criterion. Two approaches to value functions were used: defined by scientists on the basis of scientific knowledge; or defined according to stakeholders’ preferences towards the target state. Value functions used for each case study are described in detail in Funk et al 2011 (D7.2).
The use of scoring, rather than raw indicator values, has a number of advantages. It allows comparison between different types of variables and enables inclusion of a much wider range of
understood, and facilitate reporting of results to non-technical audiences. However, the inherent weaknesses of scoring approaches must be taken into account. There are inconsistencies in comparing well defined modeled parameters (where a shift in value of 0.1 is meaningful) with data scored on a three class scale of “poor – moderate – good” (where a shift in value of 0.1 is not significant). The WETwin methodology does not explicitly track uncertainty associated with different parameters, so that the overall uncertainty associated with rankings cannot be described. This is a shortcoming in the methodology which should be addressed.
3 Evaluation of management solutions
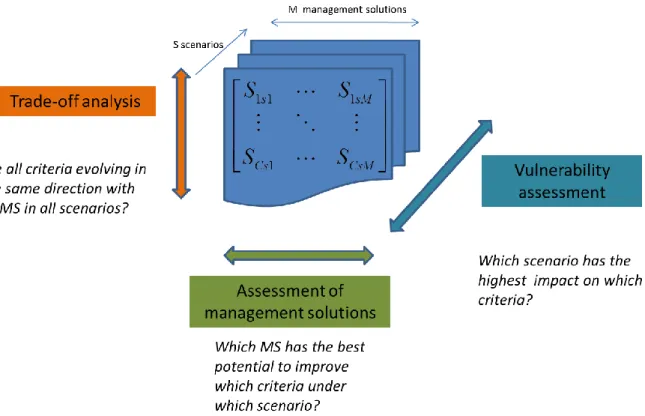
The WETwin evaluation process has three linked components: a comparative multi-criteria analysis (MCA) of the outcomes of different interventions in terms of both impacts and feasibility; an analysis of the trade-offs between wetland functions and between stakeholders; and assessment of the vulnerability of the system to external pressures to determine whether proposed management options are robust in the context of imposed change. In each case, the underlying information for analysis was compiled in the form of evaluation matrices setting out comparative scores for key criteria for the system under different scenarios and management regimes (Figure 3.1). The evaluation matrices provide a consistent basis for all assessments.
Figure 3.1: Linked analysis of impacts/ feasibility, trade-offs and vulnerability, based on evaluation
3.1 Multi-criteria analysis
Multi-criteria analysis (MCA) techniques are widely used in complex decision-making, and are reviewed in WETwin SD3/SD4 (Interwies and Cools 2010). MCA helps to structure the management problem and offers a transparent, accountable and auditable procedure for decision making, and is thus an important tool for natural resource management, and specifically water resources management, which typically has multiple objectives (Hajkowicz and Collins, 2006; Figueira et al., 2005). MCA requires
a set of decision alternatives to be evaluated by the decision makers
set of criteria for evaluation (which may be measured in different units) and
a set of performance measures (scores) allocated to each alternative against each criterion methods to combine scores to rank alternatives.
MCA can be used in either individual or group decision making and can handle issues with multiple objectives and conflicting criteria. It can deal with a variety of quantitative and qualitative data (measured in different units) and even expert judgments, and can be used in a participatory environment involving both experts and stakeholders (Nayak and Panda, 2001; Greiner et al. 2005; Mendoza and Martins, 2006).
In the context of assessing the economic effectiveness of wetland management decisions, Interwiess et al (2010) compared the use of MCA with other methods of assessment including Cost-effectiveness Analysis (CEA) and Cost-benefit analysis (CBA). CEA is usually applied when all costs are easy to assess and there are not many trade-offs between options; CBA can be used in more complex situations but both cost and benefit data must be available. Since wetland management deals with environmental and social impacts, and monetizing these impacts is difficult, MCA can be a facilitating approach (Interwies and Cools, 2010).
There are various techniques used in MCA to rank alternatives, classified by Hajkowicz and Collins (2006) as: multi-criteria value functions; outranking approaches; distance to ideal point methods; pairwise comparisons and others. According to a number of studies comparing application of different MCA techniques in water resource management, there is no clear advantage for any single ranking technique (Hajkowicz and Collins, 2006). In contrast, the selection of different criteria and decision options can result in very different outcomes (Howard, 1991).
3.1.1 mDSS
In the WETwin project, the MULINO Decision Support System (mDSS) is used to facilitate the MCA approach and guide the process for data collection and analysis. mDSS was developed under the EU Framework, to assist decision makers in managing environmental issues in catchment scale water resource management (Guipponi et al 2004; Guipponi 2007, mDSS 2010). mDSS is able to integrate hydrological, ecological or socio-economic models with multi-criteria analysis methods and is designed to help decision makers:
better understand the decision problem by structuring relevant information
explain the problem at hand to involved actors (disciplinary experts, policy/decision makers, other stakeholders)
explore possible decision options
explore the impact of alternative scenarios on decisions facilitate public participation,
resolve conflicts related to alternative courses of action
extend collaboration with and between different stakeholder groups.
- Simple Additive Weighting (SAW) which is a simple sum of the criteria values for each option, weighted by the vector of weights. The results are expressed by means of scores: the option with the highest score should be preferred.
- Ordered Weighted Averaging (OWA) focuses on the risk attitude of decision makers
- Technique for Order Preference by Similarity to Ideal Solution (TOPSIS) in which the option closest to the positive ideal solution and furthest from the negative ideal solution is considered as being best. Both ideal solutions are described by the extreme indicator values. Since these solutions are not real and describe only ideal states (which cannot be achieved), the distance of the real options from both of them is combined to make the final choice.
- ELECTRE is an outranking approach, based on pairwise comparison of the alternatives, which assigns weights in an iterative manner to fill the thresholds parameters (preference threshold, indifference threshold and veto threshold) and is computationally demanding.
Within WETwin, only SAW and TOPSIS approaches were used. In most cases, results were not highly sensitive to ranking method, but were much more strongly affected by changes in
weightings.
3.2 Trade-off analysis
Explicit trade-offs occur when an improvement in one ecosystem value or service is achieved at the expense of a decrease in another: for example, increase in agricultural area at the expense of natural wetland area. Implicit trade-offs may occur between stakeholders where the objectives or values of stakeholders groups differ, where one group benefits at the expense of another or has to forgo benefits to protect the interests of another. Common approaches to addressing trade-offs include economic valuation, multi-criteria analysis (eg Brown et al., 2001), and a range of modelling approaches, linking biophysical and socio-economic systems either heuristically or dynamically (eg Moradet et al., 2010).
In the WETwin analytical framework, trade-offs are explored at two stages: qualitatively, as part of the initial DSIR and stakeholder analysis; and quantitatively as part of MCA.
For all case studies, initial DSIR analysis identified high-level trade-offs in terms of land or water use at catchment scale: for example, conversion of wetlands for agriculture or urban use (eg Lobau, Ga-Mampa); or diversion of wetland flows for irrigation or hydropower (eg Inner Niger Delta, Abras de Mantequilla). Identification of trade-offs at an early stage in the process, and the structured approach to identifying and assessing management solutions collaboratively with stakeholders, resulted in two different responses. First, the stakeholder groups involved in some case studies considered the decisions determining major trade-offs to be outside their management sphere, and treated them as externally imposed scenarios. Efforts were then focused on identifying management options to adapt wetland use and conditions to these externally imposed conditions. Secondly, potential trade-offs were explicitly built into the choice of solutions at the design stage. For example, in Ga-Mampa, packages of interventions were specifically designed to address potentially competing management objectives for the wetland as “conservation oriented”, “economic oriented”, “socially oriented” and “integrated”. Ranking was dominated by stakeholder preferences for a specific orientation rather than relative scoring, since each solution scored well in its particular domain. In Abras de Mantequilla, a management continuum was designed with progressive addition of options favouring environmental outcomes at the expense of agricultural production; the choice for stakeholders was thus about the degree, not the direction, of change. In working communally to identify acceptable management solutions, a large number of proposed management interventions were “no regrets” options deliberately designed to benefit all stakeholders (such as interventions to improve water quality and land management practices).
Sanon (2010), who applied this method to explore trade-offs for the Lobau wetland. The extent of the trade-off can be quantified by calculating the distance to the ideal solution. Within mDSS, the TOPSIS model uses distance to the ideal and non-ideal solutions as one way to rank solutions. In case studies where assessments were mainly qualitative (with only a few value levels), pairwise comparison of criteria was often not sufficiently sensitive to determine non-dominance, but the approach was useful for visualising potential trade-offs.
Implicit trade-offs between stakeholders are explored using analysis of preferences (expressed as criteria weightings) and the way these influenced rankings; and through use discussion and negotiation to find mutually acceptable solutions.
Figure 3.2 Pairwise comparison of criteria to identify trade-offs (from Sanon 2010).
3.3 Vulnerability, resilience and adaptive capacity
Vulnerability and resilience have become important elements in discussions of global change, but are conceptualised differently in different studies: see, for example, reviews by Gbetibouo and Ringler (2009), Fussel and Klein (2006) and Turner et al. (2003). Within WETwin, we are primarily concerned with the role of management in reducing vulnerability (or increasing resilience) of wetland systems to change; and with the degree to which management interventions remain viable in the face of change. For this reason, a framework for assessment of vulnerability was adopted that focuses on adaptive capacity relative to impacts of external change. In this framework, resilience is considered to be a characteristic of the state of the whole system (including the institutional, bio-physical, infrastructural and behavioural aspects); while robustness relates to specific management options or solutions. Composite indicators to assess vulnerability are widely used, and have proved valuable for identifying trends and to capture the complexity of vulnerability in reasonably simple terms (Gbetibouo and Ringler 2009).
The WETwin framework for vulnerability assessment is discussed in detail in Liersch et al (2012) (D5.1), and is summarized in Figure 3.3. Vulnerability is usually described in terms of three components: exposure, sensitivity and adaptive capacity. The impact of external stress (external impact or EI) is a function of exposure to stressors and the sensitivity of the system to that stress. Adaptive capacity (AC) is the extent to which these impacts can be withstood or mitigated. The change in vulnerability (residual vulnerability or ΔV) of the system as it moves from its initial state to a new state can be described by the sum of (usually negative) external impacts and (usually positive) adaptive capacity, that is:
If the state of a system can be described using criteria or indicators representing key values (above), and scores can be allocated for these criteria under different conditions, then the vulnerability of the system to change can be described, at least in relative terms. External impacts (EI), or the changes in the system due to things other than management, can be derived from the evaluation matrices as the change in system condition for business as usual under a Scenario A (that is, with no change in management) compared to baseline conditions
ie
EI = BAU – Baseline
Similarly, adaptive capacity (AC), defined as the extent to which system condition can be changed by management, is derived from the evaluation matrices for each management solution (MSx) as
AC = MSx - BAU
Where the adaptive capacity of the system exceeds the external impacts (AC>EI, ΔV>0), the system is resilient; where external impacts exceed adaptive capacity (EI>AC, ΔV<0), the system is vulnerable.
Figure 3.3: WETwin framework for vulnerability assessment of future states (from Liersch et al 2012)
4 Finding “best compromise” solutions
4.1 Discussion
The WETwin methodology was initially devised to handle a large number of both management solutions and evaluation criteria, to allow consideration of a wide range of management possibilities and to ensure that a wide range of values were taken into consideration in evaluating outcomes. However, experience in all case studies emphasized the need to simplify, and to focus on the most
Through the process of working with stakeholders the number of management responses to be evaluated was narrowed down to a few (5-10), albeit as packages of multiple options grouped into management solutions. Only in the Lobau case study was a large number (31) of solutions assessed; and this was possible primarily because there was sufficient sensitivity in scoring different options, as a result of strong biophysical models (validated with extensive monitoring and field data), that could simulate changes in conditions under different management regimes. In the other case studies, the lack of sensitivity in scoring meant that distinctions could only be made a relatively high level. The results from case studies emphasized that highly quantitative approaches to scoring and ranking are only justified when supported by quality data.
Similarly, for discussing and presenting the final rankings all case studies condensed indicators into a limited set of criteria classes (between 5 and 8). Although weighting and combining large indicator sets is mathematically straightforward, it can be problematic in terms of presenting and explaining results. Grouping indicators into criteria classes (e.g., ecological health; contribution to livelihoods) reduced the complexity, but may in some cases have obscured contradictory results within classes. However, a large number of criteria may also work to obscure the important issues. In theory, weighting criteria to reflect stakeholder priorities will draw out those that are significant. In practice, it was observed that when asked to weight a long list of criteria (for example, by distributing 100 pebbles amongst 23 criteria in 5 classes) stakeholders do not assign zero weight to any criterion; so that the number of indicators in a criteria class skews the importance of the class.
The evaluation matrix provides an important way to summarise and present information on management outcomes. The use of scoring has a number of advantages. It allows comparison between different types of variables and enables inclusion of a much wider range of criteria. In addition, scores normalised to give a ranking from “bad” (0) to “good” (1) are easily understood, and facilitate reporting of results to non-technical audiences. However, the inherent weaknesses of scoring approaches must be taken into account. There are inconsistencies in comparing well defined modeled parameters (where a shift in value of 0.1 is meaningful) with data scored on a three class scale of “poor – moderate – good” (where a shift in value of 0.1 is not significant). The WETwin methodology does not explicitly track uncertainty associated with different parameters, so that the overall uncertainty associated with rankings cannot be described. This is a shortcoming in the methodology which should be addressed.
The ranking of solutions using MCA was very sensitive to weightings, and ranking became more an exploration of the preferences of different stakeholders than a definitive way to “choose” solutions, concurring with the findings of Hajkowicz (2006) that the strength of MCA is as tool to support discussion, rather than a primary decision making tool.
The MCA was conceptually structured to allow analysis of trade-offs between different criteria. However, major trade-offs identified in the initial DSIR assessments often either were, or were perceived to be, outside the management domain of the wetland managers. Trade-offs between different stakeholders within the wetlands were explicitly addressed as part of the management solutions. Stakeholders side-stepped conflict and tradeoffs by seeking compromise within the proposed management solutions: that is, by seeking solutions that packaged measures responding to the concerns of all groups. The strong preference for “no regrets” measures reflects that fact that for all stakeholders, a healthy wetland delivers more benefits.
Vulnerability analysis required ability to score management responses under both current and future conditions. In most of the case studies, the information available to score future management regimes was not sufficiently sensitive to reflect differences between scenarios. Only in the Inner Niger Delta, where there is potentially a very large change in the water regime due to upstream development, were scenarios considered in any detail. In other case studies, visioning of future scenarios was important in helping stakeholders to identify potential issues and trends, but
4.2 Conclusions
The challenge faced in the WETwin project was to find a robust methodology to assist wetland communities in a range of contexts to identify and assess management options. The starting point for the project was the understanding that the multiple uses and users of wetland are likely to engender different perspectives about what constitutes “best” management; that competing objectives mean that a wide range of assessment criteria are needed to adequately capture those perspectives; and that trade-offs and compromise are integral to wetland management. Building from current international best practice, a structured approach was devised which combined Multi Criteria Analysis, trade-off analysis and vulnerability analysis and involved stakeholders at all stages. The methodological framework was applied in case studies in Africa, South America and Europe. The approach used in WETwin has three important strengths. First, it involves stakeholders at all stages of the decision process, and explicitly acknowledges and incorporates different perspectives so that local concerns are reflected in both the choice of options for evaluation and the final rankings. Secondly, it combines qualitative and quantitative data, so that assessments can be based on all important criteria, whether quantifiable or not. This allows inclusion of information relating to system components that are poorly known (but potentially important), not just components which can be measured with high confidence. Thirdly, it provides a relatively simple, structured approach to the complex problem of evaluating diverse wetland management interventions and a conceptually coherent framework to integrate impact and feasibility assessment, vulnerability analysis and trade-off analysis, based on evaluation matrices.
While the overall conceptual framework developed for WETwin was found to be robust and transferable to different contexts, the realities of implementation varied significantly between case studies. Not all components were applicable in all case studies; and the practical aspects of implementation depended on context, and particularly on the stakeholders involved. Working with stakeholder groups was a challenging and essential component of the project, and their different interests and concerns shaped the way the framework was applied. Ultimately, the strength of the approach was not in the rankings resulting from the analysis, but in the participatory process of exploration, debate and negotiation used to derive them.
References
Boulanger, P.-M., 2008. Sustainable development indicators: a scientific challenge, a democratic issue. Sapiens 1(1): 45-59.
Brown, K., Adger, W. N., Tompkins, E., Bacon, P., Shim, D., and Young, K., 2001. Trade-off analysis for marine protected area management.Ecological Economics, 37, 417- 434.
Chambers, W.B., Toth, F.L., 2005.Typology of responses.Chapter 2 in MEA (Millenium Ecosystem Assessment), 2005.Volume 4. Ecosystems and Human Well-being: Policy Responses. World Resources Institute, Washington, DC.
Common Implementation Strategy (CIS) for the Water Framework Directive (2000/60/EC), 2003. Guidance Document No 8: Public Participation in Relation to the WFD.
Costanza, R., Duplisea, D., Kautsky, U., 1998. Introduction to Special Issue Ecological Modelling on modelling ecological and economic systems with STELLA. Ecological Modelling 110(1): 1-4.
Dickens, C., Kotze, D., Mashigo, S., MacKay, H., and Graham, M., 2004.Guidelines for integrating the protection, conservation and management of wetlands into catchment management planning.
EEA (European Environment Agency), 2005. European Environmental Outlook. European Environment Agency, Copenhagen.
Figueira J., Greco S., Ehrgott M. (eds). 2005. Multiple Criteria Decision Analysis: State of the Art Surveys. Springer Science Business Media, Inc.: New York.
Funk, A., Winkler, P. and Hein, T., 2011.Performance Indicators, Decision-Support Toolbox and Baseline Simulation Results.WETwin project report.
Füssel, H. and Klein, R., 2006. Climate Change Vulnerability Assessments: An Evolution of Conceptual Thinking. Climatic Change 75 (3) p. 301-329
Gamboa, G., 2006. Social multi-criteria evaluation of different development scenarios of the Aysén region, Chile. Ecological Economics 59(1): 157-170.
Gbetibouo, G. A., and Ringler, C., 2009. Mapping South African Farming Sector Vulnerability to Climate Change and Variability. Food Policy, (August).
Giupponi, C., 2007. Decision Support Systems for implementing the European Water Framework Directive: The MULINO approach. Environmental Modelling & Software 22(2): 248-258.
Hajkowicz, S., and Collins, K., 2006.A Review of Multiple Criteria Analysis for Water Resource Planning and Management. Water Resources Management, 21(9), 1553-1566. Springer Netherlands.doi:10.1007/s11269-006-9112-5
Johnston, R., Winkler, P. and Funk, A., 2012 Formulating wetland management solutions. WETwin project report D7.2
Kogelbauer, I., 2010. Groundwater study of a subtropical small-scale wetland ( Ga-Mampa wetland , Mohlapetsi River catchment , Olifants River basin , South Africa ). University of Natural Resources and Applied Life Sciences, Vienna.
Koch, H., Liersch, S., and Hattermann, F., 2011.Integrating water resources management in eco-hydrological modelling. In International Conference on Integrated Water Resources Management. Management of Water in a Changing World: Lessons Learnt and Innovative Perspectives.
Kotze, D., Marneweck, G., Batchelor, A., Lindley, D., and Collins, N., 2008. WET-EcoServices: A technique for rapidly assessing ecosystem services supplied by wetlands. WRC Report TT339/08. Pretoria: Water Research Commission.
Krysanova, V., Hattermann, F., and Wechsung, F., 2005.Development of the ecohydrological model swim for regional impact studies and vulnerability assessment. Hydrological Processes, 19 , 763-783. Liersch, S., Cools, J., Kone, B., Koch, H., Diallo, M., Aich, V., Fournet, S., Hattermann, F.F., 2012 (this volume) Vulnerability of food production in the Inner Niger Delta to water resources
management under climate variability and change.
Liersch, S., and Hattermann, F., 2010. Report on Initial Vulnerability Assessment for Each Case Study. WETwin project report.
Macfarlane, D., Kotze, D., Ellery, W., Walters, D., Koopman, V., Goodman, P., and Goge, C., 2008. WET-Health: A technique for rapidly assessing wetland health. WRC Report TT 340/08. Pretoria: Water Research Commission.
MA, 2003. Ecosystems and Human Well-Being: a Framework for Assessment. Millennium Ecosystem Assessment, World Resources Institute and Island Press, Washington DC.Accessed
Morardet, S., and Milhau, F., 2010.Wet_WAG, a role-playing game to support stakeholder dialogue on wetlands management. WET-win project document D2.2
Morardet, S., Masiyandima, M., Jogo, W., and Juizo, D., 2010. Modelling trade-offs between livelihoods and wetland ecosystem services : the case of Ga-Mampawetland , South Africa. Conference of the International Society for Ecological Economics: "Advancing Sustainability in a Time of Crisis”. Oldenburg, Germany.
Murgue, C., 2010. Participatory analysis of tradeoffs between wetland ecosystem services in the Ga-Mampa valley, Limpopo Province, South Africa. Lessons for resources management aiming at wetland sustainability.MSc thesis, SupAgro, Montpellier.
Ostrovskaya, E., Douven, W., Nhari, P., and Schwartz, K., 2010.Assessment of wetland management structures and practices.WETwin project report.
Paneque Salgado, P.; S. Corral Quintana; Ã. Guimarães Pereira; L. del Moral Ituarte and B. PedregalMateos, 2009. Participative multi-criteria analysis for the evaluation of water governance alternatives.A case in the Costa del Sol (Málaga). Ecological Economics 68(4): 990-1005.
Ramsar Convention Secretariat, 2007. River basin management: Integrating wetland conservation and wise use into river basin management. Gland, Switzerland.
Ramsar Convention Secretariat, 2010. http://www.ramsar.org/cda/en/ramsar-documents-info-information-sheet-on/main/ramsar/1-31-59%5E21253_4000_0__#note
Ranganathan, J., 2008. Ecosystem services: a guide for decision-makers. World Resources Institute. Washington DC.
Sanon, S., 2010. Trade-Off Analysis for Floodplain Restoration : -A Case Study of the Lobau Floodplain in Vienna , Austria. Evaluation.UNESCO-IHE Institute for Water Education.
Stockholm Environment Institute 2010 http://www.weap21.org/
TEEB (The Economics of Ecosystems and Biodiversity), 2010. The Economics of Ecosystems and Biodiversity: Mainstreaming the Economics of Nature, A synthesis of the approach, conclusions and recommendations of TEEB. Accessed online November 2011
http://www.teebweb.org/LinkClick.aspx?fileticket=bYhDohL_TuM%3d&tabid=1278&mid=2357. Turner B.L., R.E. Kasperson, P.A. Matson, J.J. McCarthy, R.W. Corell, L. Christensen, N. Eckley, J.X. Kasperson, A. Luers, M.L. Martello, C. Polsky, A. Pulsipher and A. Schiller. 2003. Framework for vulnerability analysis in sustainability science. Proceedings of the National Academy of Sciences, USA. PNAS 100: 8074–8079.
UN, 1994. Agenda for development. United Nations General Assembly, New York.
http://www.un.org/Docs/SG/ag_index.htm
UNESCO, 2009.IWRM guidelines at river basin level.UNESCO.A contribution to the World Water Assessment Programme.
USACE 2010a http://www.hec.usace.army.mil/software/hec-hms/
USACE 2010b http://www.hec.usace.army.mil/software/hec-ras/
Van Ingen, T., 2010. Report on Stakeholder Analysis and Strategies for Stakeholder Engagement. WETwin project document
PART B – Case studies
5 Ga Mampa (South Africa)
5.1 Decision space
5.1.1 Management solutionsManagement solutions were elaborated by combining management options addressing different management issues (see WETwin D7.2). On the basis of stakeholder preferences and the practicality of implementation, the research team identified four solutions, chosen to emphasize each of the three pillars of sustainable development (economic development, environment conservation and social equity) plus a balanced integrated solution. At a workshop in March 2011, stakeholders discussed proposed solutions and elaborated their own solutions, in order to fulfil a defined objective. The three new solutions are mapped in the sustainable development triangle in Figure 5.1 below. Management options retained in each solution are described in Table 5.1.
Figure 5.1: Conceptual map of MS in the
sustainable development triangle
5.1.2 Criteria for evaluation
23 indicators grouped in 5 criteria categories are considered for the evaluation: among them 13 are quantitative indicators and 10 are qualitative, presented in the following table with their respective type of value function and indication of minimal and maximal thresholds. Rationale for all criteria value functions is given in WETwin D7.1. Regarding environmental sustainability, 6 indicators have been defined: three correspond to the WET-Health indicators developed under a WRC research project (Macfarlane et al. 2008); each of them is a combined impact score ranging from 0 to 10 with 10 corresponding to the highest negative impact. Each score encompasses several types of impacts from diverse forms of pressure. Three quantitative indicators have also been proposed to measure the impacts of management options on wetland health. They are used as output variables in the WETSYS model. These two sets of indicators are to be used alternatively; only 20 indicators are thus simultaneously used.
These indicators and their value functions were submitted to stakeholders’ assessment during a workshop in October 2011. In general, indicators and their value functions were validated by stakeholders. The most contested indicators are related to social equity, especially to land access. Participants of the workshop (mainly local stakeholders) did not agree with the proposed value function for percentage of wetland farmers with access to irrigation scheme. They explained that, for
MS 1
MS 2
Table 5.1:
Management options composing proposed management solutions for Ga-Mampa wetland managementMS1 MS2 MS3 ENV. ECO. SOC. INT.
Rehabilitation of irrigation schemes Drip + gravity (repaired ) Drip + gravity (improved) Drip IS commerci al Drip + gravity (repaired ) Drip IS commerci al Gravity subsistenc e Drip + gravity (repaired)
Wetland use Not specified 50% natural 50% natural 75% natural 35% natural 50% natural 50% natural
Livestock current Grazing
control Feedlot current
Grazing control current Grazing control Wetland cropping practices
current Improved improved improved current current improved
Eco-tourism Yes Yes Yes Yes Yes Yes
Land conservation (*) Gabions Local institutions Specialize d committee s Specialized committees Integrated committee Integrated committee Specialized committees Integrated committee Integrated committee Wetland management plan
Local plan Coordinated gov. Plan Coordinated gov. plan Coordinate d gov. plan Coordinated
gov. plan Local plan Local plan
Environmental legislation Identified office Appropriate means Identified office Appropriate means Identified office Appropriate means Identified office Appropriate means No office in charge No office in charge Identified office Appropriate means Others (*) Education programs Alternative livelihoods for farmers moving out of the wetland Business plan
(*) these options are not taken into account in the assessment process because they could not be documented due to time constraints
Table 5.2:
Indicators for assessing management solutions in Ga-Mampa case studyCriteria Indicators Qualit. Quantit Type of value function
En vi ro n men ta l s u sta in ab ili
ty Average depth of groundwater table
in dry season X
Minimize; maximal below 1 m, minimal above 2 m
% of natural vegetation X Maximize, maximal above 75% River outflow as a % of natural flow
in dry season X
Maximize, minimal below 20%, maximal above 75%
WEThealth Hydrology X Minimize
WEThealth Geomorphic X Minimize
WEThealth Vegetation X Minimize
Ec o n o mi c d ev el o p men
t % of maize needs covered by local
production (wetland + irrigation) X Maximize, minimal at 0, maximal above 80% % of cash basic needs covered by
cash income from natural resources X
maximize, minimal below 50% Opportunities for local off-farm job X 3 levels: low, medium, high
So ci al e q u ity
% of irrigation scheme area irrigable
in dry season X Maximize, minimal below 20%
% of wetland farmers having a plot in
IS X Minimize, minimal above 33%
% of households with access to IS or
wetland plot X Maximize, maximal above 66%
type of access to land X 2 levels: unregulated, regulated % of households engaged in reeds
and sedges collection X Maximize, maximal above 25% Grazing opportunities in the wetland X
Maximize, 3 levels: limited to river bank, free access to crop residue, crop residues and pastures C o st e ffe cti ve n e ss
Investment costs (% of municipal
capital budget) X
Minimize, minimal below 15% , maximal above 50%
Costs for O&M +renewal (% of
average household income) X Minimize, minimal above 10% Share of capital costs supported by
local users X Minimize, minimal above 15%
Share of O&M costs supported by
local users X Maximize, maximal above 20%
In sti tu ti o n al c la ri ty
Local committees and user
participation X
3 levels: none, specialized, integrated & coordinating
Rule clarity X 3 levels: no rules, clear rules, coordinated and enforced
Awareness raising / training program X 3 levels: none, once off, continuous Coordination of government
programs X
4 levels: none; separated plans from each government dept; active communication among government dept;, community & government coordinated project
cultural reason, it is very unlikely that a farmer will let his/her plot to another one on a long term basis, even if he/she does not use it. However, as participants failed to propose an alternative indicator for the corresponding management principle (“access to cropping land is fair”), which was considered as important during the March 2011 stakeholder workshop, we decided to maintain this indicator in the list. Some other indicators such as opportunities for local off-farm jobs or grazing opportunities, also contested but with a lesser importance, can be removed from the list of indicators, which would be reduced to 18 indicators.
5.1.3 Storylines and scenarios for the GaMampa Case Study
DPSIR analysis (Zsuffa et al. 2010) indicates that the main issues of concern at GaMampa are loss of livelihood support (food production and other benefits) from the wetland and overall degradation in wetland health, due to increased pressure from a number of sources. The function, health and use of the wetland by the community are closely interlinked with other resources in the valley, particularly small irrigation systems bordering the wetlands and drawing from the same water sources. Drivers of change are mainly socio-economic conditions in the community in the valley, including overall population, poverty and availability of alternative livelihoods and food sources, and levels of education, awareness and local governance. Climate change may also affect water availability for the wetland and agricultural productivity.
Three storylines have been formulated to explore research questions on the influence of external drivers (climate, population and economic conditions) on livelihood options of the community, and the way these impact on the management, ecosystem services and health of the wetland. Each storyline has multiple scenarios associated.
Storyline 1: Vulnerability of food production (crop yields, particularly maize) in GaMampa valley (irrigation scheme and wetland) to climate changes over the next 30 years. Three climate outlooks are examined, reflecting likely temperature increase and rainfall variability, based on the regional climate model STAR (Orlowsky et al 2008), assuming temperature increases of 0.5 (1A), 1.0 (1B), and 1.5 (1C) degrees C respectively compared to the period 1961-2000
Storyline 2: Vulnerability of community livelihoods in GaMampa valley to population change over the next 30 years. An increase in population will put more pressure on the wetland and narrow its uses even more if the opportunities for local off farm jobs do not increase too. A decrease or stabilization in population would allow a more formal regulation of uses and encourage a diversity of livelihoods. Three outlooks reflecting likely changes in population were considered: constant population, in-migration and out-migration.
o 2A: BAU constant population
o 2B: population decrease (corresponds to G-Ec in D5.1 global scenarios) – improved economic conditions lead to out-migration, higher external income and food sources, lower pressures on wetland.
o 2C: population increase (corresponds to R-Ec in D5.1) – low rates of growth and high unemployment result in move back to rural areas, high dependence on local resources, low external income
Storyline 3: Vulnerability of wetland health (water supply, natural resources) in GaMampa valley to climate change and population growth over the next 30 years. Only the worst case outlook was considered (population increase, low economic growth, decrease in water availability), corresponding to 1B + 2C above.
Based on the storylines above 3 scenarios have been described in detail for further analysis of vulnerability of the system:
Scenario 2: optimistic: population decrease (corresponds to G-Ec) – improved economic conditions lead to out-migration, higher external income and food sources, lower pressures on wetland; better institutional support for NRM. Climate from 1A
Scenario 3: worst case - population increase (corresponds to R-Ec) – low rates of growth and high unemployment result in move back to rural areas, high dependence on local resources, low external income, low levels of government support for NRM. Climate from 1B.
Details of the scenarios are set out in Honarmand (2011).
The WETSYS model is being used to assess impacts of the scenarios on food production, livelihoods and wetland health. This work is on-going in Irstea (formerly Cemagref); as of January 2012, results were not yet available.
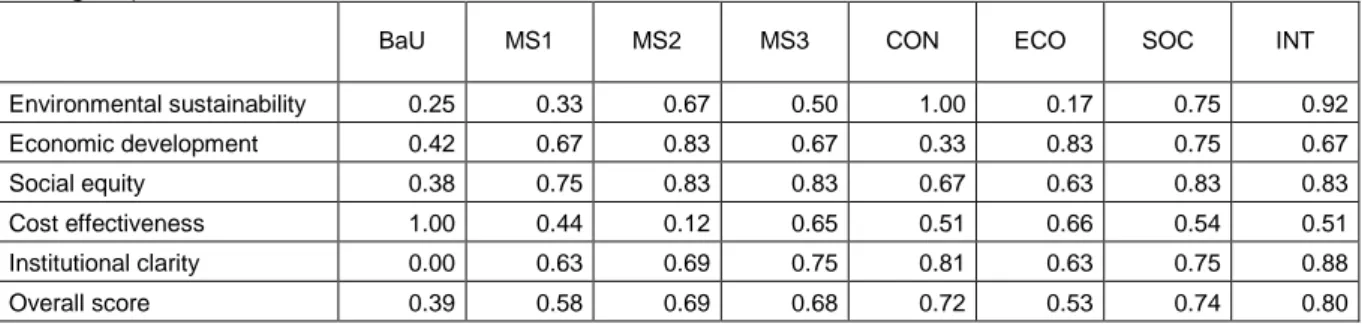
5.2 Results of expert analysis
5.2.1 Scoring of solutionsThe evaluation matrix (Table 5.3) was elaborated by the research team on the basis of information collected through hydrological monitoring, field observation, household surveys, expert interviews and stakeholders’ input (focus group discussions, workshops) (partially reflected in Murgue 2010). It corresponds to a qualitative expert judgment and is meant to be updated with results from undergoing modeling efforts (WETSYS integrated model and farming system model).
Indicator nominal values were first determined for each management option independently on the basis of the options assessment undertaken by Murgue (2010). In particular, we identified whether the impact of the management option on indicators was direct, indirect, or the indicator was irrelevant for the option. When ascribing indicator values to management solutions, we first considered which options, among those forming the solution, have the main direct impact on the considered indicator, and their respective indicator values. We then analyzed how the combination with other options can possibly modify these indicator values, as shown in the following examples.
First example: impact of MS1 on percentage of maize needs covered by local production Management options with an impact on indicator Impact of MO on indicator Global impact of MS on indicator Comment Restored canal + drip system + ++
Maize production in irrigation scheme can be increased with higher water availability and wetland cropped area remains high
35% of natural
vegetation =
Second example: Impact of MS3 on average depth of groundwater in dry season Management options with an impact on indicator Impact of MO on indicator Global impact of MS on indicator Comment
drip system - (Limited leakages from irrigation scheme)
-
Higher water retention capacity in the wetland does not compensate the
reduction of leakages from the irrigation scheme 50% of natural
vegetation
+ (Higher water retention capacity)
Improved cropping
practices +
This process necessarily results in some uncertainties on criteria scores and therefore results of assessment should be considered with caution.