HAL Id: hal-03247423
https://hal.sorbonne-universite.fr/hal-03247423
Submitted on 3 Jun 2021HAL is a multi-disciplinary open access archive for the deposit and dissemination of sci-entific research documents, whether they are pub-lished or not. The documents may come from teaching and research institutions in France or abroad, or from public or private research centers.
L’archive ouverte pluridisciplinaire HAL, est destinée au dépôt et à la diffusion de documents scientifiques de niveau recherche, publiés ou non, émanant des établissements d’enseignement et de recherche français ou étrangers, des laboratoires publics ou privés.
Comparison of size-structured and species-level trophic
networks reveals antagonistic effects of temperature on
vertical trophic diversity at the population and species
level
Willem Bonnaffé, Alain Danet, Stéphane Legendre, Eric Edeline
To cite this version:
Willem Bonnaffé, Alain Danet, Stéphane Legendre, Eric Edeline. Comparison of size-structured and species-level trophic networks reveals antagonistic effects of temperature on vertical trophic diversity at the population and species level. Oikos, Nordic Ecological Society, In press, �10.1111/oik.08173�. �hal-03247423�
www.oikosjournal.org
OIKOS
Oikos
––––––––––––––––––––––––––––––––––––––––
© 2021 The Authors. Oikos published by John Wiley & Sons Ltd on behalf of Nordic Society Oikos.
Subject Editor: Gregor Kalinkat Editor-in-Chief: Dries Bonte Accepted 18 April 2021
00: 1–13, 2021
doi: 10.1111/oik.0817300 1–13
It is predicted that warmer conditions should lead to a loss of trophic levels, as larger bodied consumers, which occupy higher trophic levels, experience higher metabolic costs at high temperature. Yet, it is unclear whether this prediction is consistent with the effect of warming on the trophic structure of natural systems. Furthermore, effects of temperature at the species level, which arise through a change in species composition, may differ from those at the population level, which arise through a change in population structure. We investigate this by building species-level trophic networks, and size-structured trophic networks, as a proxy for population structure, for 18 648 stream fish communities, from 4 145 234 individual fish samples, across 7024 stream locations in France from 1980 to 2008. We estimated effects of temperature on total trophic diversity (total number of nodes), vertical trophic diversity (mean and maximum trophic level) and distribution of biomass across trophic level (correlation between trophic level and biomass) in these networks. We found a positive effect of temperature on total trophic diversity in both species- and size-structured trophic networks. We found that maximum trophic level and biomass distribution decreased in species-level and size-structured trophic networks, but the mean trophic level decreased only in size-structured trophic networks. These results show that warmer temperatures associate with a lower vertical trophic diversity in size-structured networks, and a higher one in species-level networks. This suggests that vertical trophic diversity is shaped by antagonistic effects of temperature on population structure and on species composition. Our results hence demonstrate that effects of temperature do not only differ across trophic levels, but also across levels of biological organisation, from population to species level, implying complex changes in network structure and functioning with warming.
Keywords: body size, fish community, ontogenetic diet shifts, temperature, trophic networks
Comparison of size-structured and species-level trophic networks
reveals antagonistic effects of temperature on vertical trophic
diversity at the population and species level
Willem Bonnaffé, Alain Danet, Stéphane Legendre and Eric Edeline
W. Bonnaffé (https://orcid.org/0000-0002-5053-8891) ✉ (w.bonnaffe@gmail.com) and E. Edeline (https://orcid.org/0000-0003-4963-4453), Sorbonne
Université, Université Paris Diderot, UPEC, CNRS, INRA, IRD, Inst. d’Ecologie et des Sciences de l’Environnement de Paris (iEES-Paris), Paris, France. Present address for WB: Ecological and Evolutionary Dynamics Lab, Dept of Zoology, Univ. of Oxford, Oxford, UK. EE also at: ESE Ecology and Ecosystem Health, INRA, Agrocampus Ouest, Rennes, France. – WB and S. Legendre: Inst. de Biologie de l’Ecole Normale Supérieure (IBENS), CNRS, INSERM, Ecole Normale Supérieure, PSL Research Univ., Paris, France. – A. Danet, Centre d’Ecologie et des Sciences de la Conservation, UMR 7204 MNHN-CNRS-Sorbonne Université, Muséum National d’Histoire Naturelle de Paris, Paris, France.
Introduction
Climate change, through warming, has the potential to alter the functional structure of ecosystems (Parmesan 2006, Lavergne et al. 2010, Urban et al. 2012), an essen-tial part of which is captured by trophic interaction net-works (Hattab et al. 2016). Understanding these effects is difficult as it calls for an understanding of how temperature effects on individuals may alter trophic interactions at the community level.
Trophic interactions determine both the amount and pathways of biomass transfers in ecosystems, thereby modulating ecosystem functioning. For instance, the nature and strength of interactions determine the vertical distribution of biomass (Thébault and Loreau 2006, Schneider et al. 2016, Barbier and Loreau 2019). In addition, the maximum trophic level in a community may influence total nutrient recycling, and hence primary production (Wang et al. 2019). Finally, the addition or removal of trophic levels is predicted to strongly affect the persistence of the community, through trophic cascade effects (Shanafelt and Loreau 2018). As network structure influences the functioning of ecosystems, it is crucial to document how warming will affect network structure as this may be an important pathway for effects of global warming on aquatic communities.
Two features of aquatic systems make them prime candidates for elucidating effects of warming on ecosystem trophic structure (Perkins et al. 2010, Jochum et al. 2012, Romero et al. 2016). First, aquatic systems are particularly sensitive to warming, given that most aquatic organisms are ectotherms (Perkins et al. 2010, Shurin et al. 2012, Edeline et al. 2013), which means that whole-body metabolic costs increase with external temperature (Brown et al. 2004, Hart and Reynolds 2008). In turn, metabolic costs also increase with body size, so that larger bodied aquatic organisms experience stronger negative effects of temperature. Second, body size determines the trophic ecology of a majority of individuals and species, in such a way that larger bodied aquatic organisms tend to have a higher position in the trophic network (a.k.a. trophic level) (Mittelbach and Persson 1998, Specziár and Rezsu 2009).
The allometric scaling of temperature-related metabolic costs and trophic level allow us to map effects of temperature on the trophic structure of aquatic systems through a bottom– up and top–down pathway (Arim et al. 2007, Beveridge et al. 2010, Stegen et al. 2012). The top–down pathway is medi-ated by a negative effect of temperature on larger bodied con-sumers, as energetic demand increases with temperature and body size (Brown et al. 2004), and thereby on higher trophic levels, given that trophic level increases with body size. Thus, warmer conditions should associate with a loss of top tro-phic consumers and thereby lower vertical trotro-phic diversity (i.e. lower mean and maximum trophic levels) (Arim et al. 2007, O’Connor et al. 2009, Stegen et al. 2012). Conversely, the bottom–up pathway consists in a positive effect of tem-perature on primary production and decomposition, which by increasing biomass production (de Sassi et al. 2012)
may alleviate resource constraints in higher trophic lev-els (O’Gorman et al. 2017). Thus, warmer conditions may support both a higher total diversity (i.e. more species and size classes) and vertical trophic diversity. Yet, as autotrophs tend to be less sensitive to temperature than heterotrophs, energetic demand in consumers is expected to increase faster than production rates with warming (O’Connor et al. 2009), potentially leading to higher mortality through starvation in higher trophic levels (Binzer et al. 2012). Therefore, top– down effects are expected to outweigh bottom–up effects, especially in higher trophic levels (Voigt et al. 2010), so that warmer temperatures may support a higher total trophic diversity, but a lower vertical trophic diversity. Overall, this pattern may also coincide with a shift of the distribution of biomass across trophic levels towards lower trophic levels, as biomass is gained from primary production in lower parts of the networks, while being lost in higher trophic levels to individual mortality and species extinction.
Evidence for such a response to warming in natural tro-phic networks remains scarce, making it unclear whether theoretical predictions and experimental evidence hold in a natural setting (Perkins et al. 2010, O’Gorman et al. 2012, Stegen et al. 2012, Lang et al. 2014, Tylianakis and Morris 2017). The few empirical evidence we have is not consen-sual. One experimental study demonstrated that effects of temperature on top consumers depended on primary pro-duction (O’Gorman et al. 2017). Studies monitoring tro-phic structures of natural systems across thermal gradients found either an increase in top predator species biomass with temperature (Romero et al. 2016) and an increase in occurrence of larger consumers (O’Gorman et al. 2017), or a decrease in the number of different trophic levels present resulting in simpler and shorter food chains (Hattab et al. 2016, O’Gorman et al. 2019), along temperature gradi-ents. These studies demonstrated that effects of temperature could either be beneficial or detrimental to higher trophic levels depending on the context of the study (O’Gorman et al. 2017).
Inconsistencies in temperature effects may be caused by changes in species composition along thermal gradients. Such changes in the trophic structure at the species level may mask changes at the population level, hence preventing us from detecting a consistent effect of temperature on trophic structure across systems. Despite that, no study to our knowledge compared temperature effects on species-level trophic networks to those that might arise in higher resolution networks, such as size-structured trophic networks, which serves as a proxy for the population level to the extent that individuals can be regressed to their body size. There is hence a need for monitoring changes both at the population and species level when estimating effects of temperature on trophic structure.
We thus propose to address the following questions: 1) are the effects of temperature on the trophic structure of fish communities, characterised by total and vertical trophic diversity, consistent with theoretical predictions? And 2) are changes in trophic structure at the species-level consistent
with those at the population-level? Our working hypothesis is that following the bottom–up and top–down pathway for temperature effects described above, we expect warmer conditions to support a higher total trophic diversity, but a lower vertical trophic diversity (Arim et al. 2007, Stegen et al. 2012, O’Gorman et al. 2019). Consistently with this pattern, the distribution of biomass in the trophic networks should relocate towards lower trophic levels as temperature rises. Therefore, we predict that 1) the mean and maximum trophic level of natural trophic networks should decrease with temperature, and that the relationship between biomass and trophic level should also decrease with temperature. Furthermore, under the assumption that population-level effects of temperature can be extended to the species level, which holds if inter-specific variation in trophic ecology is weak, we predict that 2) size-structured and species-level trophic networks should change similarly with temperature.
To test these predictions, we built 37 296 stream fish trophic networks, distributed in two sets, either size-structured networks as a proxy for trophic structure at the population level, or unstructured networks as a proxy for trophic structure at the species level, spanning 28 years and 7024 locations in France, using 4 145 234 individual fish samples and information on fish trophic ecology from the literature. Then, we estimated effects of temperature on the total and vertical trophic diversity of each network through multiple regression in linear mixed effect models. Total trophic diversity was quantified as the number of nodes in the networks, and vertical trophic diversity was quantified as the mean and maximum trophic level and the correlation between biomass and trophic level (i.e. the tendency for biomass to increase or decrease across trophic levels). Overall, we find that the mean and maximum trophic level, as well as correlation between biomass and trophic level, decrease with temperature in size-structured networks. In contrast we find an increase in mean trophic level at the species level and an overall increase in total trophic diversity. Our study thus demonstrates that temperature has synergistic effects on total trophic diversity, and antagonistic effects on the vertical trophic diversity of fish communities, at the population and species level. These results thus show that effects of temperature may differ across trophic levels and also across levels of organisation. We also discuss why theoretical predictions of a decrease in vertical trophic diversity only captures changes at the population level, and why species level effects deviate from it.
Methods
System and data
We used a dataset from a previous study (Edeline et al. 2013) which consisted in 4 145 234 individual body size measure-ments of fish, representing 50 fish species, collected during 20 809 fishing operations of the French Office of Water and Aquatic Ecosystems (formerly ONEMA, now ONB) from
1980 to 2008, at 7024 stream stations distributed across eight hydrographic basins in France (see Edeline et al. 2013 for further details on sampling scheme). Mean air tempera-ture during the two years prior to sampling were available for each fishing operation. Monthly mean air temperature was obtained by interpolating monthly temperature averages recorded at 1085 meteorological stations (see Edeline et al. 2013 for details). The temperature was averaged over two years prior to sampling to better capture the average thermal conditions at a given site. Mean air temperature is a suitable proxy for water temperature, and that both for groundwa-ter dominated and non-groundwagroundwa-ter dominated systems, though groundwater dominated rivers are slightly less sensi-tive to variations in air temperature (Caissie 2006).
Network construction
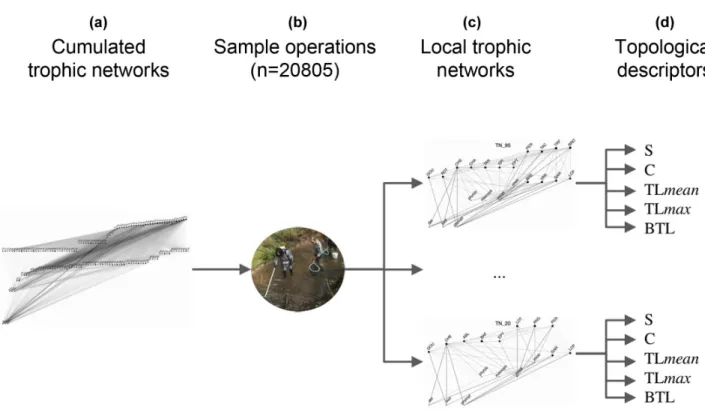
To characterise the trophic structure of fish communities, we first built 'global trophic networks' (also referred to as 'metawebs' in other works, Gravel et al. 2013), based on the literature regarding changes in diet with body size for each fish species (Fig. 1a). From the global networks, we extracted local trophic networks (Fig. 1c), associated with each fishing operation (Fig. 1b), thereafter referred to either by ‘global’ or ‘local’ networks.
Global trophic networks
Global networks can be viewed as maximum possible networks as they feature all nodes and links that we expect to find in a community containing all 50 fish species in our dataset. Such a network is hypothetical in that the 50 fish species may not necessarily co-occur in reality. Global networks consist of 1) resource nodes (R) and fish nodes (F), and 2) an interaction matrix representing links between nodes. We built two global networks: 1) a size-structured global network comprising nine size classes per species corresponding to nine quantiles of the empirical body size distribution of each species in the dataset, and thereby 50 × 9 fish nodes, and 2) an unstructured global network featuring 1 size class per species, thus containing 50 × 1 fish nodes. We refer to each type of network either by ‘size-structured’ or ‘species-level’ thereafter. Changes in the structure of species-level networks can only arise through a change in the species composition of the network. Species-level networks hence serve as a proxy for the trophic structure of the community at the species level. The structure of size-structured networks can be altered as a result of a change in species composition, but also through a change in the size structure of populations. Size-structured networks hence serve as a proxy for the trophic structure of the community at the population level. We were hence able to distinguish population-level changes in trophic structure of local communities, namely adjustments in population size structure, from species-level changes, that is changes in species composition, by comparing size-structured and species-level networks (Fig. 2 top and bottom, Fig. 1a).
In order to establish nodes and interactions in global networks, we identified the diet of each species, their
ontogenetic diet shifts (i.e. changes in diet with size, thereafter termed ‘diet shifts’) and size-dependency in piscivory. For this purpose, we searched reviews and articles that contained information about fish diet and ontogeny (89 articles in total), as well as the Fishbase database (Froese and Pauly. 2015). General literature resources were acquired by querying google Scholar and Web of Science with all possible combinations of keywords such as ‘ontogenetic diet shifts’, ‘size-dependence’, ‘piscivory’, ‘freshwater fish diet’ and relevant synonyms (from February to March 2016). For species that were not featured in these general resources, we narrowed down our search to articles that contained the Latin and/or vernacular name of the given species and looked for evidence of information on their diet. All references are listed in the Supporting information directly in relation to the trophic interaction they support.
Defining nodes
We defined resource nodes as seven primary non-fish food sources (R = {R1, …, R7}) of the 50 fish species (Allan and Castillo 2007, Hart and Reynolds 2008): Nutrients and detritus (R1, i.e. dead organic matter and inorganic nutri-ents), biofilms (R2, i.e. assemblages of micro-organisms), phytobenthos (R3, i.e. small plants growing on the sub-strate), macrophyte (R4, i.e. plants extending in the water column), phytoplankton (R5, i.e. drifting algae), zooplank-ton (R6, i.e. drifting micro-organisms) and zoobenthos
(R7, i.e. macroinvertebrates living on the bottom). Since we had no information about the presence/absence of the resource nodes, we assumed that the seven resource nodes were present in all the networks.
We defined the set of fish node of the size-structured global network by splitting each fish species into nine size classes, each bounded by a minimum and maximum size matching lower and upper boundaries of nine empirical quantiles of the species’ size distribution across the entire dataset. The body size corresponded to the total body length of individual fish sampled (mm, from tip of the snout to the fork). The species-level global network was obtained by merging the size classes and associated links of the size-structured global network into one. We chose nine classes because it corresponded to a resolution for which the global network metrics remained constant with changes in the number of size classes, namely the main descriptors were virtually identical for global networks featuring either 8, 9 or 10 size classes.
Defining links
Resource–resource links were derived from the literature (Allan and Castillo 2007, Hart and Reynolds 2008): detritus and biofilms did not consume any other node; phytoplankton, phytobenthos and macrophytes, were assumed to feed on detritus; zooplankton fed on phytoplankton and itself, and zoobenthos fed on every other non-fish node and on itself.
Figure 1. construction of local trophic networks and topological descriptors. Size-structured and species-level cumulated trophic networks are built based on the literature and size-dependency in trophic interactions for all 50 fish species in the dataset (a). Local trophic networks are generated by extracting nodes and links in cumulated networks matching fish sampled during sample operations (b), resulting in 20 805 × 2 size-structured and species-level local trophic networks (c). Trophic diversity (S), connectance (C), maximum and mean trophic level (TLmean and TLmax) and biomass trophic level (BTL), are then computed for each network (d).
Resource-fish links were established according to the diet of fish species, known from fish trophic guild (Hart and Reynolds, 2008), and to ontogenetic diet shifts, as informed by the literature (Supporting information). The size at the
diet shift was known for some species (22/50 species, Specziár and Rezsu 2009) and was otherwise set to match records of stomach contents available in the literature (Supporting information, Fig. 3a).
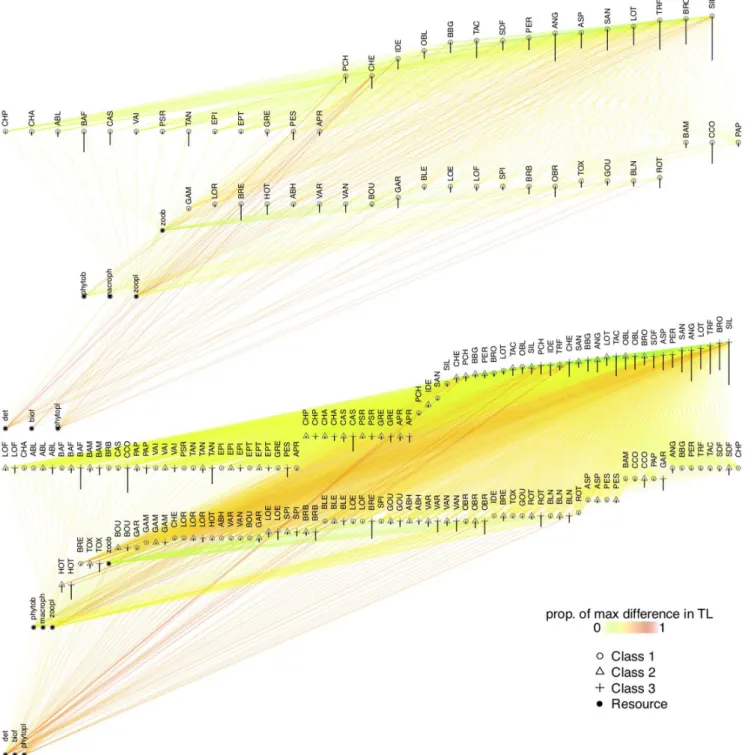
Figure 2. Species- and size-structured global trophic networks. The species-level and size-structured global trophic networks (up and down, respectively). For the sake of clarity, only three (out the nine considered in the analysis) size classes are displayed in the size-structured global network. Circular, triangular and crossed nodes correspond to the first, second and third size class of fish species, while black circular nodes are non-fish nodes. The label of the nodes corresponds to species code (see the Supporting information for correspondence). The descending line on each node corresponds to the mean body size of the size class. Nodes are vertically sorted by increasing trophic level. Warmer link colours are proportional to the difference between the trophic level of the predator and prey nodes (expressed as proportion of maximum difference).
Finally, fish–fish (i.e. piscivorous) links were constructed based 1) on reports of occurrence of piscivory and 2) onto-genetic shifts to a piscivorous diet informed by the literature and 3) on a derivation of the ‘predation window’ model (Mittelbach and Persson 1998, Claessen et al. 2000) (Fig. 3b), which is a common and well supported framework for fish– fish interactions (Gravel et al. 2013, Brose et al. 2019). This model posits that the prey/predator body size (i.e. body length) ratio falls between a minimum α and a maximum β that jointly define the lower and upper range of the preda-tion window (the lines of slopes α and β delineate the lower and upper boundaries of the grey triangular area in Fig. 3b). We further assumed that a piscivorous link between two size classes existed if the midpoint of the prey body size class was contained in the predation window corresponding to the midpoint of the predator body size class. Parameter α was considered as being not subjected to inter-specific variation (Hart and Reynolds 2008), and was therefore set to 0.03 for all piscivorous fish species (Claessen et al. 2002). Parameter β was either readily available from the literature (Mittelbach and Persson 1998) (8/15 species), or set to capture the maxi-mum prey size observed in prey–predator size data (3/15 spe-cies), or set to the average of the values reported in other piscivores (β = 0.455) (4/15 opportunistic piscivorous spe-cies, see the Supporting information for details). Fish–fish trophic interactions were hence established by considering sequentially all piscivorous size classes in size-structured or species-level networks and for each of them identifying all other size classes that fall in their predation window.
Local trophic networks
We derived local networks by matching nodes (i.e. size classes), and associated links, in the size-structured and spe-cies-level global networks to individual fish sampled during
each fishing operation (Fig. 1c). More specifically, a size class of a given species was sampled from the global network if at least one individual fish of that species in the sample had a size comprised between the lower and upper boundaries of that size class. In total, we generated 20 809 × 2 local net-works (i.e. one size-structured and species-level local network per fishing operation). Additionally, all seven non-fish nodes, and associated links, were assumed to be present in all local network. Only networks containing at least two fish nodes were retained, resulting in 18 648 × 2 local trophic networks.
Network topology
We then characterized the trophic structure of the 18 648 × 2 local networks by calculating five topological descrip-tors, portraying total trophic diversity (i.e. number of tro-phic species/nodes), vertical trotro-phic diversity (i.e. the mean and maximum trophic level) and the vertical distribution of biomass in the network (i.e. the correlation between biomass and trophic level) (Fig. 1d). Four descriptors were determined using the n_w program (Gauzens et al. 2015): 1) the total trophic diversity (S), which measures the overall diversity in the network (i.e. number of size groups/species depending on resolution), hence approximated by the total number of nodes; 2) the connectance (C), which measures link density, calculated as L/(S^2), where L is the total num-ber of trophic links; the vertical trophic diversity, captured by 3) the mean (TLmean) and 4) maximum trophic level (TLmax) of nodes, given that the trophic level of a node is calculated recursively as the average of the trophic levels of its prey-nodes plus one (the trophic level of basal species being 1). In addition, we calculated 5) a biomass-trophic level correlation descriptor (BTL) for each local network as Pearson’s correlation coefficient between the biomass and
Figure 3. Building fish–resource and fish–fish trophic interactions. Fish–resource interactions are built based on the literature and ontogenetic diet shifts (left). For instance, the roach is divided into three size classes corresponding to ontogenetic diet stages (X1, X2, X3, a), the stage X1 feeds solely on resource 6, while X3 feeds solely on R7, X2 being the intermediate stage, as for the pike Esox lucius, Z1 is a non-piscivorous class, while Z2 and Z3 feed on the roach. Fish–fish trophic interactions are established following the predation window model (right) informed by the literature, which assumes that a predator size class, e.g. Z2, consumes a prey size class, e.g. X1, only if that prey size class is contained in its predation window, i.e. X1 in the interval Xmin prey, Xmax prey (considering the midpoints of size classes).
the trophic level of the nodes. This last descriptor character-izes whether the biomass is distributed more towards the bottom (i.e. BTL < 0), or the top (i.e. BTL > 0) of the networks. We calculated the biomass of each node of each local network by summing the fresh body mass of all sam-pled individuals belonging to that node. Fresh body mass was calculated from body length following the allometric relations W = a × Length^b with species specific coefficients documented in Fishbase (Froese and Pauly 2015).
Statistical analysis
We inferred the relationship between temperature and total and vertical trophic diversity by estimating effects of tem-perature on the topological descriptors, and by comparing effects between the size-structured and species-level net-works. The final dataset for the statistical analysis featured 10 topological descriptors (five for each size-structured and species-level local networks) treated as response variables, as well as nine explanatory variables: 1) air temperature, 2) mean stream width, 3) mean stream slope, 4) month of the year and 5) year of sampling, 6) sampling site location and 7) hydrographic basin and 8) strategy and 9) technique of the sampling scheme, for each of the 18 648 fishing opera-tion (Edeline et al. 2013 for details). Variables (2) to (9) were included in the analysis to control for confounding environ-mental effects, such as seasonality, which may mask effects of temperature. As these did not contribute directly to the aim of the paper, we placed the discussion of associated results in the Supporting information. The effects of temperature we report can arise from temperature variation across the differ-ent locations that were sampled, or from temporal variation of temperature at the same location across repeated sampling events. Though we accounted for these two sources of varia-tions in our statistical models, in this manuscript we focussed on overall effects of temperature.
We standardized all quantitative explanatory variables with respect to their sample mean and standard deviation and made sure of absence of collinearities and residual correlations in our models. We transformed response variables when necessary to guarantee normality of residuals, namely by taking the natural logarithm of the total trophic diversity, the connectance and by taking the average and maximum trophic level to the fourth power.
We addressed the effect of temperature on topological descriptors using multiple regression in a linear mixed-effect model (library lme4, R v3.0.1 <www.r-project.org>):
Yijlmk= + ´temperature+ ´temperature + ´streamwidth
+ a b g b b 0 1 1 2 2 3´´ + ´ + ´ + ´ + +
streamslope month month year basin basi
b4 g2 2 b
5
1 1
( | ) ( | nn station method method technique Eijlmk
: ) ( | ) ( | : ) + + + 1 1
With Yijlmk being the topological descriptor of the fish com-munity k sampled using method m of sampling strategy l
at location j of basin i. We estimated linear effects (β1, β2, β3, β4 and β5) of temperature, stream width, stream slope, month and year, implemented as numerical variables, to con-trol for changes in stream morphology, seasonal and yearly changes in the descriptors. We further modelled quadratic effects (γ1 and γ2) of temperature and month, to address nonlinearity in temperature effects and to control for non-linear seasonal variation in network structure that would not be explained by fluctuations in temperature. In addition, we also added Gaussian (mean of 0 and specific variances σUi, σVj(i), σLl and σMm(l)) random effects for station, nested in basin (1|basin) + (1|basin:station) and for technique, nested in method (1|method) + (1|technique:method), to account for changes sampling scheme and spatiotemporal pseudo-replication that may arise because of repeated sampling at the same stations and basins throughout the years. In this way the general effects of temperature that we recover from these models are robust to spatially and temporally repeated mea-surements in the same locations, and to seasonal and long-term changes in trophic structure that may not be accounted for by temperature. In total, we built 10 full-models, one for each topological descriptor, that we simplified following a step-wise AIC-based backward procedure. At each step, the most suitable term to delete was identified by considering the term associated with the smallest ∆AIC. Then the sig-nificance of the deletion of the identified term was assessed through log-likelihood ratio tests of the full model compared to the model without the term (χ2-test statistic as appropri-ate for large sample size). The simplification was performed first on random effects, and then on fixed effects (see the Supporting information for details). For a complete presen-tation of model outputs see the Supporting information.
Results
Topology of global networks
The species-level global network features S = 57 nodes (50 fish sp. + 7 resource nodes), a connectance of C = 0.16 and a mean and maximum trophic level of TLmean = 3.51 and TLmax = 4.6. The size-structured global network contains S = 457 nodes (50 fish sp. × 9 size classes + 7 resource nodes) and features a lower connectance (C = 0.11), and a comparable mean and maximum trophic level (TLmean = 3.61; TLmax = 4.65).
Effects of temperature on vertical and total trophic diversity
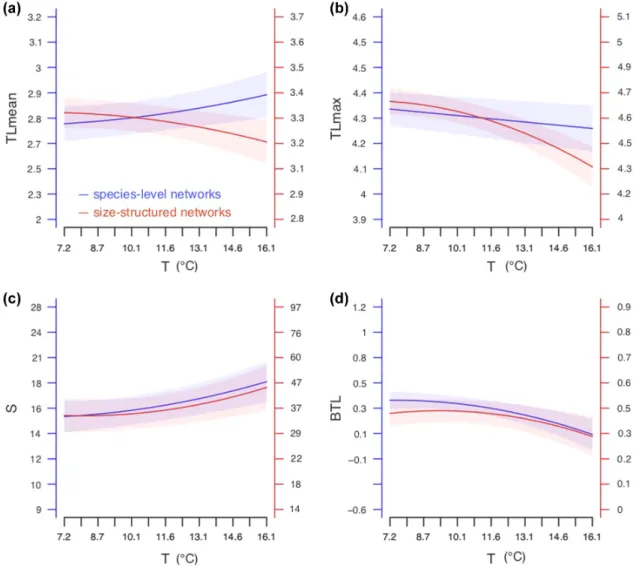
Interestingly, we find that temperature has a convex positive effect on the mean trophic level of species-level networks (Fig. 4a blue line, Table 1) while having a concave negative effect on that of size-structured networks (Fig. 4a red line, Table 1). Temperature has a negative effect on the maximum trophic level in both species-level (Fig. 4b blue line, Table 1) and size-structured networks (Fig. 4b red line, Table 1). The
decrease in maximum trophic level with temperature is sharper in size-structured networks due to a concave relationship. We find a convex positive effect of temperature on total trophic diversity in both species-level (Fig. 4c blue line, Table 1) and size-structured trophic networks (Fig. 4c red line, Table 1).
Effects of temperature on relationship between biomass and trophic level
We find a negative effect of temperature on the correlation between biomass and trophic level in both species-level (Fig. 4d blue line, Table 1) and size-structured trophic net-works (Fig. 4d red line, Table 1). Again, the decrease in the correlation between biomass and trophic level with tempera-ture is sharper in size-structempera-tured networks due to a concave relationship.
Effects of temperature on network connectance
Temperature had a concave negative effect on connectance only in size-structured trophic networks (Table 1).
Temporal patterns and stream morphology
Effects of temporal and stream morphological covariates are presented and discussed in the appendices (Supporting infor-mation). We found a seasonal pattern in the trophic structure of communities as total diversity and mean and maximum trophic levels tended to increase during the summer months. In addition, we also noted a long-term trend as – apart from biomass distribution – the total and vertical diversity increased over the past 30 years. Finally, we found that smaller streams characterised by steep slopes and small widths associ-ated with trophic networks with a lower total and vertical
Figure 4. Change in trophic network topology with temperature. Effect of temperature (T, x axis) on mean trophic level (TLmean, a), maximum trophic level (TLmax, b), number of nodes (S, c) and biomass trophic level correlation (BTL, d) of species-level networks (in blue, left axis, n = 18 648) and size-structured trophic networks (in red, right axis, n = 18 648). Parameters were estimated from multiple regression in minimum adequate linear mixed effect models (Supporting information) obtained from backward step wise AIC based model simplification. The shaded area corresponds to the standard error around model estimates.
trophic diversity. These results did not differ between the size-structured and species-level trophic networks.
Discussion
The main focus of this study is to address 1) whether effects of temperature on the trophic structure of fish communities are consistent with current theory predicting an increase in total trophic diversity, and a decrease in vertical trophic diversity, with increasing temperature, and 2) the consistency of these effects between the population and species level. We find that temperature has a positive effect on total trophic diver-sity both at the population and species level, as the number of nodes increased with temperature in both size-structured and species-level trophic networks. We find evidence for a decrease in vertical trophic diversity in networks with tem-perature, captured by the mean and maximum trophic level. Consistently with this pattern, we find that the distribution of biomass tends to shift towards lower trophic levels in warmer conditions, as shown by the negative effect of temperature on the correlation coefficient between biomass and trophic level. The only deviation from this pattern is the mean trophic level in species-level trophic networks, which tended to increase with warmer temperature. Therefore, vertical trophic diver-sity may increase at the species level and decrease at the pop-ulation level, highlighting potentially antagonistic effects of temperature at the population and species level. This suggests that 1) prediction of an overall decrease in vertical trophic diversity with warming only captures changes in trophic net-works at the population level, but not that at the species level,
and that 2) different mechanisms for temperature effects at the population and species level may be at play.
Consistency of effects of temperature with the literature
Overall, our study suggests that warmer temperatures may reduce vertical trophic diversity at the population level, while increasing that at the species level. Evidence for effects of temperature on the trophic structure of natural fish com-munities jointly at the population level and species level are scarce, as most studies consider either one of the two levels of organisation. Studies that addressed species composition and sorting along large-scale temperature gradients have reported an increase in total and vertical trophic diversity at the species level with temperature (Emmrich et al. 2014, Romero et al. 2016), as the species richness of fish communities tends to be lower and distributed vertically in cold waters, domi-nated by top predator species such as salmonids, while being higher and distributed more horizontally in warm waters, dominated by intermediate trophic level species such as per-cids (Emmrich et al. 2014). O’Gorman et al. demonstrate that warmer temperature may associate with communities populated by larger invertebrate species, and thereby poten-tially increasing vertical trophic diversity at the species level (O’Gorman et al. 2017). This is consistent with the increase in mean trophic level and total trophic diversity with tem-perature that we observe in species-level trophic networks.
In contrast, studies that characterised effects of temperature on local communities, such as marine and freshwater fishes and invertebrate benthic assemblages, with
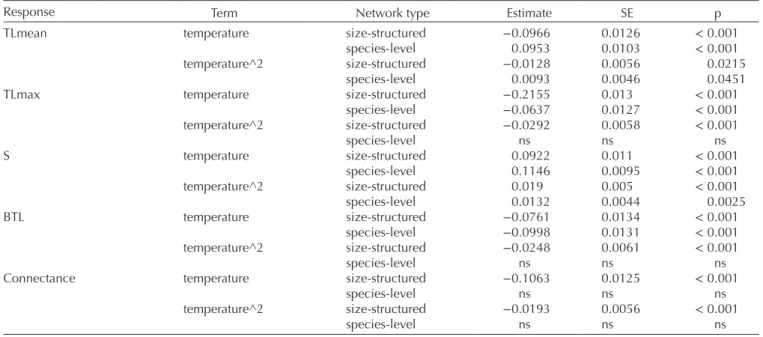
Table 1. Summary of effects of temperature on topological descriptors of trophic networks. The response and term columns correspond to the response and explanatory variables considered in the models, namely the mean and maximum trophic level (TLmean and TLmax), total trophic diversity (S), biomass trophic level correlation (BTL) and connectance (C). The terms temperature and temperature^2 refer to linear and quadratic effects. Network type refers to either the size-structure or species-level networks. Estimate, SD and p refer to the estimated effect, standard error, and p-value in the statistical models (n = 18 648). Complete model results, featuring effects of environmental variables and random effects, are presented in the Supporting information.
Response Term Network type Estimate SE p TLmean temperature size-structured −0.0966 0.0126 < 0.001
species-level 0.0953 0.0103 < 0.001 temperature^2 size-structured −0.0128 0.0056 0.0215
species-level 0.0093 0.0046 0.0451 TLmax temperature size-structured −0.2155 0.013 < 0.001
species-level −0.0637 0.0127 < 0.001 temperature^2 size-structured −0.0292 0.0058 < 0.001 species-level ns ns ns S temperature size-structured 0.0922 0.011 < 0.001 species-level 0.1146 0.0095 < 0.001 temperature^2 size-structured 0.019 0.005 < 0.001 species-level 0.0132 0.0044 0.0025 BTL temperature size-structured −0.0761 0.0134 < 0.001 species-level −0.0998 0.0131 < 0.001 temperature^2 size-structured −0.0248 0.0061 < 0.001 species-level ns ns ns Connectance temperature size-structured −0.1063 0.0125 < 0.001
species-level ns ns ns temperature^2 size-structured −0.0193 0.0056 < 0.001
higher resolution trophic networks reported a decrease of vertical trophic diversity with temperature (O’Gorman et al. 2012, 2019, Hattab et al. 2016). These studies spanned a smaller geographical range compared to studies across thermal gradients, so that effects of temperature reported may more readily be the outcome of changes in local population structure rather than species sorting (e.g. decrease in local body size distributions, Hattab et al. 2016). These studies are consistent with the decrease in mean trophic level that we report in size-structured trophic networks. Overall, our study thus potentially bridges the gap between studies at the species level 1), which report positive effects of temperature on vertical trophic diversity, and those considering higher resolution networks 2), which report negative effects of temperature on vertical trophic diversity. Therefore, temperature may affect total and vertical trophic diversity of trophic networks by altering both population structure and species composition. Our results further imply that discrepancies in effects of temperature do not solely arise across systems (Hattab et al. 2016, Romero et al. 2016), or within system due to differential sensitivity of trophic levels to temperature (Voigt et al. 2010), but also depend on the resolution of the trophic network considered.
Consistency of effects of temperature with theoretical predictions
Following the top–down pathway for temperature effects on fish trophic structure presented in the introduction, which assumes a combination of 1) a negative effect of temperature on larger bodied consumers, through increased metabolic costs, and 2) an increase in trophic-level with body size (Arim et al. 2007, Stegen et al. 2012), we posited that vertical trophic diversity should decrease with temperature and that biomass should relocate towards lower trophic levels.
This prediction is consistent with the negative effect of temperature on vertical trophic diversity and on the relationship between biomass and trophic levels (captured by the biomass-trophic level correlation) that we find in size-structured networks. Our study hence lends support to the role of the top–down pathway in driving effects of temperature on the trophic structure at the population level. Warmer conditions may lead to changes in body-size distributions through negative selection against larger body sizes, which may reduce the occurrence of higher trophic level individuals. This is also in line with studies that provided indirect evidence for negative effects of temperature on vertical trophic diversity at the population level by demonstrating that the body size spectrum of fish communities (Daufresne et al. 2009, Edeline et al. 2013, Emmrich et al. 2014), and invertebrate communities (Yvon-Durocher et al. 2011), tended to shift towards smaller sizes in warmer conditions, including our study system (Edeline et al. 2013).
Yet, although the top–down pathway accounts for the reduction in maximum trophic level and biomass-trophic level correlation we find in species-level networks, it does not account for the positive effect of temperature on mean trophic
level, which implies the existence of possibly multiple comple-mentary mechanisms. This may be attributed to the role of the bottom–up pathway in driving vertical trophic diversity at the species level, by alleviating resource constraints on larger con-sumer through an increase in primary production. This would be further consistent with the findings of O’Gorman et al. which hint that warmer temperature may increase production in basal resource and thereby sustain a larger number of higher trophic species (O’Gorman et al. 2017). Additionally, this pat-tern could be the result of a trophic cascade triggered by the loss of higher top trophic species, which may alleviate predation pressures on intermediate predator species (Beveridge et al. 2010, Strong and Frank 2010, Jochum et al. 2012), thereby increasing the mean, whilst decreasing the maximum, tro-phic level of species-level networks. Alternatively, this may be explained by a strong inter-specific variation in the link between body size and trophic ecology, which would break the body size dependency in trophic level. Indeed, not all interac-tions in our system are solely size-dependent and specific to each species in our dataset (Allan and Castillo 2007, Hart and Reynolds 2008), which may prevent mapping size mediated effects of temperature at the population level onto the species level (Vincent et al. 2020).
Altogether, our study supports the idea that the top–down pathway might reliably predict changes in vertical biomass distribution and occurrence of top predators with warming, both at the population and species level, while the bottom– up pathway might be driving an increase in the occurrence of intermediate trophic level predator species. An interesting area for theoretical investigation would be to aim at understanding in which context the bottom–up and the top– down pathway for temperature effects may lead to opposite effects on population structure and community composition. This calls for an extension of the theory to include size-structure to explain temperature effects on trophic size-structure at the population and species level (Brose et al. 2017).
Implications for the functioning of ecosystems under global warming
Our findings also raise the question as to how the changes in trophic structure driven by temperature may translate into changes in the functioning of ecosystems. Trophic network structure modulates primary production and stability (Shanafelt and Loreau 2018, Wang et al. 2019), the modification of trophic network structure through warming is therefore predicted to alter ecosystem functioning. In particular, Binzer et al. (2012) showed that warming could have antagonistic effect on the stability of trophic networks. Here we find that warming may increase average vertical trophic diversity at the species level, while eroding that at the population level. On the one hand, a higher number of intermediate trophic level species should increase predation pressures on lower trophic level species (Kratina et al. 2012, Shurin et al. 2012, Lang et al. 2014). On the other hand, the loss of higher trophic levels classes in populations should lower overall predation pressures, thus potentially
compensating the species-level effect. However, population-level effects of warming, namely shifts in size distribution of populations, may operate on a shorter time scale than changes in species composition. Therefore, we might expect global warming to reduce vertical trophic diversity of ecosystems at the population level prior to any alteration of species composition (Shurin et al. 2012). Given the complexity of freshwater ecosystems, this could have different effects on community stability depending on whether lower predation pressures favour prey–predator oscillations, stabilisation of population densities or extinctions and trophic cascades. So that our study supports the view that warming may alter ecosystem functioning by reducing vertical trophic diversity at the population level, and thereby top–down control, but it remains unclear whether this will favour or disrupt stability in freshwater systems (Neutel et al. 2007).
Context-dependence in trophic interactions
We built our networks based on co-occurrence data and detailed literature evidence on the taxonomic- and size-dependence in trophic interactions. However, there is evi-dence that trophic interactions are context-dependent, and thus not always at play (Barner et al. 2018, Thurman et al. 2019). Size-dependence is one such source of context-dependence (Gravel et al. 2013), which we have accounted for in depth in the construction of our networks by model-ling ontogenetic diet shifts and size-dependence in piscivory. Furthermore, size-structured networks also account for fine variation in population size structure and thereby allow for nuanced interactions between the different populations pres-ent at a given location, even with binary interactions.
Though body size is a strong determinant of trophic inter-actions, and there is strong support for size-dependent effects of temperature, temperature may further influence trophic interactions through size-independent effects. Because of increased metabolic costs of maintenance at higher tem-perature, consumers may need to increase their assimilation rates (Brown et al. 2004), which may lead to an increase in the number and strength of trophic interactions. Our study does not account for this kind of temperature-dependence in trophic interactions as the effects of temperature on tro-phic structure in our trotro-phic networks can only arise through changes in population structure and species composition. However, our study, which only assumes size-dependence in diet and not temperature dependence, agrees with empirical studies that do not presume of the mechanisms for the effects of temperature (O’Gorman et al. 2017, 2019). This comforts us into thinking that size-dependence in diet and effects of temperature on population size-structure and species com-position may account for a large part of the changes in the trophic structure of aquatic communities along temperature gradients (Brose et al. 2017). It remains that little is known about how temperature-dependence in trophic interactions may shape the trophic structure of natural communities and
condition their response to warming. We view this as a prom-ising area for further research.
Conclusion and prospects
Overall, we find that warmer conditions associate with higher total trophic diversity, and lower vertical trophic diversity at the population level, in spite of a higher vertical trophic diversity at the species level. This highlights potentially antagonistic effects of temperature on population- and species-level trophic structure of fish communities, which shows the importance of accounting for different trophic network resolutions, for instance by implementing population size-structure when building empirical and theoretical trophic networks (Brose et al. 2017). Furthermore, population-level changes in trophic structure were consistent with the top–down pathway for effects of temperature, while species-level changes were consistent with the bottom–up pathway, showing that both pathways may be at play but act on different levels of biological organisation. This highlights the need for an extension of the theory if we are to understand the relationship between temperature and the trophic structure of fish communities at the species level. This can be done for instance by accounting for inter-specific variation in size-dependent predation, ontogeny, ontogenetic diet shifts, as well as in diet type and breadth in existing theoretical models (Arim et al. 2007, Stegen et al. 2012).
Acknowledgements – We warmly thank Nicolas Loeuille, Elisa
Thébault and François Massol for their comments and feedback on early versions of the work, Gabrielle Ringot, David Rozen, Loïc Prosnier and the IEES lab for their support during this project.
Funding – This work was supported by the ANR ARSENIC, grant
number ANR-14-CE02-0012.
Author contributions
Willem Bonnaffé: Conceptualization (supporting); Data curation (lead); Formal analysis (lead); Investigation (lead); Methodology (lead); Software (lead); Validation (lead); Visualization (lead); Writing – original draft (lead); Writing – review and editing (lead). Alain Danet: Methodology (supporting); Writing – review and editing (supporting).
Stéphane Legendre: Conceptualization (lead); Investigation (supporting); Methodology (supporting); Project administration (lead); Software (supporting); Supervision (lead); Writing – review and editing (supporting). Eric Edeline: Conceptualization (lead); Data curation (supporting); Funding acquisition (lead); Investigation (supporting); Methodology (supporting); Project administration (lead); Resources (lead); Supervision (lead); Writing – review and editing (supporting).
Data availability statement
Data are available from the Dryad Digital Repository: <http:// dx.doi.org/10.5061/dryad.hhmgqnkgj> (Bonnaffé et al. 2021).
References
Allan, J. D. and Castillo, M. M. 2007. Stream ecology: structure and function of running waters. – Springer.
Arim, M. et al. 2007. On the relationship between trophic position, body mass and temperature : reformulating the energy limitation hypothesis. – Oikos 116: 1524–1530.
Barbier, M. and Loreau, M. 2019. Pyramids and cascades: a synthesis of food chain functioning and stability. – Ecol. Lett. 22: 405–419.
Barner, A. K. et al. 2018. Fundamental contradictions among observational and experimental estimates of non-trophic species interactions. – Ecology 99: 557–566.
Beveridge, O. S. et al. 2010. The interacting effects of temperature and food chain length on trophic abundance and ecosystem function. – J. Anim. Ecol. 79: 693–700.
Binzer, A. et al. 2012. The dynamics of food chains under climate change and nutrient enrichment. – Phil. Trans. R. Soc. B 367: 2935–2944.
Bonnaffé, W. et al. 2021. Data from: Comparison of size-structured and species-level trophic networks reveals antagonistic effects of temperature on vertical trophic diversity at the population and species level. – Dryad Digital Repository, <http://dx.doi. org/10.5061/dryad.hhmgqnkgj>.
Brose, U. et al. 2017. Predicting the consequences of species loss using size-structured biodiversity approaches. – Biol. Rev. 92: 684–697.
Brose, U. et al. 2019. Predator traits determine food-web architecture across ecosystems. – Nat. Ecol. Evol. 3: 919–927.
Brown, J. H. et al. 2004. Toward a metabolic theory of ecology. – Ecology 85: 1771–1789.
Caissie, D. 2006. The thermal regime of rivers: a review. – Freshwater Biol. 51: 1389–1406.
Claessen, D. et al. 2000. Dwarfs and giants: cannibalism and competition in size‐structured populations. – Am. Nat. 155: 219–237.
Claessen, D. et al. 2002. The impact of size-dependent predation on population dynamics and individual life history. – Ecology 83: 1660–1675.
Daufresne, M. et al. 2009. Global warming benefits the small in aquatic ecosystems. – Proc. Natl Acad. Sci. USA 106: 12788–12793.
de Sassi, C. et al. 2012. Plant-mediated and nonadditive effects of two global change drivers on an insect herbivore community. – Ecology 93: 1892–1901.
Edeline, E. et al. 2013. Ecological emergence of thermal clines in body size. – Global Change Biol. 19: 3062–3068.
Emmrich, M. et al. 2014. Geographical patterns in the body-size structure of European lake fish assemblages along abiotic and biotic gradients. – J. Biogeogr. 41: 2221–2233.
Froese, R. and Pauly, D. 2015. Fishbase. – <www.fishbase.org>. Gauzens, B. et al. 2015. Trophic groups and modules: two levels of
group detection in food webs. – J. R. Soc. Interface 12: 20141176.
Gravel, D. et al. 2013. Inferring food web structure from preda-tor–prey body size relationships. – Methods Ecol. Evol. 4: 1083–1090.
Hart, P. J. B. and Reynolds, J. D. 2008. Handbook of fish biology and fisheries. – Wiley-Blackwell.
Hattab, T. et al. 2016. Forecasting fine-scale changes in the food-web structure of coastal marine communities under climate change. – Ecography 39: 1227–1237.
Jochum, M. et al. 2012. Climate-induced changes in bottom–up and top–down processes independently alter a marine ecosys-tem. – Phil. Trans. R. Soc. B 367: 2962–2970.
Kratina, P. et al. 2012. Warming modifies trophic cascades and eutrophication in experimental freshwater communities. – Ecology 93: 1421–1430.
Lang, B. et al. 2014. Effects of environmental warming and drought on size-structured soil food webs. – Oikos 123: 1224–1233.
Lavergne, S. et al. 2010. Biodiversity and climate change: integrating evolutionary and ecological responses of species and communities. – Annu. Rev. Ecol. Evol. Syst. 41: 321–350. Mittelbach, G. G. and Persson, L. 1998. The ontogeny of piscivory
and its ecological consequences. – Can. J. Fish. Aquat. Sci. 55: 1454–1465.
Neutel, A. M. et al. 2007. Reconciling complexity with stability in naturally assembling food webs. – Nature 449: 599–602. O’Connor, M. I. et al. 2009. Warming and resource availability
shift food web structure and metabolism. – PLoS Biol. 7(8): e1000178.
O’Gorman, E. J. et al. 2012. Impacts of warming on the structure and functioning of aquatic communities. individual- to ecosys-tem-level responses. – In: Advances in Ecological Research. Elsevier, pp. 81–176.
O’Gorman, E. J. et al. 2017. Unexpected changes in community size structure in a natural warming experiment. – Nat. Clim. Change 7: 659–663.
O’Gorman, E. J. et al. 2019. A simple model predicts how warming simplifies wild food webs. – Nat. Clim. Change 9: 611–616.
Parmesan, C. 2006. Ecological and evolutionary responses to recent climate change. – Annu. Ecol. Evol. Syst. 37: 637–669. Perkins, D. M. et al. 2010. Global change and food webs in running
waters. – Hydrobiologia 657: 181–198.
Romero, G. Q. et al. 2016. Food web structure shaped by habitat size and climate across a latitudinal gradient. – Ecology 97: 2705–2715.
Schneider, F. D. et al. 2016. Animal diversity and ecosystem functioning in dynamic food webs. – Nat. Commun. 7: 12718.
Shanafelt, D. W. and Loreau, M. 2018. Stability trophic cascades in food chains. – R. Soc. Open Sci. in press.
Shurin, J. B. et al. 2012. Warming shifts top–down and bottom–up control of pond food web structure and function. – Phil. Trans. R. Soc. B 367: 3008–3017.
Specziár, A. and Rezsu, E. T. 2009. Feeding guilds and food resource partitioning in a lake fish assemblage: an ontogenetic approach. – J. Fish Biol. 75: 247–267.
Stegen, J. C. et al. 2012. Evolving ecological networks and the emergence of biodiversity patterns across temperature gradients. – Proc. R. Soc. B 279: 1051–1060.
Strong, D. R. and Frank, K. T. 2010. Human involvement in food webs. – Annu. Rev. Environ. Resour. 35: 1–23.
Thébault, E. and Loreau, M. 2006. The relationship between bio-diversity and ecosystem functioning in food webs. – Ecol. Res. 21: 17–25.
Thurman, L. L. et al. 2019. Testing the link between species inter-actions and species co-occurrence in a trophic network. – Ecog-raphy 42: 1658–1670.
Tylianakis, J. M. and Morris, R. J. 2017. Ecological networks across environmental gradients. – Annu. Rev. Ecol. Evol. Syst 48: 25–48.
Urban, M. C. et al. 2012. A crucial step toward realism: responses to climate change from an evolving metacommunity perspec-tive. – Evol. Appl. 5: 154–167.
Vincent, F. et al. 2020. Trait-dependency of trophic interactions in zooplankton food webs. – Oikos 129: 891–902.
Voigt, W. et al. 2010. Trophic levels are differentially sensitive to climate. – Ecol. Soc. Am. 84: 2444–2453.
Wang, S. et al. 2019. Intraguild predation enhances biodiversity and functioning in complex food webs. – Ecology 100: e02616. Yvon-Durocher, G. et al. 2011. Warming alters the size spectrum
and shifts the distribution of biomass in freshwater ecosystems. – Global Change Biol. 17: 1681–1694.