Deep Integration: Considering the Heterogeneity of Free Trade Agreements
45
0
0
Texte intégral
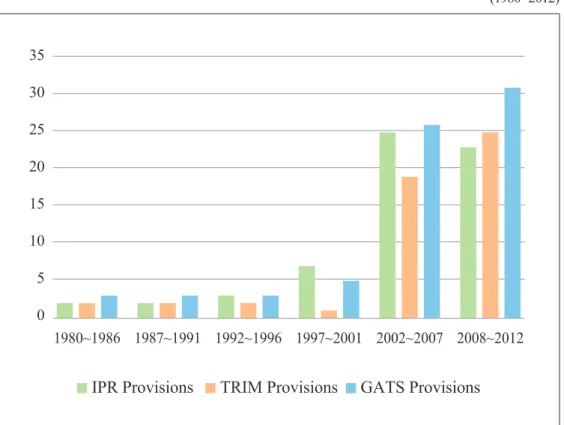
Figure


Documents relatifs
