Université du Québec INRS-EMT
Synthesis and Characterization of High-quality Near Infrared-emitting Quantum
Dots in an Organic Phase or in Water
By
Zhao Haiguang
A thesis submitted to the Department of Energy, Materials and Communications in conformity with the requirements for the degree of Doctor of Philosophy
Committee External examiner Fabio Variola
Université d’Ottawa Hua-Zhong Yu
Simon Fraser University
Internal examiner Ana Tavares
INRS-EMT, Université du Québec
Supervisor Dongling Ma
INRS-EMT, Université du Québec Co-supervisor Mohamed Chaker
INRS-EMT, Université du Québec
i
Abstract
Near infrared (NIR) emitting PbS quantum dots (QDs) have attracted much attention due to their unique size-dependent photophysical properties that are distinctly different from the corresponding bulk material. They are currently exploited for various applications, such as optoelectronics and biological sensors. To have significant impact in practical applications, they are required to show high quantum efficiency and good stability, such as photostability and colloidal stability, depending on targeted applications. It is still a big challenge to synthesize high-quality NIR-emitting QDs stable in an organic phase or in aqueous environments.
I firstly developed a simple and greener approach to synthesize high-quality PbS QDs in the organic phase. I investigated the effects of the reaction time, molar ratios of reactants, reaction temperature, capping ligands and purity of ligands and precursors on the growth of PbS QDs and how these synthetic conditions influence their structure and optical properties. Finally, the optimal synthesis conditions for high-quality PbS QDs emitting at varying NIR wavelengths were identified. Such synthesized PbS QDs show a quantum yield (QY) as high as 40% in the organic phase.
Aiming to enhance the QY of PbS QDs, the cation exchange approach was used to form PbS/CdS core/shell QDs. With this strategy, I was able to obtain a QY of 67% at optimal shell thickness of 0.7 nm. The shell composition was investigated in detail. As the experimental
ii
identification of the shell composition of thin-shell QDs is difficult, experimental data and calculations were combined to give clues. Based on the comparison of band gap versus core size plots of different compositional models, it was found that the thin shell is primarily made of CdS. Furthermore, by developing a two-step cation exchange approach, the previous synthesis barrier was overcome and I achieved PbS/CdS QDs with various shell thickness. Owing to the preparation of a relatively thick shell, not only can the core/shell structure be easily observed by transmission electron microscopy (TEM), the characteristic absorption and emission of CdS can also be observed when shell thickness reaches 1.8 nm. Furthermore, X-ray diffraction (XRD) shows the overall diffraction pattern is basically the same as that of the CdS standard when the thickness of shell reaches 3.6 nm. The thick-shell QDs were further analyzed by performing energy dispersive X-ray spectrometry (EDX) in core and shell regions, respectively. It was found that Pb is absent in the shell region. All of these results consistently suggest that, in thick-shell PbS/CdS QDs, the shell is also made of CdS, instead of ternary PbxCd1-xS alloy. In addition to
exhibiting significantly improved QY, importantly, these core/shell structured PbS/CdS QDs also show better photo- and thermal stability than the shell-free PbS QDs.
As-synthesized PbS QDs are insoluble in water. In order to disperse them into water, amphiphilic polymers of poly(maleic anhydride-alt-1-octadecene-co-poly(ethylene glycol)) (PMAOPEG) were used as phase transferring agents. I firstly transferred the PbS QDs capped by oleylamine (OLA) ligands from chloroform into water via PMAOPEG. The PbS QDs lose their photoluminescence (PL) in 5 minutes and change the size distribution from mono to double, attributed to ligand etching together with Ostwald ripening. These QDs further show self-selected size-dependent recovery of the PL with time, which was not reported before. After
iii
thorough investigations, it was found that the decrease in the percentage of unpassivated surface atoms during aging explains the PL recovery behavior of the subset of smaller QDs stored in water, which is distinctly different from that of the subset of larger QDs. Realizing a significant role of ligands in the water transfer process, I further investigated the effect of different types of surface ligands on the structure and optical property of water-soluble PbS QDs encapsulated by amphiphilic polymers. Among all the samples, PbS QDs capped with oleic acid (OA)/trioctylphosphine show the highest QY (20% in water) and those capped by OA show the least spectral shift.
Overcoating PbS with a robust inorganic shell before water transfer may further improve the properties of PbS nanocrystals in aqueous solutions and minimize their dependence on the original capping ligands. I therefore applied a two-step strategy to synthesize water soluble PbS/CdS QDs. In the first step, I overcoated PbS QDs with CdS in an organic phase as aforementioned and in the second step, I transferred them into water via amphiphilic polymers. The CdS shell around the PbS core maintains the structural integrity of PbS nanocrystals and leads to a significantly higher QY in buffer as compared to that can be achieved with “bare” (without an inorganic shell) PbS QDs. Further improvement may be made by optimizing core/shell structures. By carefully varying the initial size of PbS QDs and finely tuning cation exchange experimental conditions, I am able to synthesize PbS/CdS core/shell QDs with a similar PbS core size of 4.4 ~ 4.5 nm yet different CdS shell thickness from 0.2 to 2.3 nm via a cation exchange approach. This enables me to study the effect of the shell thickness on the optical properties of these NIR emitting PbS/CdS core/shell QDs after their transfer from an organic solvent into water via PMAOPEG. It was found that the QY of PbS core QDs (~4.5 nm
iv
in diameter) dispersed in water firstly increases with the increase of the shell thickness up to ~0.7 nm, reaching the maximum of 33%, due to better surface passivation and then decreases to 1.7% when the shell thickness reaches 2.3 nm. The decline in the QY is due to the formation of new defects with shell deposition. In contrast, as the CdS shell thickness increases, the amplitude of variation of QY, due to water transfer, decreases monotonically from 58% to 42%, because a thicker shell can endow the PbS core better protection from their environments. For the same reason, the photostability of PbS core QDs is steadily enhanced with increasing CdS shell thickness. It is clear that although the defects introduced during relatively thick shell deposition play a fundamental role in the absolute QY, they do not show any overwhelmingly negative effects on the variation of QY with environments and QD photostability. On the other hand, the colloidal stability of QDs in buffers containing different salt concentrations seems not affected by the shell thickness, quite possibly due to the same steric stabilization effect of the amphiphilic polymer in all the samples. Further investigation on a series of core/shell samples with different core size and different shell thickness confirms that ~ 0.7 nm is an optimal shell thickness for the various core sizes investigated herein, consistently yielding the maximum QY and reasonably good photostability.
v
Acknowledgements
I would like to thank Prof. Dongling Ma and Prof. Mohamed Chaker for providing advice and direction throughout my research. They have created an exciting environment of discovery and learning that has allowed me explore a complex and fascinating field of research. Thanks to them for their kindness and support during my PhD path. I learned lots from them.
I want to acknowledge the contributions to this work made by Dr. Teng Zhang and Dr. Defa Wang, who collaborated closely with me on many aspects of this research. Thanks to all the group members for their help throughout the work. I am grateful to have been part of such a supportive, hardworking, and inspiring group of graduate students and post doctoral fellows. Over the course of my research I have been fortunate enough to work with a truly outstanding group. These people include: Ibrahima Ka, Dr. Teng Zhang, Jianming Zhang, Dr. Guozhu Chen, Hongyan Liang, Dr. Defa Wang, Dr. Stephano Desian and Belete Atomsa Gonfa.
I have to pay special thanks to Dr. Hui Meng, Dr. Shuhui Sun, Dr. Gaixia Zhang, Dr. Guiping Dai, Dr. Fangxin Li, and Dr. Juan Tian. They always cheered me up.
I thank to the departmental and technical staff at INRS-EMT. They are very helpful, particularly Pierre-Paul Mercier, Georges Lamoureux, Louise Hudon and Christophe Chabanier.
vi
the training of fluorescence spectrometer. Thanks to Dr. Daria Riabinina for analyzing the data of XPS and also discussion of work. Thanks to Ibrahima Ka for the correction of the resume. Thanks to Prof. Nianqiang Wu for the discussion of work.
I thank my family and my friends for their continuing love and support. I am eternally grateful to my wife, Hongmin, who has been a constant source of love, encouragement, and sound advice.
Finally, I wish to acknowledge the following organizations for their financial support: the Natural Sciences and Engineering Research Council of Canada and Fonds de la recherche sur la nature et les technologies.
vii
Contents
Chapter 1 Introduction...1
1.1 What quantum dots are and their properties...1
1.2 Why are NIR emitting quantum dots attractive?...4
1.3 PbS synthesis...6
1.4 Synthesis of core/shell quantum dots...8
1.5 Thesis objectives and contributions of this work...10
1.6 Thesis organization...11
Chapter 2 Experimental...14
2.1 Materials...14
2.2 Reaction setup...15
2.3 Synthesis...15
2.3.1 Synthesis of PbS and PbS/CdS quantum dots in the organic phase...15
2.3.1.1 Synthesis of PbS quantum dots...15
2.3.1.2 Synthesis of PbS/CdS quantum dots...18
2.3.2 Synthesis of PbS and PbS/CdS quantum dots in water...20
2.3.2.1 Synthesis of amphiphilic polymer...20
2.3.2.2 Transfer of PbS and PbS/CdS quantum dots into water...21
2.4 Characterization...22
2.4.1 Structure characterization...22
2.4.2 Property characterization…………...23
Chapter 3 Synthesis and characterization of PbS quantum dots...26
3.1 Quantum dots synthesis...26
viii
3.2.1 Effect of reaction time...29
3.2.2 Effect of the molar ratio of precursors...32
3.2.3 Effect of reaction temperature...34
3.3 Effect of capping ligands...37
3.4 Purity effect of ligands and precursors...39
3.4.1 Ligands purity effect...40
3.4.2 Precursor purity effect...44
3.5 Summary...46
Chapter 4 Synthesis and characterization of PbS/CdS quantum dots...47
4.1 Core/shell structure...48
4.2 Synthesis and characterization of PbS/CdS quantum dots...49
4.2.1 Structure of thin-shell PbS/CdS quantum dots...49
4.2.2 Structure of thick-shell PbS/CdS quantum dots…...57
4.3 Optical property of PbS/CdS quantum dots...63
4.3.1 Quantum yield...63
4.3.2 Photostability …...64
4.3.3 Thermal-stability...65
4.4 Summary...66
Chapter 5 Synthesis and characterization of water-soluble PbS quantum dots...67
5.1 Synthesis approach of water-soluble quantum dots...68
5.1.1 Synthesis of water-soluble PbS quantum dots in an aqueous system...68
5.1.2 Water transfer approach...68
5.2 Synthesis of amphiphilic-polymer encapsulated PbS quantum dots...69
5.3 Self PL recovery of water-soluble PbS quantum dots...70
5.3.1 Structure variation………...70
5.3.2 Fast PL decay...73
5.3.3 PL recovery...76
5.4 Ligands effect...83
ix
5.4.2 Ligand-dependent optical properties...87
5.4.3 XPS characterization of PbS quantum dots...90
5.4.4 Photostability of PbS quantum dots...91
5.5 Summary...94
Chapter 6 Synthesis and characterization of water-soluble PbS/CdS quantum dots……...96
6.1 Synthesis of water-soluble PbS/CdS quantum dots...97
6.2 CdS shell thickness effect...102
6.2.1 PbS/CdS core/shell quantum dots in an organic phase.………..…...102
6.2.2 PbS/CdS core/shell quantum dots transferred into water...107
6.2.2.1 Variation of optical properties with water transfer...108
6.2.2.2 Colloidal stability...112
6.2.2.3 Photostability...114
6.2.2.4 Identifying optimal shell thickness...115
6.3 Summary...116
Chapter 7 Conclusions and perspectives...118
7.1 Conclusions...118
7.2 Perspectives...122
Bibliography...125
Appendix…...141
A List of acronyms...141
B List of chemical formula...142
x
List of Figures
Figure 1.1 Electronic energy states of a semiconductor in the transition from nanosized crystals
to bulk crystals. Blue shading denotes ground state electron occupation. Figures 1.1 is from [18].………...………..2
Figure 1.2 (a) Size tunable photoluminescence (PL) spectra of CdSe QDs. (b) Emission maxima
and sizes of QDs of different composition [4, 6, 7, 8, 9, 10, 11]. Inset: representative emission spectra for some materials. (c) Absorption (upper curves) and emission (lower curves) spectra of four CdSe/ZnS QDs samples. The blue vertical line indicates the 488-nm line of an argon-ion laser, which can be used to efficiently excite all QDs simultaneously [3, 5]. Figure 1.2a is our unpublished data. Figures 1.2b and c are from [3]………. 3
Figure 1.3 NIR luminescence imaging of BALB/c mouse treated with lysine cross-linked
mercaptoundecanoic acid core/shell CdSe0.25Te0.75/CdS QDs as NIR optical probes [26]. The background autofluorescence (from the mouse) is colored green and NIR QD signal is pseudocolored red.………....…...……5
Figure 1.4 Ligand exchange and amphiphilic polymer encapsulation approaches for transferring
QDs from an organic phase into water.……...………..………..…8
Figure 1.5 A guide relating the chapters of this thesis to the synthesis of high-quality PbS and
PbS/CdS QDs in an organic phase and in water in this work.………..13
Figure 2.1 Schematic illustration of the air-free reaction setup for synthesizing PbS QDs..…...15 Figure 2.2 Synthesis of thin-shell PbS/CdS QDs by cation exchange………...….….18 Figure 2.3 A flow chart displaying the process for achieving water-soluble QDs.………..21 Figure 3.1 The XRD pattern of PbS QDs. Inset: a high resolution TEM image of a PbS
QD………...28
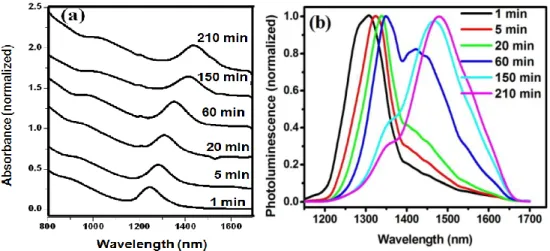
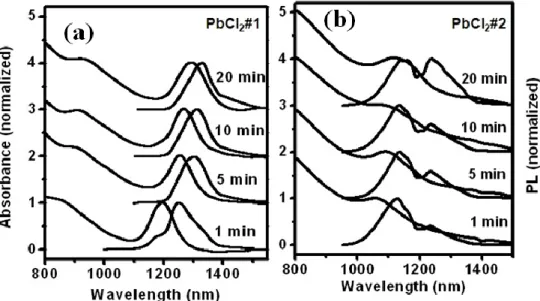
Figure 3.2 Absorption (a) and PL (b) spectra of PbS QDs prepared at 90 C with the PbCl2/S
xi
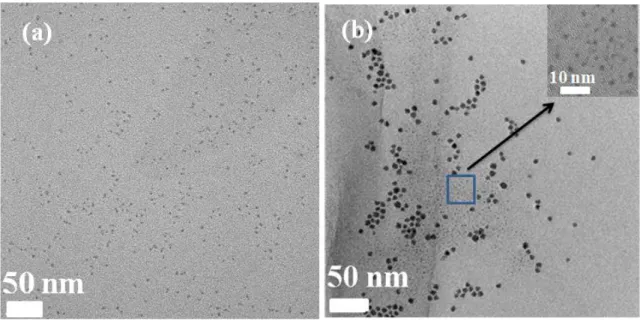
Figure 3.3 TEM images of PbS QDs synthesized at 90 C with the PbCl2/S ratio of 3:1. The
growth time is 1 minute (a) and 150 minutes (b). Inset: a TEM image of small-sized QDs in (b)…...31
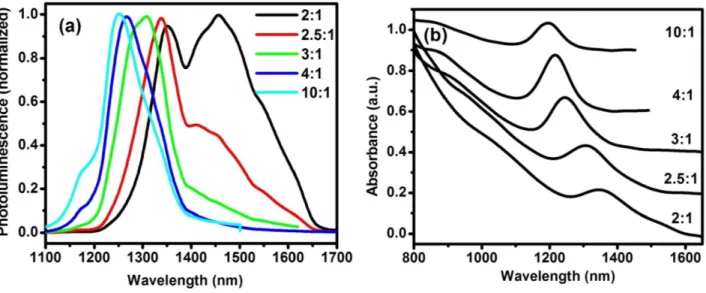
Figure 3.4 PL (a) and absorption (b) of QDs after 1-minute growth at 90 C with the Pb/S ratio
ranging from 2:1 to 10:1………...……….33
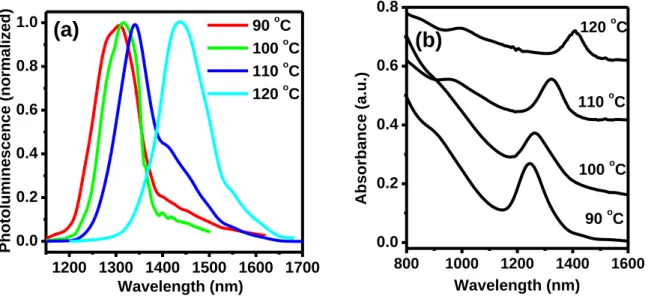
Figure 3.5 PL (a) and absorption (b) spectra of PbS QDs after 1-minute growth at different
temperatures. The PbCl2/S ratio is 3:1………...36
Figure 3.6 Absorption spectra of PbS QDs prepared at 120 C with the PbCl2/S ratio of
3:1………..37
Figure 3.7 PL (a) and absorption (b) spectra of PbS QDs after the injection of 200 L of TOP
ligands. The reaction temperature is 90 C and the PbCl2/S ratio is 10:1….………...….39
Figure 3.8 Absorption spectra of PbS QDs synthesized with the PbCl2/S ratio of 3:1 and the
reaction time of 1 minute at different temperatures by using OLA#1 (a) and OLA#2 (b) as ligands. The ratio of the integrated absorption A at different synthesis temperatures to that at 80
C (A/A[80]) as function of temperature (c). The integrated absorption is calculated herein by
integrating the absorbance over the long-wavelength side of the first exciton absorption peak. Absorption HWHM obtained at different synthesis temperatures as function of temperature (d). The solid line is drawn to guide the eye. PbCl2#1 was used as a precursor in both
cases……….………...………...……42
Figure 3.9 PL (a) and lifetime (b) of PbS QDs in toluene. The PbS QDs were synthesized at 90 o
C with the PbCl2/S ratio of 3:1 for 1 minute. Inset: integrated PL intensity versus absorbance at
670 nm for the QDs prepared using either OLA#1 or OLA#2 as a ligand. The linear fit of the data is also shown. PbCl2#1 was used as a precursor in both cases………..43
Figure 3.10 Absorption and PL of PbS QDs prepared at 90 C with the PbCl2/S ratio of 10:1 by
using PbCl2#1 (a) or PbCl2#2 (b) as a precursor………...……44 Figure 3.11 Absorption (a) and PL (b) of PbS QDs prepared at different conditions. From left to
right, emission curves correspond to absorption curves. OLA#2 was used as ligands. PbCl2#1
was used as a precursor……….………...….45
Figure 3.12 TEM images of PbS QDs synthesized at 90C with the PbCl2/S ratio of 3:1 and the
reaction time of (a) 1 minute and (b) 2 hours using OLA#2 and PbCl2#2. Scale bar is 50
nm………..……....45
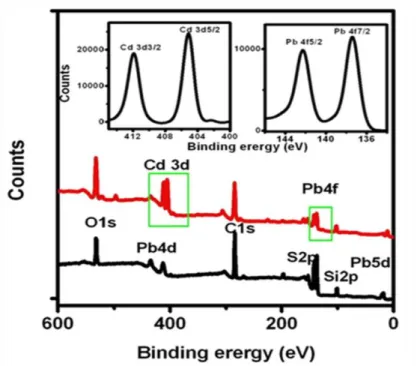
Figure 4.1 PL spectra (a) and typical TEM image (b) of PbS/CdS QDs.………...49 Figure 4.2 (a) XPS spectra PbS and PbS/CdS QDs with different shell thickness. Insets of (a):
xii
Figure 4.3 EDX spectra of PbS and PbS/CdS QDs, indicating the presence of Pb, S and
Cd………...51
Figure 4.4 Size distribution of PbS QDs in chloroform (5.2 0.2 nm) and PbS/CdS QDs after
cation exchange in chloroform (5.0 0.3 nm)………..51
Figure 4.5 Absorption spectra of PbS during cation exchange process…...52 Figure 4.6 HRTEM image of an individual PbS/CdS QD. Scale bar is 5 nm……….….53
Figure 4.7 TEM image of PbS/CdS QDs. The size of parent PbS QDs is ~12 nm….………….53
Figure 4.8 Schematic presentation of pure-CdS-shell (a) and alloy-shell structures (b) of
PbS/CdS QDs. (c) Bandgap of PbS and PbS/CdS QDs as a function of PbS diameter. The black solid curve represents the data from ref 24. The blue, cyan and pink solid lines are guides to the eye.………54
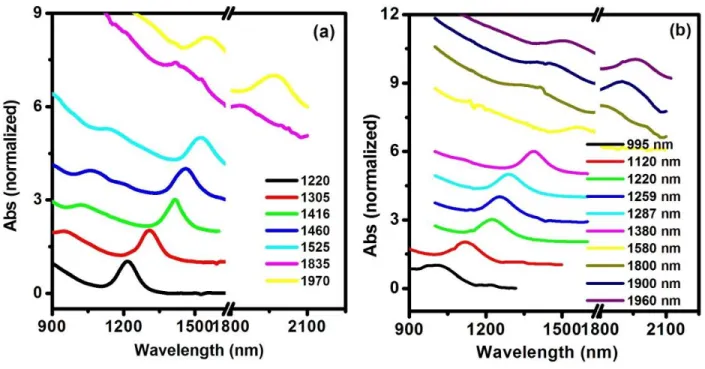
Figure 4.9 Tunable absorption spectra of (a) PbS and (b) PbS/CdS QDs……….……...55 Figure 4.10 TEM images of PbS QDs with the first exciton peak at 1460 nm (a) and 1900 nm
(b), respectively………..……….….…….56
Figure 4.11 TEM images of PbS/CdS QDs with the first exciton peak at 1250 nm (a) and 1800
nm (b), respectively………..……….………56
Figure 4.12 TEM images of PbS/CdS QDs (a) synthesized by cation exchange at 200 C for 5
minutes and (b) synthesized via a two-step cation exchange (100 C for 1 hour, following at 200
C for 20 hours). The size of parent PbS is ~5.2 nm……….………...….58
Figure 4.13 Schematic presentation of two step cation exchange to synthesize thick-shell
PbS/CdS QDs………..….…….58
Figure 4.14 Representative TEM images of parent PbS (~ 10 nm in diameter) (a) and (b)
PbS/CdS QDs synthesized at 100 C for 1 hour (b), 4 hours (c) and PbS/CdS QDs following growth at 200 C for another 20 hours (d). Inset of (c) and (d) are HRTEM images of (c) and (d), respectively, indicating clearly the core shell structure. Scale bar for inset images of (c) and (d) is 5 nm……….….…….59
Figure 4.15 (a) HRTEM image of a thick-shell PbS/CdS QD clearly displaying the core and
shell. (b) Absorption spectra of PbS and thick-shell PbS/CdS QDs in toluene. Inset of (b) is the PL spectra of PbS/CdS QDs manifesting characteristic emission from CdS and PbS…….…….60
Figure 4.16 PL spectra of PbS (initial) and PbS/CdS QDs with tunable CdS shell thickness.
xiii
Figure 4.17 PL decay curve for thick-shell PbS/CdS QDs, measured at emission peak of ~ 510
nm in toluene, and shown on a logarithmic scale.………..………...61
Figure 4.18 XRD patterns of PbS and PbS/CdS QDs with different shell thickness. The JCPDS
card files for PbS (05-0592, cyan line) and for CdS (01 089 0440, magenta line) are shown below the spectra for identification.………..62
Figure 4.19 (a) TEM image of a PbS/CdS QD. (b) EDX spectra from the core (yellow circle)
and shell (red circle) of the PbS/CdS QD……….…….63
Figure 4.20 PL lifetime of parent PbS measured at ~ 1460 nm and PbS/CdS QDs measured at ~
1320 nm in toluene……….………...64
Figure 4.21 (a) The variation in the PL intensity of PbS and PbS/CdS QDs in ODE after four
hours of continuous illumination. (b) The PL spectra of PbS and PbS/CdS QDs before and after heat treatment (PbS: 100 C for 5 minutes in ODE; PbS/CdS: 150 C for 30 minutes in ODE)…….. ….……….…65
Figure 5.1 FTIR characterizations of (a) PEGOH, (b) PMAO and (c) PMAOPEG………..70
Figure 5.2 TEM images of as prepared PbS QDs in chloroform (a), and PbS/PMAOPEG QDs
in chloroform (b), immediately after transfer into water (c) and ethanol (d). Scale bar is 20 nm………...72
Figure 5.3 Schematic representation of the process leading to the double size distribution of PbS
QDs after transfer into water………..………...…74
Figure 5.4 (a) PL of PbS QDs in chloroform prior to polymer encapsulation, after PMAOPEG
encapsulation in chloroform, following transfer into water and after being stored in water at 4 C for 1 minute and 5 minutes. (b) PL of PbS/PMAOPEG QDs in chloroform and following transfer into ethanol……….….75
Figure 5.5 (a) PL of PbS QDs being stored at 4 C for 3 months in water and following transfer
back into chloroform. Two resolved PL peaks from the Gauss fitting for the PL curve of PbS QDs in chloroform are also shown. (b) PL of PbS solid films dried from PbS/PMAOPEG QDs dispersed in chloroform or stored in water for 3 months….……….…78
Figure 5.6 (a) Representative TEM photographs of PbS QDs stored at 4 C for 3 months in
water. (b) XRD of PbS QDs prior to water transfer and after being stored in water for 3 months. Inset of (a): enlarged TEM images of the larger and smaller QDs………....81
Figure 5.7 High resolution Pb 4f XPS spectra of smaller (a) and larger (b) PbS/PMAOPEG
QDs following transfer into water and after being stored in water at 4 C for 3 months. The dots represent experimental data. The red and blue lines are fitting curves and the gray line is the sum of them. The light blue line is a background curve………..…….…82
xiv
Figure 5.8 XRD (a) and XPS (b) spectra of PbS-OLA, PbS-OA and PbS-OA/TOP QDs. Data of
the JCPDS card (05-0592) for PbS are also included for identification…..………..84
Figure 5.9 TEM images of (a,d) PbS-OLA, (b,e) PbS-OA and (c,f) PbS-OA/TOP QDs in
chloroform (a, b, c) and after polymer encapsulation and transfer into water (d, e, f) via PMAOPEG. Scale bar is 20 nm………...………....86
Figure 5.10 Hydrodynamic diameter of PbS-OLA QDs in chloroform (a), PMAOPEG
encapsulated PbS-OLA QDs before transfer in chloroform (b) and after transfer into water (c), measured by dynamic light scattering……….…..86
Figure 5.11 Absorption and PL spectra of PMAOPEG encapsulated PbS QDs capped by
different ligands (OLA, OA and OA/TOP) in chloroform prior to water transfer and PL spectra of QDs following transfer into water………..…..………...…….88
Figure 5.12 High resolution XPS spectra of Pb 4f in PbS capped by OLA (a), OA (b) and
OA/TOP (c) ligands before and after transfer into water via PMAOPEG. The dots represent experimental data. The thin lines are fitting curves and the thick line is the sum of them. The dash line is a background curve. SPb represents surface Pb atoms bonded with OA ligands and
VPb the Pb atoms in the interior of QDs………..…..91
Figure 5.13 PL spectra of freshly prepared PMAOPEG encapsulated PbS-OA QDs in water (a)
and integrated PL intensity of freshly prepared PMAOPEG encapsulated PbS QDs capped by different types of capping ligands (b) subject to UV illumination for different time. The quickly drop in PL intensity of PbS-OLA in water occurs within 1 minute……….….……92
Figure 6.1 Dynamic light scattering measurement of the hydrodynamic radius of PbS/CdS QDs
in water (average hydrodynamic size is ~22 nm)………...…….…..98
Figure 6.2 Representative TEM images of (a) PbS/CdS QDs before transfer, and (b) PbS/CdS
QDs following transfer into water. Inset of (a) is a high resolution TEM image of an individual QD and scale bar is 5 nm………..………...98
Figure 6.3 Size distribution of PbS/CdS QDs in chloroform (5.0 0.3 nm) and in water (5.0
0.3 nm)………..…...99
Figure 6.4 PL (a) and absorption (b) spectra of PbS, and PbS covered by a CdS shell before
and after transfer into water using PMAOPEG. Absorption curves correspond to emission curves of the same color………...………....99
Figure 6.5 High resolution XPS spectra of Pb 4f of PbS/CdS QDs before and after transfer
into water via PMAOPEG………..…...……101
Figure 6.6 High resolution XPS spectra of Cd 3d in PbS/CdS before and after transfer into
xv
process………..101
Figure 6.7 Absorption (a) and PL (b) spectra of initial PbS QDs (dot) and PbS/CdS QDs (line)
dispersed in chloroform.………..105
Figure 6.8 (a) Typical TEM image of PbS/CdS QDs synthesized at 100 C for 4 hours with
initial PbS size of 5.2 nm. (b) High resolution TEM image of (a)………..…107
Figure 6.9 TEM images of PbS/CdS#1 (a, d), PbS/CdS#2 (b,e) and PbS/CdS#3 (c,f) before
polymer encapsulation in chloroform (a, b, c) and after transfer into water (d, e, f) via
PMAOPEG. Scale bar is 20 nm………....108
Figure 6.10 PL and absorption spectra of PbS/CdS QDs after transfer into water via
PMAOPEG. ………..…....109
Figure 6.11 The QY of PbS/CdS QDs before and after water transfer as a function of CdS shell
thickness. The solid lines are guides to the eye.………..…....110
Figure 6.12 Absorption peak shifts and QY variation of PbS/CdS QDs before and after transfer
into water as a function of CdS shell thickness. The solid lines are guides to the eye………...111
Figure 6.13 (a) PL spectra of PbS/CdS QDs in PBS buffers containing different NaCl
concentrations and (b) PL intensity of PbS/CdS QDs in PBS buffer as a function of NaCl concentration.………..………...…113
Figure 6.14 TEM image of PbS/CdS#3. PbS/CdS QDs were dispersed in PBS buffer containing
300 mM NaCl………..………...113
Figure 6.15 (a) PL spectra of PbS/CdS QDs in PBS buffer under continuous illumination and (b)
PL intensity of PbS/CdS QDs in PBS buffer as a function of illumination time. Inset of (b) is the PL variation of PbS/CdS QDs after 2-hour of illumination as a function of CdS shell thickness.………...………..…....115
Figure 6.16 (a) PL spectra of water-soluble PbS/CdS QDs with varying core size and constant
CdS shell thickness of 0.7 nm. (b) Typical TEM image of water-soluble, 0.7-nm-thick-shell PbS/CdS QDs.…...………...………..…....…116
xvi
List of Tables
Table 4.1 Experimental parameters for synthesizing PbS/CdS QDs presented in Figure 4.1a…51
Table 5.1 PL maxima (em), FWHM, lifetime () and intensity variation (reflected by: PL
intensity ratio = PL intensity after transfer into water/PL intensity before transfer) of PMAOPEG encapsulated PbS QDs capped by different ligands before and after transfer into water. The fluorescence lifetime of PbS-OLA QDs in water cannot be measured due to the fast decay of PL…...88
Table 6.1 Initial PbS size based on TEM observations, PbS size estimated from absorptipon
peak positions [86],Absorption maxima (abs), and PL maxima (em) of PbS QDs in chloroform.
PL peak positions of PbS/CdS#6-7 cannot be measured due to the limitation of our NIR detector………....104
Table 6.2 The overall size of PbS/CdS QDs based on TEM observations, estimated core size and
shell thickness from methods #1 and #2, absorption maxima (abs), PL maxima (em), PL FWHM
and QY for PbS/CdS QDs in chloroform. Method#1: core size estimated from absorption peak positions and shell thickness calculated by: overall size – core size; Method#2: core size and shell thickness estimated from Cd/Pb ratios determined by ICP-OES measurements and overall sizes by TEM [70].………...………..….104
1
Chapter 1
Introduction
1.1 What quantum dots (QDs) are and their properties
Semiconductor QDs are fluorescent nanocrystals normally smaller than 20 nanometers in diameter [1]. Bulk semiconductors are characterized by composition-dependent band gap, which is the minimum energy required to excite an electron from the valence band into the conduction band. With theabsorption of a photon of energy greater than band gap energy, the excitation of an electron leaves an orbital holein the valence band to form an electron-hole pair (exciton). Relaxation of the excited electron back to the valence band may be accompanied by the emission of a photon, a process known as radiative recombination (Figure 1.1). The exciton has a finite size defined by the exciton Bohr radius. When the size of a semiconductor nanocrystal is smaller than the Bohr radius, the charge carriers become spatially confined and energy levels are quantized (Figure 1.1), with values directly related to the QD size [1, 2]. In the case of quantum confinement, QDs show size-dependent band gap, as described in Equation 1.1 [2],
E = Eg + (ħ22 / 2R2) (1 /me + 1 /mh) -1.8e2 /R (1.1)
where Eg is the band gap energy of corresponding bulk material, ħ is Plank constant, me and mh are
2
radius and dielectric constant of QDs, respectively. It is to say that semiconductor nanocrystals with dimensions smaller than the exciton Bohr radius show size-dependent absorption and emission [3, 4, 5, 6, 7, 8, 9, 10, 11]. For example, as shown in Figure 1.2a, the emission wavelength of CdSe QDs (Eg, 1.76 eV) can be tuned throughout the visible range by adjusting the QD size. Together with the
composition control, the emission of QDs can span essentially the entire visible and near infrared (NIR) spectral range (Figure 1.2b).
Figure 1.1 Electronic energy states of a semiconductor in the transition from nanosized crystals to bulk
crystals. Blue shading denotes ground state electron occupation. Figures 1.1 is from [18].
It is worthwhile to make comparison between QDs and conventional fluorophores. As mentioned above, the emission of QDs can well cover the NIR range, which is difficult to achieve with conventional organic fluorophores. In addition, in marked contrast to most of conventional fluorophores, QDs have broadband absorption and narrow emission, which promises their use in multiplex detection (Figure 1.2c). Another advantage of QDs is that they are several tens of times brighter than organic dyes, which enables more sensitive detection of analytes in low concentration solutions [3]. QDs also show much higher photostability, which is advantageous for the long-term,
3
real-time monitoring and tracking of biospecies and bioactivities [3]. Last but not least, the long fluorescence lifetime of QDs, typically on the order of several tens of nanoseconds, allows us to distinguish the emission of QDs from background autofluorescence in cells which leads to a high signal-to-noise ratio, important for the use of QDs as efficient bio-labels [12, 13, 14, 15, 16, 17]. To summarize, QDs have great potential to become a new generation of biomarkers for highly demanding applications. Tailored synthesis of water soluble QDs is the key to realize their high potential.
Figure 1.2 (a) Size tunable photoluminescence (PL) spectra of CdSe QDs. (b) Emission maxima and sizes of
QDs of different composition [4, 6, 7, 8, 9, 10, 11]. Inset: representative emission spectra for some materials. (c) Absorption (upper curves) and emission (lower curves) spectra of four CdSe/ZnS QDs samples. The blue vertical line indicates the 488-nm line of an argon-ion laser, which can be used to efficiently excite all QDs simultaneously [3, 5]. Figure 1.2a is our unpublished data. Figures 1.2b and c are from [3].
4
1.2 Why are NIR emitting QDs attractive?
In vivo optical bioimaging prefers the use of fluorophores whose excitation and emission lights are least absorbed and scattered by biological fluids and tissues (water, hemoglobin, and lipids) [19, 20]. Based on this consideration, the NIR ranges of 700900 nm and 12001600 nm have been theoretically predicted and partially experimentally confirmed as two best spectral windows for bioimaging [19, 20]. Although organic NIR dyes are being employed for in vivo optical imaging [21, 22], their emission wavelengths are limited to below 950 nm [23, 24]. Not to mention most of them have the susceptibility to photobleaching [23, 24]. It is thus highly desirable to develop more flexible and robust NIR labeling agents.
Over the last ten years, research interest in NIR-emitting QDs has grown rapidly all over the world. NIR-emitting QDs show broader absorption, greater tunability in the emission wavelength, higher quantum yield (QY, defined as the ratio of the photons emitted to the photons absorbed) and better photostability compared to organic dyes. Owing to these beneficial properties, they hold great potential for live cell imaging, for tracking the movement of molecules within a single cell, for single-particle detection and for deep tissue imaging [19, 24, 25]. As an example, Figure 1.3 shows NIR-emitting lysine cross-linked mercaptoundecanoic acid core/shell CdSe0.25Te0.75/CdS QDs can
potentially be used for long-term targeted imaging in vivo [26]. However, most of QDs contain toxic elements, such as Cd, Pb, Hg and As. To alleviate the toxicity of QDs, a variety of synthesis and surface modification techniques have been proposed and realized, and some of them were shown to be able to reduce the cytotoxicity [12, 13, 14, 15, 16, 17, 26].
Various kinds of NIR-emitting QDs have been reported. These include HgSe, HgTe, InAs, InSb, PbX (X=S, Se, Te), CdHgTe and CdTe/CdSe QDs [18, 27, 28, 29, 30, 31, 32, 33, 34, 35, 36,
5
37]. Among them, lead chalcogenide QDs have large exciton Bohr radii sharing almost equally between the electron and hole. For instance, PbS QDs have the equal hole and electron radii of 9 nm [31]. This permits similarly strong confinement of both electrons and holes in relatively large sized QDs. In contrast, although InSb QDs have a large excition Bohr radius of 54 nm, the Bohr radius of its hole is only 2 nm [18]. This prevents strong confinement of the hole in InSb nanocrystals even if their diameter is only a few nm. Meanwhile, the lead chalcogenide QDs have small bulk band gaps (0.41, 0.28 and 0.31 eV at 300 K for PbS, PbSe and PbTe, respectively) [14], and can be tuned to emit over a quite large spectral range of 850 to 2200 nm with a very broad absorption spectrum and a narrow PL spectrum [31, 32]. These features make lead chalcogenide QDs especially attractive for in vivo bioimaging and among them, PbS QDs are of particular interest because they can be produced with inexpensive and relatively less hazardous precursors [31].
Figure 1.3 NIR luminescence imaging of BALB/c mouse treated with lysine cross-linked
mercaptoundecanoic acid core/shell CdSe0.25Te0.75/CdS QDs as NIR optical probes [26]. The background
6
1.3 PbS synthesis
PbS QDs have been synthesized in diverse media: glasses [38, 39, 40], polymer matrices [41, 42], aqueous solution [43, 44], organics [45], zeolites [46], liquid crystals [47], and on self-assembled monolayers using different approaches such as electrochemical[48] and sonochemical techniques [49]. Those with the high QY are almost exclusively synthesized by a high temperature organometallic route using a popular hot-injection method [31, 32]. For example, Hines and Scholes for the first time reported the organometallic synthesis of PbS QDs with size-tunable emission in NIR using oleic acid (OA) as a ligand, and lead oxide and bis(trimethylsilyl) sulfide ((TMS)2S) as
precursors [31]. Typical details of synthesis are shown in the following. First, certain amount of PbO dissolved in OA was purged with nitrogen gas flow and heated in a reaction flask to 150 C. Stock solutions of (TMS)2S and octadecene (ODE) were then added to the flask and mixed with
vigorous stirring, where the PbS nanocrystals nucleated quickly. The temperature was maintained at 100 C for the growth of nanocrystals. Aliquots of the reaction solution were removed from the flask at regular time intervals to obtain different sizes of QDs. This synthetic approach is able to produce PbS nanocrystals with an absorption edge ranging from about 800 to 2000 nm [31]. Currently, most of the synthesis of PbS QDs follows this or slightly modified recipe and involves the use of (TMS)2S, which is toxic, odorous and chemically unstable [31, 50, 51]. A greener
approach, in which (TMS)2S is replaced with S, has been explored recently by Ozin’s group [32]. In
their synthesis, high-quality PbS nanocrystals could be produced in multigram-scale quantities. However, the reaction is required to undergo in a viscous system with a very high concentration of lead precursors and a high molar ratio of Pb-to-S [32]. A greener yet simpler synthesis method is thus needed.
7
On the other hand, to be used in biological systems, QDs are required to have good water solubility, colloidal stability, photostability and biocompatibility as well as exhibit high QYs [17]. Nowadays, several methods have been employed to synthesize water-soluble NIR-emitting PbS QDs [44, 52, 53, 54, 55, 56, 57, 58, 59]. One approach is based on the direct synthesis of PbS QDs in water, which however, in general leads to a low QY with broad absorption and emission spectra [44, 52, 53, 54, 55]. Moreover, as-synthesized water-soluble PbS QDs show very poor stability due to the QD surface sensitivity to oxygen. Zhao et al. have reported that PbS QDs in water aggregated due to the oxidation of thiol capping groups [52].
Ligand exchange, based on the concept of transferring high-quality PbS QDs originally prepared in an organic phase into water via changing surface capping agents from hydrophobic to hydrophilic ones, appears to be a better approach [56, 57] (Figure 1.4).Over the past decade, this approach has been widely used as an efficient way to move nanoparticles around in different phases in addition to modifying the surfaces of various nanoparticles. However, in the case of QDs, this approach has been found to lead to a significant decrease of the QY after water transfer because of stripping of original surface ligands from QD surfaces and the sensitivity of this property to the surface chemistry of QDs [56, 57]. As for PbS QDs, the maximum QY that can be achieved by this method is 26% in a buffer solution [57].
To avoid ligand stripping and thereby keep the high QY of organometallically prepared QDs, the method of amphiphilic polymer encapsulation has recently been investigated [58, 59]. It is believed that this approach will not disturb the original capping ligands from QD surfaces (Figure 1.4). Instead, multiple hydrophobic chains of the amphiphilic polymer can have numerous interactions with the native hydrophobic ligands on the QD surface, and thus helping “fix” the ligands on the surface [58]. On the other hand, the hydrophilic end groups of the amphiphilic
8
polymer endow the QDs with good water solubility and even biocompatibility. This approach has indeed been successfully applied to ultraviolet (UV)-visible (Vis) QDs [58, 59].
Figure 1.4 Ligand exchange and amphiphilic polymer encapsulation approaches for transferring QDs from
an organic phase into water.
1.4 Synthesis of core/shell QDs
Normally, QDs capped only by organic surface ligands are very sensitive to the surface status due to their high surface-to-volume ratio. The introduction of trap states can lead to the considerable decrease of fluorescence QY. Recent studies have revealed that a core/shell structure can stabilize and maximize the fluorescence of core QDs [60, 61, 62, 63]. A robust, larger band gap inorganic shell not only passivates surface atoms, but also buries the core semiconductor in a potential energy well, and thus concentrating the charge carriers in the nanocrystal core and keeping them away from the surface and surrounding environment [61, 62, 63]. As a result, surface defect states, trap sites and environmental factors will have diminished impact on the fluorescence efficiency and stability [61, 62, 63, 64, 65]. For example, in the core/shell structured CdSe/ZnS QDs, the wider band gap
9
ZnS shell not only largely enhances the QY (from around 15% to 50%) of CdSe nanocrystals, but also improves their stability [65].
The growth of the shell has most commonly been achieved by exposing core nanocrystals to all the precursors of shell elements. A representative example is the use of diethylzinc (Zn precursor) and hexamethyldisilathiane (S precursor) for the synthesis of ZnS overcoated CdSe QDs [65]. In that case, the core size remains essentially constant during the overcoating process. Similar approach has also been explored for synthesizing NIR core/shell QDs, such as PbSe/PbS [67]. Recently, a relatively less used approach, cation exchange, has been reported for the growth of a wider band gap material onto lead chalcogenide QDs [60]. In contrast to the above-mentioned common approach, only the precursor of cationic constituent of a shell material was introduced in this approach and the shell growth proceeds through the gradual replacement of Pb cations by newly introduced cations in solution and anion sublattice remains basically un-disturbed [60]. As a result, the shell grows at the expense of core nanocrystals, i.e., the shell growth is accompanied by the decrease of the lead chalcogenide core size.
The formation of PbSe/CdSe core/shell QDs by cation exchange has been demonstrated for the first time by Pietryga et al. and it is found that the core/shell structure large enhances the QY of PbSe QDs [60] due to the effective “inorganic passivation” of the PbSe core by the CdSe shell, in a manner similar to the well-known CdSe/ZnS core/shell system [65]. Moreover, the CdSe shell exhibits relatively higher stability under ambient conditions, resulting in dramatic improvement in the stability of PbSe/CdSe QDs compared to “bare” PbSe QDs [60]. Although the visible-emitting core/shell QDs have been widely studied, relevant reports on NIR-emitting QDs, especially PbS-based core/shell QDs, are still quite limited.
10
1.5 Thesis objectives and contributions of this work
Synthesis of high-quality PbS QDs in the organic phase has been reported [31, 32]. However, in their synthesis, the toxic (TMS)2S is used as S precursor [31] or the reaction is required to undergo
in a viscous system formed by using a very high concentration of PbCl2 in oleylamine (OLA) [32].
It is highly desirable to develop a simple and greener approach with good reproducibility and easy manipulation. In addition, although overcoating QDs with large bandgap semiconducting materials is expected to enhance their QY, the QY of recently developed, CdS overcoated PbS QDs is still quite low (typically 20-30%) [60]. In addition, the cation exchange approach seems to have its limitation on the maximum shell thickness that can be achieved [60]. The core/shell structure has not been thoroughly investigated either. It is challenging while important to develop a more feasible method to synthesize PbS/CdS core/shell QDs, to carefully characterize their structure and properties, and to further optimize experimental conditions for the best possible properties.
Meanwhile, as mentioned above, the amphiphilic polymer approach is a very promising method to synthesize water-soluble QDs. Although this approach has been applied to Vis-emitting QDs [59], relevant reports on NIR-emitting PbS QDs are still lacking. It is highly desirable but also challenging to develop a feasible approach to synthesize high-quality water-soluble NIR-emitting PbS-based QDs.
To address all these issues and gain more understanding on PbS-based QDs, I plan to synthesize and characterize high-quality PbS QDs and CdS overcoated PbS QDs (i.e., PbS/CdS core/shell QDs) in an organic phase and in water. Therefore, the objectives of my projects are:
1. to find a greener yet simple approach to synthesize high-quality PbS QDs in the organic phase and to characterize their structure and properties.
11
2. to develop a new, flexible approach to synthesize PbS/CdS core/shell QDs with varying shell thickness and to perform detailed structural and property investigations.
3. to secure a new route to synthesize high-quality water-soluble NIR emitting PbS and PbS/CdS QDs via amphiphilic polymers.
1.6 Thesis organization
This thesis is divided into seven parts and organized as follows:
Chapter 1 introduces the topic of this thesis and outlines the motivation for this work.
Chapter 2 describes experimental details of synthesis process for PbS and PbS/CdS QDs in the
organic phase and in water. Characterization details of PbS and PbS/CdS QDs are also given in Chapter 2.
Chapter 3 presents and discusses a greener and simple route to synthesize colloidal PbS QDs in the
organic phase. To be more specific, the synthesis was done in a “non-viscous”, solventless OLA organic phase by using relatively low concentrations of PbCl2 and S. The publications related to this
chapter are:
[68] H. Zhao, M. Chaker, and D. Ma. Bimodal Photoluminescence during the Growth of PbS
Quantum Dots. Journal of Physical Chemistry C, 113:64976504, 2009.
[69] H. Zhao, T. Zhang, M. Chaker, and D. Ma. Ligand and Precursor Effects on the
Synthesis and Optical Properties of PbS Quantum Dots. Journal of Nanoscience and
Nanotechnology, 10:4897–4905, 2010.
Chapter 4 presents a new two-step cation exchange approach to synthesize PbS/CdS core/shell
12
chemical composition of the shell in PbS/CdS QDs. In Chapter 4 I also discuss the properties of PbS/CdS QDs including QY and photo- and thermal- stability. The publication related to this chapter is:
[70] H. Zhao, M. Chaker, N. Wu, D. Ma. Towards Controlled Synthesis and Better
Understanding of Highly Luminescent PbS/CdS Core/shell Quantum Dots. Journal of
Materials Chemistry, 21:88988904, 2011.
Chapter 5 explores the structure and optical properties of PbS QDs capped by OLA ligands after
being transferred into water via amphiphilic polymers. Furthermore, I study the mechanism for the PL disappearance and automatic, size-selected PL recovery of PbS QDs in water. Finally, I investigate the effect of different types of surface capping ligands on the final optical properties of PbS QDs after water transfer. The publications related to this chapter are:
[71] H. Zhao, M. Chaker, and D. Ma. Self-selective Recovery of Photoluminescence in
Amphiphilic Polymer Encapsulated PbS Quantum Dots. Physical Chemistry Chemical
Physics, 12:1475414761, 2010.
[72] H. Zhao, D. Wang, M. Chaker, and D. Ma. Photoluminescence Effect of Different Types
of Surface Ligands on the Structure and Optical Property of Water-soluble PbS Quantum Dots Encapsulated by Amphiphilic Polymers. Journal of Physical Chemistry C, 115:16201626, 2011.
Chapter 6 describes a novel two-step approach (synthesis of core/shell QDs followed by water
transfer via amphiphilic polymers) to prepare high-quality PbS QDs in water. In this chapter, I also investigate the effect of CdS shell thickness on the optical properties of water-soluble PbS/CdS QDs and identify optimal experimental conditions. The publications related to this chapter are:
13
[73] H. Zhao, D. Wang, T. Zhang, M. Chaker, and D. Ma. Two-step Synthesis of
High-quality Water-soluble Near-infrared Emitting Quantum Dots via Amphiphilic Polymers.
Chemical Communications, 46:53015303, 2010.
[74] H. Zhao, M. Chaker, and D. Ma. Effect of CdS Shell Thickness on the Optical Properties
of Water-soluble Amphiphilic Polymer Encapsulated PbS/CdS Quantum Dots. Journal of
Materials Chemistry, 21:1748317491, 2011.
Chapter 7 briefly summarizes important contributions of this work and states future challenges in this field.
Following the main body of thesis is an appendix providing a summary of this thesis in French as per INRS requirements.
I show in Figure 1.5 a visual guide relating the chapters of this thesis to the synthesis and characterization of high-quality PbS and PbS/CdS QDs in an organic phase and in water in this project.
Figure 1.5 A guide relating the chapters of this thesis to the synthesis of high-quality PbS and PbS/CdS QDs
14
Chapter 2
Experimental
In this chapter I introduce the synthesis and characterization details for colloidal PbS and PbS/CdS QDs related to the results to be presented and discussed in Chapter 36. Firstly, PbS QDs were synthesized in a “non-viscous”, solventless, mild-constant-temperature system with PbCl2 and S as
precursors and characterized. Then I turned to synthesize PbS/CdS QDs, via cation exchange in the organic phase, which show largely enhanced QY of PbS core QDs. Furthermore, I focused on the development of high-quality water-soluble PbS and PbS/CdS QDs by transferring high-quality QDs synthesized in an organic phase into water via amphiphilic polymers.
2.1 Materials
PbCl2 (100 wt%), sulfur (100%), OA, OLA (amine content, 97 wt%; C18-amine content, 80-90
wt%), hexane, ethanol, tetrahydrofuran (THF), chloroform and toluene were purchased from Fisher Scientific Company. PbCl2 (98 wt%), OLA (amine content, >98 wt%; C18-amine content, 70 wt%),
lead acetate trihydrate, sulfur (100%), trioctylphosphine (TOP, 90%), cadmium oxide (99%), (TMS)2S, phenyl ether, poly(maleic anhydride-alt-1-octadecene) (PMAO, number average
molecular weight, 30000-50000), cardiogreen (IR 125), rhodamine 6G, poly(ethylene glycol) methyl ethers (PEGOH, molecular weight 2000), dimethyl sulfoxide, ODE, phosphate buffered saline buffer (PBS) and concentrated H2SO4 (98%) were obtained from Sigma-Aldrich Inc. All
15
chemicals were used as purchased. All air and water-sensitive chemicals are kept in the glove box under the protection of N2.
2.2 Reaction setup
QDs are very sensitive to oxygen during the nucleation and growth processes. With the presence of oxygen (or air), the QDs will oxidize, leading to the low QY and bad photostability. Therefore, I set up the reaction in an air-free system, as schematically shown in Figure 2.1. The oxygen can be removed by vacuum pumping and nitrogen purging, and nitrogen flux can further protect the entire chemical reaction from the air. In the following, all the QDs were synthesized by using this reaction setup.
Figure 2.1 Schematic illustration of the air-free reaction setup for synthesizing PbS QDs.
2.3 Synthesis
2.3.1 Synthesis of PbS and PbS/CdS QDs in the organic phase 2.3.1.1 Synthesis of PbS QDs
16
constant-temperature reaction system using a relatively safe precursor S. The typical procedure is as follows:
1. PbCl2 (1 mmol) and 5 mL of OLA were loaded into a 50 mL three-neck flask at room
temperature. The mixture was first vacuumed and purged by N2 for 45 minutes to
remove oxygen and then heated to 90 °C to form the homogeneous PbCl2-OLA
suspension under magnetic stirring.
2. Two and half milliliters of a solution of sulfur (0.33 mmol) in OLA was purged by N2 for
30 minutes to remove oxygen and then heated to 90 °C.
3. The S-OLA mixture was quickly injected into the PbCl2-OLA suspension under vigorous
stirring and the reaction was allowed to continue at the same temperature for 1 minute to 540 minutes.
4. The reaction mixture was taken from the reaction setup and quenched by cold hexane. 5. Excess PbCl2 precursors were precipitated by centrifugation at 4 °C. Further purification
of PbS QDs can be done with ethanol to completely remove un-reacted precursors by repeated centrifugation and decantation.
In order to understand the growth mechanism for PbS QDs and also choose the optimal reaction conditions for achieving the high-quality PbS QDs, the synthesis was also carried out by varying the reaction parameters (reaction time, reaction temperature and PbCl2/S ratios) and capping
ligands. In addition, the synthesis of PbS QDs using chemicals (OLA and PbCl2) of different purity
status was also carried out following the same procedure. The synthesis process can produce the PbS QDs with excitonic absorption wavelength covering from 1180 to 1600 nm by varying the reaction conditions.
17
I also synthesized PbS QDs capped by OA or OA/TOP ligands with similar size according to literatures [31, 35] which were used for investigating the surface capping ligand effect on the optical property of PbS QDs during the water transfer process via the amphiphilic polymer approach. The synthesis of PbS QDs capped by OA ligands was conducted as follows.
1. A mixture of lead acetate trihydrate (1 mmol), OA (1.2 mL) and ODE (15 mL) was heated at 150 °C for 1 hour under N2.
2. Then the system was cooled down to 100°C under vacuum to drive off two intermediate products (water and acetic acid) and afterwards re-stabilized at 130°C.
3. Subsequently, the mixture containing (TMS)2S (0.5 mmol) and 5 mL of ODE was
quickly injected into the reaction flask. 4. The reaction was quenched by cold water.
A slightly modified method was used to synthesize PbS QDs capped by OA/TOP double-type ligands [50]. A typical synthesis procedure is shown in the following:
1. A mixture of lead acetate trihydrate (1 mmol), OA (1.2 mL), TOP (1 mL) and ODE (15 mL) was heated at 150 °C for 1 hour under N2.
2. Then the temperature was lowered to 100 °C under vacuum to drive off two intermediate products (water and acetic acid) and afterwards re-stabilized at 150 °C.
3. Subsequently, the reaction mixture containing (TMS)2S (0.5 mmol), 0.2 mL of TOP and
4.8 mL of ODE was quickly injected into the reaction flask.
18 5. The reaction was quenched by cold water.
The PbS QDs capped by OA or OA/TOP were precipitated by adding alcohol and then re-dispersed in hexane. Un-reacted precursors were completely removed by repeated centrifugation and re-dispersion at least three times. The purified PbS QDs were dispersed in toluene or chloroform for characterizations or subsequent preparations.
2.3.1.2 Synthesis of PbS/CdS QDs
Recent studies have revealed that the core/shell structure can stabilize and maximize the fluorescence of core QDs. And cation exchange approach is an efficient way to produce the core/shell structure of QDs. Herein, the thin-shell PbS/CdS QDs were achieved by cation exchange method [60], as shown in Figure 2.2.
Figure 2.2 Synthesis of thin-shell PbS/CdS QDs by cation exchange.
The cation exchange procedure was carried out under N2 atmosphere. All solvents used in
the procedure are anhydrous and oxygen free. The procedure is as follows:
19
2. PbS QDs dispersed in toluene (10 mL, with an absorbance of 0.3 at the first exciton peak) were purged by N2 for 30 minutes to remove oxygen and then quickly heated to
100 °C.
3. CdO (2.3 mmol), OA (2 mL) and phenyl ether (10 mL) were heated to 255 C under N2
for 20 minutes.
4. The clear solution was cooled to 155 C under vacuum for 15 minutes. The flask was then reopened and the N2 flux was restored.
5. The Cd/OA mixture was injected into PbS QDs suspension in toluene.
6. The reaction cell was quenched with cold water after the growth reaction was conducted at 90 or 100 C for different time.
7. Alcohol was added (QD solution: alcohol = 1:1 in volume), and then the suspension was centrifuged and supernatant was removed. QDs were re-dispersed in hexane. This process was repeated for at least two times. The final QDs were re-dispersed in toluene or chloroform.
The general synthesis process can produce the PbS/CdS QDs with excitonic absorption wavelength spanning from 800 to 1960 nm by choosing different, initial PbS sizes and varying the reaction time and molar ratio of PbS QD to Cd-oleate. The CdS shell thickness that can be achieved with the above procedure is around 0.1 to 1.5 nm. In order to achieve the PbS/CdS QDs with a thicker shell, I developed a two-step approach. The procedure is as follows:
20
1. CdO (11 mmol), OA (10 mL) and phenyl ether (15 mL) were heated to 255 C under N2
for 2 hours.
2. The Cd precursor solution (155 °C) was injected to PbS QDs suspension in toluene at 100 °C (10 mL, with an absorbance of 0.3 at the first exciton peak).
3. Growth reaction was conducted at 100 °C for 240 minutes.
4. The reaction temperature was increased to 200 °C ~ 240 °C and the reaction was allowed to proceed for 0.5 to 48 hours.
5. Alcohol was added and then the suspension was centrifuged and supernatant was removed. QDs were dispersed in hexane. This process was repeated for two times. The final QDs were dispersed in toluene or chloroform.
PbS/CdS QDs with similar core size and tunable shell thickness were synthesized by choosing the tunable PbS dimension and varying the reaction time and temperature.
2.3.2 Synthesis of PbS and PbS/CdS QDs in water
2.3.2.1 Synthesis of amphiphilic polymer
Amphiphilic polymers were synthesized according to a published method [59], as described below: 1. One gram of PMAO and 1.5 g of PEGOH were mixed with 50 L of concentrated
H2SO4.
2. The mixture was refluxed in chloroform (10 mL) for 12 hours.
3. As synthesized amphiphilic polymers of poly(maleic anhydride-alt-1-octadecene-co-poly(ethylene glycol) (PMAOPEG) were neutralized by 1 M NaOH and then centrifuged to remove Na2SO4 and water.
21
2.3.2.2 Transfer of PbS and PbS/CdS QDs into water
The PbS and PbS/CdS QDs were further transferred from an organic phase into water via amphiphilic polymers. As shown in Figure 2.3, the PbS or PbS/CdS QDs were firstly dispersed in chloroform and then mixed with PMAOPEG. After stirring for 6 hours under dark, chloroform was then gradually removed by evaporation after adding air-free water. The water transfer procedure is as follows:
Figure 2.3 A flow chart displaying the process for achieving water-soluble QDs.
1. The amphiphilic polymer PMAOPEG was dispersed into the chloroform and sonicated for 10 minutes.
2. QDs in toluene were precipitated by adding alcohol and then re-dispersed in hexane. The additional ligands were completely removed by repeated centrifugation and re-dispersion at least three times. Finally the QDs were dispersed in chloroform.
3. Monodispersed QDs (1 mL, with an absorbance of 1 at the first exciton peak) were mixed with PMAOPEG (1.6 mL, 30 mM) in chloroform and stirred for 6 hours. 4. Nitrogen bubbled water (2.6 mL) was added to the mixture. Chloroform was then
22
5. The water-soluble QDs were purified by centrifugation at 8000 revolutions per minute for 30 minutes. The purified QDs were then dispersed in water or buffer and kept under dark for future characterizations.
By following the transfer process mentioned above, the PbS QD capped by different types of capping ligands (OLA, OA or OA/TOP) and the PbS/CdS QDs with varying core size and shell thickness were transferred into water via amphiphilic polymers.
All reactions were repeated at least five times and all of them showed good reproducibility.
2.4 Characterization
2.4.1 Structure characterization
Samples for transmission electron microscopy (TEM) measurements were deposited onto copper TEM grids coated with thin (5-50 nm thickness) carbon films. One drop of PbS or PbS/CdS QDs dispersed in chloroform or water was placed on the grid. The grid was allowed to dry in air.The grid was examined by TEM. Low- and high-resolution TEM images were obtained using a JEOL 2100F microscope.
The X-ray diffraction (XRD) study of PbS or PbS/CdS QDs after extensive purification was carried out with a Philips X’pert diffractometer using Cu Kα radiation source (λ = 0.15418 nm).
Nanocrystals were placed on glass for measurements.Diffraction patterns were collected in the 2 range 2080, by using the step of 0.1 and counting time of 10 seconds.
X-ray photoelectron spectrometry (XPS) was performed on a VG Escalab 220i-XL equipped with an Al K source.Thin cast films of QDs were placed on silicon substrate for measurements.
23
The Pb/Cd ratio was measured by using inductively coupled plasma optical emission spectrometry (ICP-OES, Perkin Elmer Model Optima 7300 DV). These experiments were performed at the University of Toronto. A known mass of QDs was digested with a HNO3/HCl
(volume ratio: 1:3) mixture on a hotplate. The obtained clear solution was diluted with Millipore water for further measurements.
Dynamic light scattering technique (Malvern, Zetasizer Nano S90) was used to determine the hydrodynamic radius of QDs. All samples were purified by using 200-nm filters for at least three times.
Amphiphilic polymers were characterized by Fourier Transform Infrared (FTIR) spectroscopy (Nicolet 6700 spectrometer, Thermo Scientific) in the transmission mode by using un-doped and double-side polished silicon as substrates.
The size of QDs was measured by TEM with good precision. About 200 QDs were analyzed for each sample; the size distribution was analyzed with a Gaussian distribution.
The band gap energy was calculated from the absorption peak following the equation:
E = hc/ (2.1) where E is band gap energy , h is Planck constant and is the first excition absorption peak position.
2.4.2 Property characterization
Absorption spectra were acquired with a Cary 5000 UV-visible-NIR spectrophotometer (Varian) with a scan speed of 600 nm/minute. Samples were dispersed in toluene, chloroform, or water for measurements.
24
Fluorescence spectra were taken with a Fluorolog®-3 system (Horiba Jobin Yvon) using an excitation wavelength of 674 nm. For the PbS/CdS QDs, the excitation wavelength of the CdS shell was set at 345 nm. The concentration of samples was adjusted so as to their optical densities were below 0.2 at the chosen excitation wavelength.
QY measurements of PbS QDs were performed at HORIBA Jobin Yvon, NJ, USA. The dye IR 125 dissolved in dimethyl sulfoxide was used as a reference. The QY of the CdS shell was measured by using rhodamine 6G dissolved in water as a reference. The general process is shown in the following:
1. Record the UV-visible-NIR absorption spectrum of the QD solution.
2. Record the fluorescence spectrum of the same solution in a 10 mm fluorescence cuvette. 3. Repeat steps 1 and 2 for five solutions with decreasing concentrations of QDs.
4. Plot a graph of integrated fluorescence intensity versus absorbance. 5. Repeat steps 1 to 4 for the standard reference.
All the fluorescence spectra were recorded with a constant slit width. The gradients of the graphs obtained in the step 4 are proportional to the QY of samples. The absolute QY value can be obtained using a standard sample which has a known fluorescence QY value as a reference, according to the following equation:
x / st = (Gradx / Gradst) * (x2/ st2) (2.2)
where the subscripts ST and X denote standard and unknown respectively, is the fluorescence QY,
25
the refractive index of the solvents used for the measurements. The QY of IR 125 in dimethyl sulfoxide is 13% [75]. The excitation wavelength for IR 125 is set at 765 nm and for PbS QDs 670 nm. The excitation wavelength for rhodamine 6G is set at 526 nm and for CdS shell of PbS/CdS core/shell QDs 345 nm.
Fluorescence lifetimes of PbS QDs and PbS cores in PbS/CdS nanocrystals in different solvents (toluene, chloroform or water) were measured using a pulsed laser diode of 636 nm and the fast multichannel scaler mode in the Fluorolog®-3 system. The decay signals were found to be best fitted to a single-exponential function, shown in the following:
I(t) = I0 exp(-t/) (2.3) where is lifetime, I is PL, t is time and I0 is the initial PL at t = 0.
The fluorescence lifetime of the CdS shell was measured in time-correlated single-photon counting (TCSPC) mode with a 374 nm laser. The decay signals were found to be best fitted to a two-exponential function, according to the following equation:
I(t) = I0 exp(-t/1)+ I0 exp(-t/2) (2.4)
where 1 and 2 is lifetime of the first and second process, respectively. I is PL, t is time and I0 is the
initial PL at t = 0.
The photostability of PbS and PbS/CdS QDs dispersed in different solvents were tested using a 4 W UV lamp (115 V, 60 HZ, Model 22-UV, Optical Engineering, UV light Inc.).
The thermal stability of PbS and PbS/CdS QDs were tested by dispersing QDs in air-free ODE held at certain temperature and monitoring the variation in their PL spectra with time.