HAL Id: hal-01982191
https://hal.archives-ouvertes.fr/hal-01982191
Submitted on 23 Jan 2019
HAL is a multi-disciplinary open access
archive for the deposit and dissemination of
sci-entific research documents, whether they are
pub-lished or not. The documents may come from
teaching and research institutions in France or
abroad, or from public or private research centers.
L’archive ouverte pluridisciplinaire HAL, est
destinée au dépôt et à la diffusion de documents
scientifiques de niveau recherche, publiés ou non,
émanant des établissements d’enseignement et de
recherche français ou étrangers, des laboratoires
publics ou privés.
Distributed under a Creative Commons Attribution - NonCommercial - ShareAlike| 4.0
International License
ASSESSMENT OF THE ADSORPTION OF
AEROMONAS HYDROPHILA ON POLYTHENE IN
SODIUM HYPOCHLORITE AND HYDROGEN
PEROXIDE TREATED WATER
Chrétien Djimeli, Antoine Arfao, O. V. Noah Ewoti, Vivien Rossi, Ernest
Lango-Yaya, Vincent Raspal, Moïse Nola, T Sime-Ngando
To cite this version:
Chrétien Djimeli, Antoine Arfao, O. V. Noah Ewoti, Vivien Rossi, Ernest Lango-Yaya, et al..
ASSESS-MENT OF THE ADSORPTION OF AEROMONAS HYDROPHILA ON POLYTHENE IN SODIUM
HYPOCHLORITE AND HYDROGEN PEROXIDE TREATED WATER. Journal of Water and
En-vironmental Sciences, 2018. �hal-01982191�
ASSESSMENT OF THE ADSORPTION OF AEROMONAS HYDROPHILA ON
POLYTHENE IN SODIUM HYPOCHLORITE AND HYDROGEN PEROXIDE
TREATED WATER
Article · April 2018 CITATIONS 0 READS 22 8 authors, including:Some of the authors of this publication are also working on these related projects:
Lac de Maga : état écologique, impacts des changements climatiques et risques sanitairesView project
GuyaSimView project Chretien Lontsi Djimeli
University of Yaounde I 24PUBLICATIONS 37CITATIONS
SEE PROFILE
Antoine Tamsa Arfao
Saint Jerome Catholic University Institute in Douala 20PUBLICATIONS 31CITATIONS
SEE PROFILE
Vivien Rossi
Cirad - La recherche agronomique pour le développement 110PUBLICATIONS 1,181CITATIONS
SEE PROFILE
Ernest Lango-Yaya
National Laboratory / University of Bangui 6PUBLICATIONS 3CITATIONS
SEE PROFILE
All content following this page was uploaded by Chretien Lontsi Djimeli on 30 August 2018.
………. .J. Wat. Env. Sci. Vol. 2, N°1 (2018), 270-287 ________________________________ ISSN: 2509-0445 http://revues.imist.ma/?journal=jwes Copyright © 2016 - 2018 RESEARCH ARTICLE
ASSESSMENT OF THE ADSORPTION OF AEROMONAS HYDROPHILA ON POLYTHENE IN
SODIUM HYPOCHLORITE AND HYDROGEN PEROXIDE TREATED WATER
C. LONTSI DJIMELI (1,*), A. TAMSA ARFAO1, O. NOAH EWOTI1, V. ROSSI(2, 3), E. LANGO-YAYA4, V. RASPAL5, M.
NOLA1, T. SIME-NGANDO6
1University of Yaoundé I, Faculty of Sciences, Hydrobiology and Environment. Laboratory, P.O. Box 812,
Yaoundé, Cameroon
2
University of Yaoundé 1, UMI209 UMMISCO, Yaoundé, Cameroon
3
CIRAD, UPR BSEF, Montpellier, France
4
University of Bangui, Faculty of Health sciences, Central African Republic
5
C-BIOSENSS–EA 4676, Clermont Université, Université d’Auvergne, Clermont-Ferrand, France
6
Laboratoire Microorganismes: Génome & Environnement, UMR CNRS 6023, Université Blaise Pascal, Complexe Scientifique des Cézeaux, 24 avenue des Landais, BP 80026, 63171 Aubière Cedex, France
*Corresponding author Email: lontsichretien@yahoo.com
Reçu : 1er Juillet 2017, Accepté : 22 Janvier 2018, En ligne : 7 Avril 2018 SUMMARY________________________________
A study was carried out on Aeromonas
hydrophila adhesion to polythene fragment at
different cell growth phases in aquatic microcosm. The main purpose of this study was to assess adsorption capacity, adsorption intensity and kinetics of Aeromonas hydrophila on polythene in sodium hypochlorite (NaOCl) and hydrogen peroxide (H2O2) disinfected water. The mean
abundance of adhered A. hydrophila sometimes reached 28 and 111CFU.cm-2 respectively in NaOCl and H2O2 treated water. The adsorption capacities
of A. hydrophila cells fluctuated between 1 and 2.12x1057 and between 1 and 2.29x1027 adhered cells.cm-2 in NaOCl and H2O2 disinfected water
respectively. The adsorption intensities of this bacterium ranged from -45.81 to 3.49x10¹⁹ and from 0.16 to 2.29x1027 respectively in NaOCl and H2O2 treated water. Adsorption capacity and
adsorption intensity of A. hydrophila cells on polythene in NaOCl treated water were greater than that obtained in water disinfected with H2O2.
Adhesion kinetics of A. hydrophila cells oscillated between 0.001 and 0.930 adhered cell.cm-2.h-1. Adsorption kinetics seem resulted from interactions between bacterial cells and substrates, and depended both on the fragment type and bacterial species. The values of A. hydrophila
surface hydrophobicity fluctuated between 65.11 and 92.74% in NaOCl disinfected water and between 63.38 and 89.41% in H2O2 treated water.
The mean values of contact angle ranged from 83.1±0.6 to 85.8±0.8°.
Adhesion of A. hydrophila on polythene is mediated amongst others by cell growth phases, cell surface hydrophobicity, cell kinetic adhesion, adsorption capacity and adsorption intensity.
Keywords: Adsorption capacity, Adsorption
intensity, Kinetic adhesion, Disinfectants, Cell growth phases, A. hydrophila.
1. INTRODUCTION
Bacterial movement in drinking water distribution networks is one of the important factors to be considered in water pollution (Nazarovs et al., 2012). Cell movement and transportation in water can occur by adsorption-desorption mechanisms (Teutsch et al., 1991; Kang and Lansey, 2011). This movement in distribution networks is influenced by the hydrodynamics and hydro-mechanical coefficients of bacterial scattering, water diffusion coefficient, coefficient of active mobility of bacteria, gradient of bacterial concentration, velocity of water movement and retardation factor, the magnitude of each
____________________________________________________________________________________________________________
271
parameter varying according to physiological and anatomical status of bacterial cells (Grasso et al., 1996; Douterelo et al., 2014). Their persistence and survival in drinking water distribution networks are also significantly influenced by disinfectant concentrations, micro-organisms densities, their growth and decay rates among others (Banton and Bangoy, 1997; Lontsi Djimeli et al., 2013).
Adsorption is the main process leading to a retarded bacterial transport in water (Teutsch et al., 1991; Douterelo et al., 2013). It is sometimes a reversible process that evolves with time, due to bacterial activity and variations of bacterial wall properties (Yee et al., 2000; Thomas and Ashbolt, 2011). Cell surface hydrophobicity is the main bacterial wall property which is involved in cell adhesion on substrates (Van Der Mei et al., 1998). Stability of this adhesion depends on the number of sites and groups of functional sites properties on the bacterial surface with site number expected to vary with the chemical characteristics of the environment (Fein et al., 1997; Yu et al., 2010). Bacterial exopolysaccharide matrix has been indicated as containing many chemically active sites involved in adsorption process (Wang et al., 2002). Bacterial adsorption in aqueous medium is also impacted by pH, ionic strength, chemicals, the hydrophobicity of substrate and its mobility coefficients (Yee et al., 2000; Guillemot, 2006). One of the major concerns of companies in charge of the drinking water treatment is to effectively meet the demand and maintain a good quality of water in distribution networks (Gauthier, 2002; Shamsaei et al., 2013). Drinking water distribution networks are often the place of many physico-chemical and biological reactions resulting in interactions between disinfectants, pipe walls, and free or fixed biomasses. These reactions are sometimes the cause of the deterioration of the organoleptic properties of supplied water (Mouchet et al., 1992; Schoenen, 2002; Ramos et al., 2010).
Analysis of the water distribution quality is based on physico-chemical and microbiological parameters (Schoenen, 2002; Thomas and Ashbolt, 2011). In recent years, the public health sector recognized the bacterium Aeromonas hydrophila as an opportunistic pathogen, implicated in
gastroenteritis, colitis, meningitis and respiratory infections (Krovacek et al., 1992; Graviel et al., 1998; Thomas and Ashbolt, 2011). To prevent bacterial re-growth, a residual disinfectant is maintained in the water distribution network. Ozone (O3), chlorine dioxide (ClO2),
monochloramine (NH2Cl), free chlorine (Cl2),
NaOCl, H2O2 are disinfectants that can be
sometimes used in water disinfection treatment (Cho et al., 2010).
Previous works have shown that A. hydrophila is a widespread species in the environment. This microorganism has been isolated from lakes, rivers, and especially in water intended for human consumption (Chauret et al., 2001; Hamieh et al., 2015). Its concentration was generally reached 102 CFU.ml-1 in the outlet of drinking water treatment plants. This concentration can be higher in drinking water distribution networks due to its growth forming biofilms (Payment et al., 1993; Chauret et al., 2001; Falkinham et al., 2015). Ingestion of contaminated food or water is the common route of advanced infection in the case of Aeromonas (Schubert, 1991; Falkinham et al., 2015).
Many studies focusing on monitoring of water supply and treatment plants have shown that despite treatment done upstream by adding a residual disinfectant to maintain disinfection in pipelines and oligotrophic medium, some bacteria adapt and proliferate in the water distribution networks (Ndjama et al., 2008; Shamsaei et al., 2013). They are sometimes the cause of nests and microbial biofilm formation among others. In addition, the variation of microorganisms in response to disinfectants can be linked to changes in their cell wall which may be due to a change in their growth stage (Briandet, 1999). While previous studies have allowed the understanding of mechanisms of emergence and evolution of biofilms of A. hydrophila in drinking water distribution systems (Chauret et al., 2001; Douterelo et al., 2014), there is little information on the adsorption capacity and kinetics of bacterial retention in drinking water distribution networks. The present study aimed at evaluating the adsorption capacity, adsorption intensity and kinetics of A. hydrophila on polythene in sodium hypochloriteand hydrogen peroxidetreated water.
272
2. MATERIALS AND METHODS
2.1. Collection and identification of
Aeromonas hydrophila
The bacterium A. hydrophila was isolated from well water in Yaoundé (Cameroon, Central Africa) using the membrane filtration technique, on ampicillin-dextrin agar culture medium (Marchal et al., 1991). Cell subculture was performed on standard agar medium (Bio-Rad laboratories, France). The cells were then identified using standard biochemical methods (Holt et al., 2000). These cells are anaerobic facultative, non-sporulated, Gram-negative bacilli, ferment mannitol, produce indole and are motile. They do not possess urease, lysine decarboxylase, ornithine decarboxylase and arginine dihydrolase. For the preparation of stocks of bacteria, the Colony Forming Units (CFUs) from standard agar medium were inoculated in 10 mL of nutrient broth (Oxford) for 24 hours at 37°C.
Afterwards, cells were harvested by centrifugation at 8000 rpm for 10 min at 10°C and washed twice with physiological solution (8.5 g.L
-1
NaCl). The pellet was re-suspended in physiological solution (8.5 g.L-1NaCl) and then transferred to 300 μL tubes. The stocks were then frozen stored (Holt et al., 2000; Rodier et al., 2009).
2.2. Assessment of the cell growth phases
On the basis of previous studies regarding the different growth phases and biofilm formation (Lontsi Djimeli et al., 2013; 2014), the cell growth phases were assessed at 37°C. The growth of A.
hydrophila in non-renewed peptone liquid medium
generally gives 4 growth phases: a lag growth phase from 0 to 2 hours, an exponential growth phase from 2 to 13 hours, a stationary growth phase from 13 to 22 hours, and a decline growth phase which begins as from the 22nd hour (Lontsi Djimeli et al., 2013; 2014).
2.3. Adsorbing substrate used
The adsorbing substrate used was high dense polythene. It differed from low radical dense polythene and low linear dense polythene by sparsely branched chains of its molecular structure, and its relatively high resistance to
shocks, high temperatures and ultraviolet rays (Coeyrehourcq, 2003; Boutaleb, 2007). It is a plastic piping material obtained directly from the manufacturer and used in drinking water distribution networks. High dense polythene results from polymerization of macromolecules of the polyolefin family. This polymerization is obtained from gaseous ethylene according to the following equation (Ratner, 1993; 1995):
The polythene used in this study is commercialized by Goodfellow SARL (France).
2.4. Disinfectants used
Two disinfectants were used: sodium hypochlorite (NaOCl) (Colgate-Palmolive, USA), which belongs to the group of halogen derivatives, and hydrogen peroxide (H2O2)(Gilbert,
France)belonging to the group of oxidants. The ease with which these two disinfectants are generally used in drinking water treatment justified their choice for this study. Concentrations of NaOCl used were 0.25, 0.5 and 0.75‰ while those of H2O2 were 2.5, 5 and 7.5‰. These concentrations
were evaluated by simple method of dilution of crude solution obtained directly from the manufacturer. To count the surviving bacteria obtained after disinfection, a physiological solution (8.5 g.L-1NaCl) was used as a diluent.
2.5. Adhesion tests of A. hydrophila on
polythene in NaOCl and H2O2 treated water
Prior to the experiment, the frozen phial containing A. hydrophila cells was defrosted at room temperature. The culture (300 μL) was then transferred into 10 mL of nutrient broth (Oxford) and incubated at 37°C for 24 hours and the cells latter collected by centrifugation at 8000 rpm for 10 min at 10°C and washed twice with sterile physiological solution (8.5 g.L-1NaCl). The sediment was then diluted in 10 mL of physiological solution (8.5 g.L-1NaCl).
After serial dilutions, the initial concentration of microorganisms in each mother solution was adjusted to 6x10⁸ CFU.mL-1 by reading the optical density (OD) at 600 nm using a spectrophotometer
____________________________________________________________________________________________________________
273
(DR/2800) followed by culture on ampicillin-dextrin agar medium. The suspension of 1 mL was then added to 99 mL of sterilized NaCl solution contained in Erlenmeyer flasks. For adhesion test in the presence of NaOCl, concentrations of 0.25, 0.5 and 0.75‰ were respectively introduced into the following three sets of 8 Erlenmeyer flasks: A1, A2, A3, A4, B1, B2, B3, B4; A1’, A2’, A3’, A4’, B1’, B2’, B3’, B4’ and A1’’, A2’’, A3’’, A4’’, B1’’, B2’’, B3’’, B4’’. Likewise, for the adhesion test in the presence of H2O2, concentrations of 2.5, 5 and
7.5‰ were respectively introduced into the following three sets of 8 Erlenmeyer flasks: A1, A2, A3, A4, B1, B2, B3, B4; A1’, A2’, A3’, A4’, B1’, B2’, B3’, B4’ and A1’’, A2’’, A3’’, A4’’, B1’’, B2’’, B3’’, B4’’. The concentrations chosen for each of disinfectant was based on our previous work (Lontsi Djimeli et al., 2014) on one hand, and the Martin and Maris (1993) experiments results which indicated the potential combination of disinfectants when assessing the synergistic effects, on the other hand.
A set of these Erlenmeyer flasks were incubated in triplicates under dynamic condition by stirring at a speed of 60 rpm, using a stirrer (Rotatest brand) and another set under static condition. The both sets were incubated for 180, 360, 540 and 720 min. All these incubations were done at laboratory temperature (25±1°C). After each incubation period, polythene fragments were then introduced into 10 mL of sterilized physiological solution (8.5 g.L-1NaCl). The unhooking of adherent cells was performed by vortex agitation at increasing speeds for 30 seconds in three consecutive series of 10 mL sterilized NaCl solution. This technique allows the unhooking of maximum adhered cells (Dukam et al., 1995; Noah Ewoti et al., 2011). The total volume of the suspensions containing unhooked A.
hydrophila was 30 mL. Collection and numbering of
unhooked cells was made by culture on ampicillin-dextrin agar medium using the spread plate method, followed by incubation on Petridishes at 37°C for 24 to 48 hours. The disinfectant was not evaluated after incubation.
2.6. Assessment of the Aeromonas
hydrophila surface hydrophobicity
A. hydrophila surface hydrophobicity was
measured by the adhesion test on polythene using
the Microbial Adhesion To Hydrocarbons (MATH) method (Rosenberg et al., 1980), as recently described by Jain et al. (2007). After culture on ampicillin-dextrin agar medium, cells were centrifuged at 8000 rpm for 10 min at 10°C, washed and resuspended at a concentration of 6x10⁸ CFU.mL-1 in distilled water (pH 4.9) by reading the spectrophotometer (DR 2800). The OD of the solution was measured at 400 nm (A0).Then 1mL of this solution was introduced into two sets (A and B) of 5 Erlenmeyer flasks each in triplicates A0, A0', A0'' and B0 , B0', B0'', A1, A1', A1'' and B1, B1', B1'', A2, A2', A2'' and B2, B2', B2'', A3, A3', A3'', and B3, B3', B3'', and A4, A4', A4'' and B4, B4', B4'' containing 99 mL sterilized physiological solution (8.5 g.L-1NaCl) and parallelepipedic shaped fragments of polythene of 13.28 cm² total surface area suspended to a wire of 0.1 mm diameter. The mixture was incubated at room temperature (25±1°C) under stationary and dynamic regimes for 180, 360, 540, and 720 min. After each incubation period, the OD of the aqueous phase was measured (A1). Concentrations of A. hydrophila inocula were assessed by turbidity and expressed by measuring the OD at 600 nm on a spectrophotometer (DR 2800). A density of 0.08 to 0.1 corresponded to 108 CFU.mL-1 (Haddouchi et al., 2009).
The percentage of cells adhered to the polythene was calculated using the following formula (Jain et al., 2007):
In this formula, A0 is the OD of the solution measured at 400 nm before substrate immersion, and A1 is the OD of the aqueous phase measured after cell adhesion process. According to Rosenberg et al. (1980) and Jain et al. (2007), the percentage of cells adhered to the polythene in this condition is closely proportional to the cell surface hydrophobicity. According to these authors, the more the value obtained is closer to 100% the more the cell surface is hydrophobic. The percentages of cells adhered were then compared to the hydrophobicity percentages (Jain et al., 2007).
274
2.7. Contact angle measurement of the polythene surface
The contact angle measurement of polythene was carried out using a goniometer (“Krüss” brand). A drop of 3 μL of distilled water was deposited on the surface of the polythene and the contact angle at the left and right was assessed, then the mean value was calculated. This contact angle measurement Theta (Ɵ) allows access to the hydrophobic/hydrophilic character of the polythene. The support is hydrophilic when Ɵ is low than 30° (Ɵ<30°), hydrophobic when Ɵis up to 90° (Ɵ>90°) and moderately hydrophobic and hydrophilic when Ɵ fluctuate between 30 and 90° (30<Ɵ<90°) (Guillemot, 2006).
2.8. Data analysis
Adhesion speeds of A. hydrophila on polythene were assessed by constructing linear regression of adhered A. hydrophila after each incubation period of three hours using an Excel program. As the incubation duration sequences were of 3 hours, the slope obtained from the linear regression has been divided by 3 and was then considered as the apparent cells adhesion speeds (ACAS). It was then expressed as adhered cells.cm-2.h-1.
The data from adsorption experiments were analyzed using the Freundlich isotherm model. This isotherm was chosen because of the number and the relevance of the information it provides on the real adsorption mechanisms on one hand, and its remarkable ability to match doses of adsorption on the other hand (Wang et al., 1995; Miller et al., 2001). The Freundlich isotherm is described by the following equation (Wang et al., 1995; Miller et al., 2001):
Cs= Kf .Cl/n
With Cs; the quantity of cells adsorbed in the presence of disinfectant, C; the concentration of cells adsorbed in the absence of disinfectant, Kf;
the Freundlich adsorption coefficient which is connected to the adsorption capacity, 1/n; linearity coefficient, and n being the intensity of adsorption. Here, Cs is expressed as number of adhered cells.cm-2 in the presence of disinfectant and C, the number of adhered cells.cm-2 in the absence of disinfectant. Constructing linear regression log Cs versus log C, resulting in a line of slope 1/n which intercepts the y-axis log Kf.
3. RESULTS
3.1. Abundance of cells adhered with respect to experimental condition in NaOCl treated water
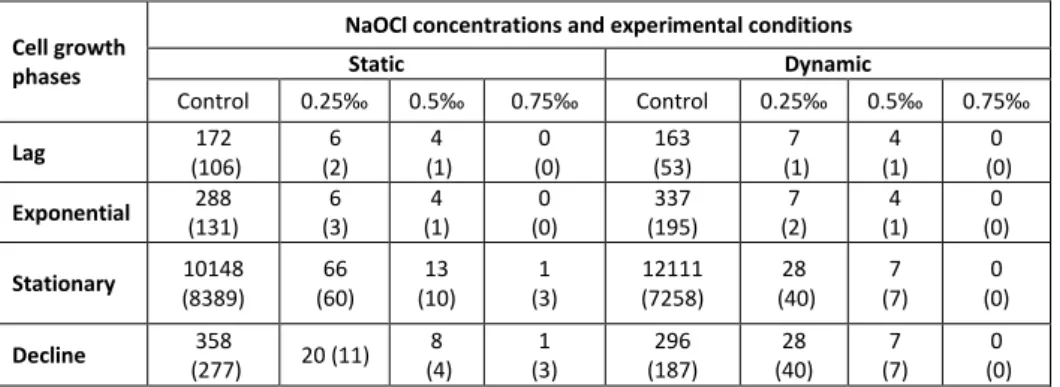
In the absence of NaOCl treatment, the mean abundance of A. hydrophila cells adhered to the substrates under static condition ranged from 172 to 1.015x10⁴ CFU/cm2. Under dynamic condition, it fluctuated between 163 and 1.2111x10⁴ CFU.cm-2. In water treated with different concentrations of NaOCl, the mean abundance of A. hydrophila adhered to polythene fluctuated with respect to the different cell growth phases and experimental conditions. The mean densities of A. hydrophila adhered to polythene sometimes reached 66 CFU.cm-2 under static condition (Table 1). Under dynamic condition, the mean abundance of adhered A. hydrophila cells sometimes reached 28 CFU.cm-2 in NaOCl treated water (Table 1). In both experimental conditions, the greatest abundance of cells adhered was registered in 0.25‰ NaOCl treated water when cells were harvested from the stationary growth phase.It is noted that under static condition as well as dynamic condition, the mean abundance of A. hydrophila cells adhered to polythene in NaOCl disinfected water was relatively lower than those obtained after the adhesion process in the absence of disinfectants (Table 1).
____________________________________________________________________________________________________________
275
Table 1. Mean abundance (standard deviation) of A. hydrophila cells adhered to polythene under static and dynamic conditions in NaOCl treated water.
3.2. Abundance of cells adhered with
respect to experimental condition in H2O2
treated water
Without H2O2 treatment, the mean abundance of
A. hydrophila cells adhered to polythene under the
stationary regime ranged from 172 to 1.015x10⁴CFU.cm-2. Under dynamic regime, it ranged from 163 to 1.2111x10⁴CFU.cm-2.
The density of A. hydrophila adhered to polythene in H2O2 disinfected water varied with
respect to the different cell growth phases and experimental conditions (Table 2). The abundance of adhered cells sometimes reached 111 CFU.cm-2
under static condition (Table 2). Under dynamic condition, the abundance of adhered cellsranged from 1 to 87 CFU.cm-2. In both experimental conditions, the greatest density of cells adhered was observed in water treated with 2.5‰ H2O2.
Under static condition, the greatest abundance of cells adhered was recorded with cells coming from lag growth phase, whereas under dynamic condition, it was registered with cells harvested from exponential growth phase. In both experimental conditions, the mean abundance of
A. hydrophila adhered to polythene in H2O2 treated
water was relatively lower than that observed in the absence of disinfectants (Table 2).
Table 2. Mean abundance (standard deviation) of microorganisms remained adhered to polythene under
static and dynamic conditions in H2O2 disinfected water.
3.3. Freundlich isotherms of adhered A.
hydrophila cells under static condition in
NaOCl and H2O2 disinfected water
Under static condition the number of A.
hydrophila cells adhered to polythene in water
treated with NaOCl and H2O2 decreased when
disinfectant concentrations increased. The cells
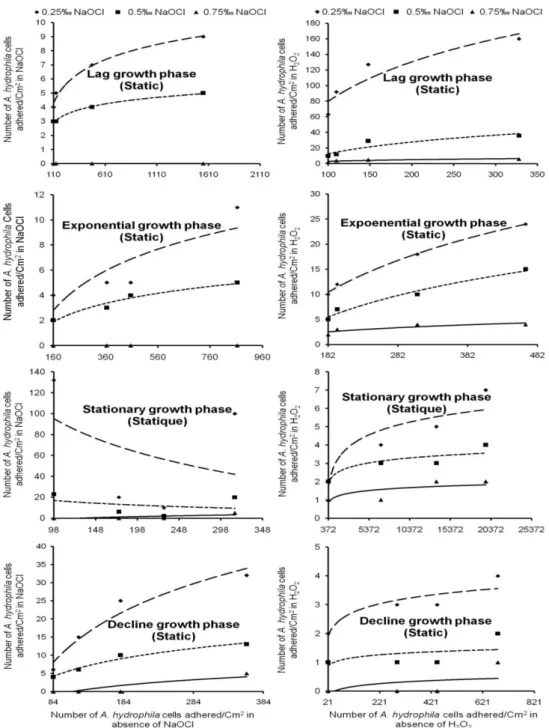
were sometimes completely decimated by NaOCl (Fig. 1).
The adsorption coefficient (Kf) of A. hydrophila
cells which is related to the adsorption capacity fluctuated between 54.60 and 2.12x1057 and between 7.40 and 9.74x10⁹ cells adhered.cm-2 respectively in water disinfected with 0.25 and 0.5‰ NaOCl. It sometimes reached 1 adhered
Cell growth phases
NaOCl concentrations and experimental conditions
Static Dynamic Control 0.25‰ 0.5‰ 0.75‰ Control 0.25‰ 0.5‰ 0.75‰ Lag 172 (106) 6 (2) 4 (1) 0 (0) 163 (53) 7 (1) 4 (1) 0 (0) Exponential 288 (131) 6 (3) 4 (1) 0 (0) 337 (195) 7 (2) 4 (1) 0 (0) Stationary 10148 (8389) 66 (60) 13 (10) 1 (3) 12111 (7258) 28 (40) 7 (7) 0 (0) Decline 358 (277) 20 (11) 8 (4) 1 (3) 296 (187) 28 (40) 7 (7) 0 (0) Cell growth phases
H2O2 concentrations and experimental conditions
Static Dynamic Control 2.5‰ 5‰ 7.5‰ Control 2.5‰ 5‰ 7.5‰ Lag 172 (106) 111 (42) 22 (13) 4 (2) 163 (53) 64 (15) 54 (18) 12 (4) Exponential 288 (131) 16 (6) 9 (4) 3 (1) 337 (195) 87 (77) 12 (4) 6 (2) Stationary 10148 (8389) 5 (2) 3 (1) 2 (1) 12111 (7258) 6 (2) 3 (1) 1 (1) Decline 358 (277) 3 (1) 1 (1) 0 (1) 296 (187) 12 (4) 5 (1) 3 (1)
276
cell.cm-2 in water disinfected with 0.75‰ NaOCl. The highest values of Kf were recorded with cells
harvested from the stationary growth phase and the lowest value was registered with cells coming from the lag, exponential and decline growth phases (Fig. 1). Linearity coefficient (1/n) ranged from -45.81 to 17.77 and from -6.33 to 6.37
respectively in water disinfected with 0.25 and 0.5‰ NaOCl. It has often reached 3.51 in water treated with 0.75‰NaOCl. The highest values of
1/n were obtained with cells harvested from
decline growth phase and the lowest observed with cells coming from the stationary growth phase (Table 3).
Fig. 1.Freundlich isotherms of adhered A. hydrophila cells under static condition in water treated with NaOCl
and H2O2.
In the presence of H2O2, the adsorption
coefficient (Kf) fluctuated between 7.40 and
2.29x1027, 2.72 and 2.20x10⁴ and between 1 and
7.40 cells adhered.cm-2 to polythene respectively in water disinfected with 2.5, 5 and 7.5 ‰ H2O2.
____________________________________________________________________________________________________________
277
coming from the lag and exponential growth phases and the lowest values were obtained with cells harvested from the decline growth phase (Fig. 1). The values of 1/n oscillated between 0.47 and 72.81, 0.16 and 21.60 and between 0.16 and 2.69
respectively in water treated with 2.5, 5 and 7.5‰ H2O2. The highest values of 1/n were found with
cells harvested from the lag phase and the lowest values noted with cells coming from the decline growth phase (Table 3).
Table 3. Values of adsorption coefficient Kf (adhered A. hydrophila cells/cm2) and linearity coefficient 1/n of
Freundlich isotherms under static and dynamic conditions.
3.4. Freundlich isotherms of adhered A.
hydrophila cells under dynamic condition
in NaOCl and H2O2 disinfected water.
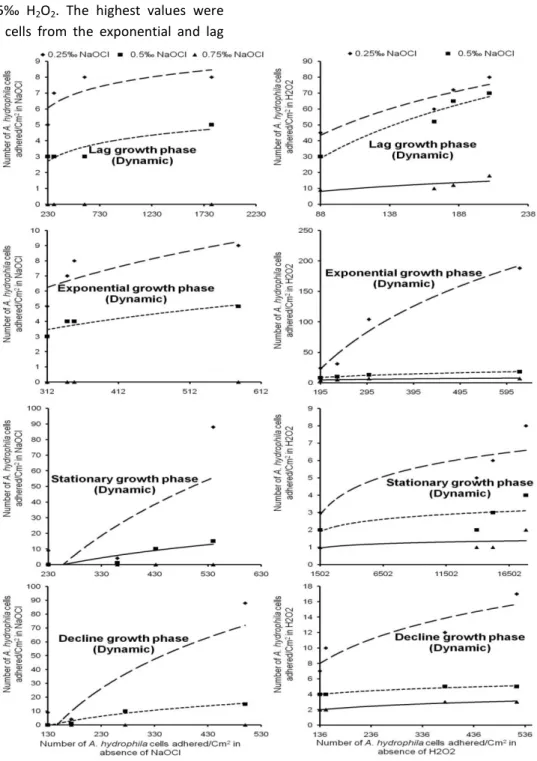
When NaOCl was used, Kf values ranged from
148.41 to 8.10x10³ and from 1 to 20.09 adhered cells.cm-2 respectively in water treated with 0.25 and 0.5‰ NaOCl. It sometimes reached 1 cell adhered.cm-2 in water disinfected with 0.75‰ NaOCl. The highest values were recorded with cells coming from the stationary and decline growth phases. The lowest Kf values were obtained with
cells harvested from the lag and exponential growth phases (Fig. 2).
The linearity coefficient (1/n) of adhered A.
hydrophila cells fluctuated between 1.16 and 75.21
and between 0.98 and 17.28 respectively in water treated with 0.25 and 0.5‰ NaOCl. A. hydrophila cells were often completely decimated in water disinfected with 0.75‰ NaOCl. The highest values were recorded with cells coming from the stationary and decline growth phases. The lowest values were registered with cells harvested from the lag and exponential growth phases (Table 3). When H2O2 was used, adsorption coefficient (Kf)
ranged from 20.09 to 3.49x10¹⁹; 7.40 to 1.07x10¹³ and from 2.72 to 8.10x10³adhered cells.cm-2 respectively in water disinfected with 0.25, 0.5 and 7.5‰ H2O2. The highest values were registered
with cells harvested from the lag growth phase and the lowest values were obtained with cells coming from the stationary growth phase (Fig. 2).
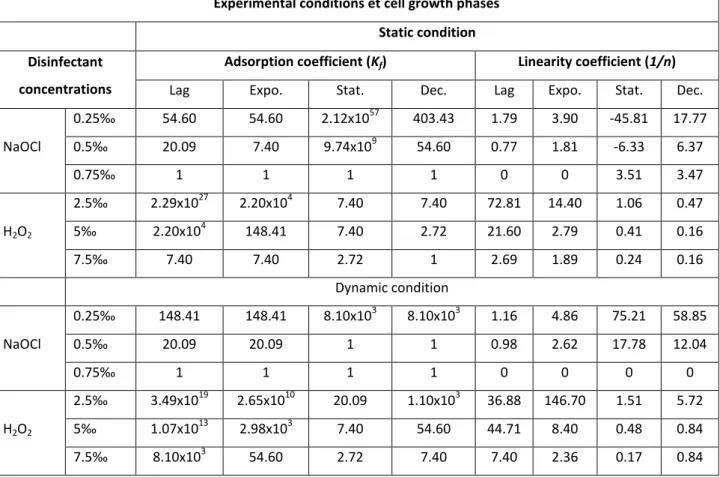
Experimental conditions et cell growth phases Static condition Disinfectant
concentrations
Adsorption coefficient (Kf) Linearity coefficient (1/n)
Lag Expo. Stat. Dec. Lag Expo. Stat. Dec.
NaOCl 0.25‰ 54.60 54.60 2.12x1057 403.43 1.79 3.90 -45.81 17.77 0.5‰ 20.09 7.40 9.74x10⁹ 54.60 0.77 1.81 -6.33 6.37 0.75‰ 1 1 1 1 0 0 3.51 3.47 H2O2 2.5‰ 2.29x1027 2.20x10⁴ 7.40 7.40 72.81 14.40 1.06 0.47 5‰ 2.20x10⁴ 148.41 7.40 2.72 21.60 2.79 0.41 0.16 7.5‰ 7.40 7.40 2.72 1 2.69 1.89 0.24 0.16 Dynamic condition NaOCl 0.25‰ 148.41 148.41 8.10x10³ 8.10x10³ 1.16 4.86 75.21 58.85 0.5‰ 20.09 20.09 1 1 0.98 2.62 17.78 12.04 0.75‰ 1 1 1 1 0 0 0 0 H2O2 2.5‰ 3.49x10¹⁹ 2.65x10¹⁰ 20.09 1.10x10³ 36.88 146.70 1.51 5.72 5‰ 1.07x10¹³ 2.98x10³ 7.40 54.60 44.71 8.40 0.48 0.84 7.5‰ 8.10x10³ 54.60 2.72 7.40 7.40 2.36 0.17 0.84
278
The linearity coefficient (1/n) fluctuated between 1.51 and 146.70, 0.17 and 0.48 and between 7.40 and 44.71 respectively in water disinfected with 2.5, 5 and 7.5‰ H2O2. The highest values were
recorded with cells from the exponential and lag
growth phases and the lowest values with cells coming from the stationary growth phase (Table 3).
Fig. 2.Freundlich isotherms of adhered A. hydrophila cells under dynamic condition in water disinfected with
NaOCl and H2O2.
3.5. Apparent cells adhesion speeds
The apparent cells adhesion speeds (ACAS) values were calculated and are indicated in table 4. It is noted thatthe highest ACAS (0.930cell.cm-2.h-1) was
recorded with cells coming from the lag phase and under dynamic condition. The lowest ACAS (0.001 and 0.005 adhered cells.cm-2.h-1) were registered with cells harvested from the stationary growth phase (Table 4).
____________________________________________________________________________________________________________
279
Table 4. Adhesion kinetics (regression coefficient) of A. hydrophila cells.
3.6. A. hydrophila surface hydrophobicity in NaOCl treated water
In the absence of NaOCl treatment, A. hydrophila surface hydrophobicity ranged from 53.86 to 92.21%. The highest value was observed under static condition after 720 min with cells coming from the stationary growth phase (Fig. 3). The lowest value was recorded under the same experimental condition with cells harvested from the decline growth phase after 180 min (Fig. 3). In these non-disinfected solutions, A. hydrophila cells were therefore very hydrophobic with cells coming from the stationary growth phase under static condition after 720 min.
In the presence of NaOCl treatment, various disinfectant concentrations caused a variation in A.
hydrophila surface hydrophobicity. Whatever the
cell growth phase, it was observed that a decrease of the cell surface hydrophobicity was inversely proportional to the concentration of NaOCl and the incubation period (Fig. 3).
With cells harvested from the lag growth phase,
A. hydrophila surface hydrophobicity fluctuated
between 66.76 and 67.33% in NaOCl treated water. It was almost constant with incubation periods. A. hydrophila cells were little hydrophobic
under static as well as dynamic conditions with respect to incubation periods in NaOCl disinfected water (Fig. 3).
With cells coming from the exponential growth phase, A. hydrophila surface hydrophobicity fluctuated between 92.07 and 92.74% in the water treated with NaOCl and was also almost constant with incubation durations (Fig. 3). Cells were more hydrophobic under static and dynamic conditions with respect to incubation periods in NaOCl disinfected water.
When cells harvested from the stationary growth phase, their surface hydrophobicity ranged from 89.05 to 89.77% in NaOCl treated water and was almost constant with incubation durations. Cells were more hydrophobic under static and dynamic conditions in NaOCl disinfected water after all incubation periods (Fig. 3).
With cells coming from the decline growth phase, surface hydrophobicity oscillated between 65.11 and 65.96% in NaOCl treated water. It was almost constant both with incubation periods and NaOCl concentrations (Fig. 3). When cells were in NaOCl treated water under static as well as dynamic conditions, they were not very hydrophobic with respect to incubation periods (Fig. 3).
Cell growth phases
Apparent adhesion speeds (cells/cm2/hour)
Static condition Dynamic condition
Lag 0.870 (0.267) 0.930 (0.260)
Exponential 0.074 (0.310) 0.181 (0.328)
Stationary 0.002 (0.270) 0.005 (0.318)
280
Fig. 3. Temporal evolution of A. hydrophila cell surface hydrophobicity under static and dynamic conditions in NaOCl treated solution.
3.7. A. hydrophila surface hydrophobicity
in H2O2 treated water
In the absence of H2O2 treatment, cell surface
hydrophobicity ranged from 53.86 to 92.21%. The highest value was registered under static condition with cells harvested from the stationary growth phase after 720 min incubation, while the lowest value was registered under the same experimental
condition but with cells coming from the decline growth phase after 180 min of incubation (Fig. 4). Cells from stationary growth phase seem very hydrophobic under static condition.
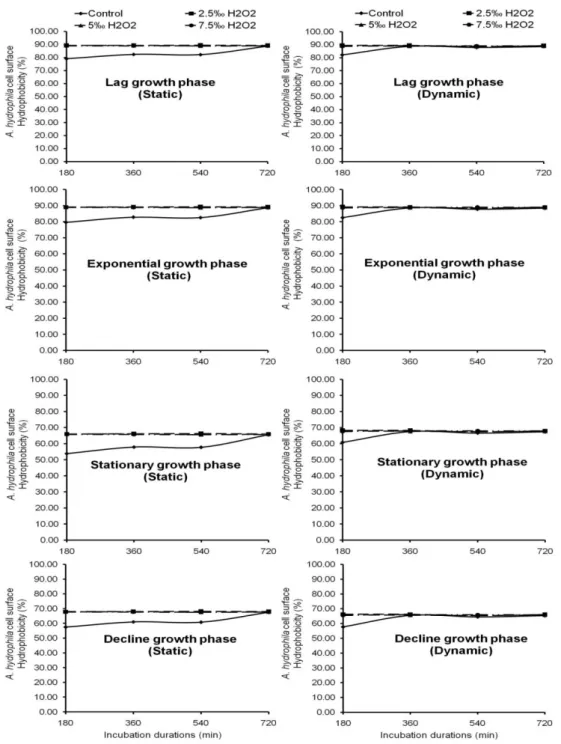
H2O2 disinfectant at different concentrations
caused a variation of A. hydrophila surface hydrophobicity. Whatever the cell growth phase, it was observed that a decrease in cell surface
____________________________________________________________________________________________________________
281
hydrophobicity was inversely proportional to H2O2
concentrations and incubation periods (Fig. 4). With cells harvested from the lag growth phase, surface hydrophobicity oscillated between 88.64 and 89.41% in H2O2 disinfected water. Cells coming
from the exponential growth phase have surface hydrophobicity which fluctuated between 88.51
and 89.23% in H2O2 disinfected solutions (Fig. 4).
Those from stationary growth phase, have surface hydrophobicity which ranged from 67.39 to 68.18% in H2O2 treated water. It relatively increased with
the increasing of the incubation durations and H2O2 concentrations.
Fig. 4.A. hydrophila cell surface hydrophobicity under static and dynamic conditions in H2O2 treated
solutions.
When cells were harvested from the decline growth phase, surface hydrophobicity oscillated between 65.38 and 66.31% in H2O2 treated water.
It increased both with incubation durations and H2O2 concentrations (Fig. 4). With cells coming
282
from stationary growth phase, surfaces seem moderately hydrophobic to hydrophilic under static and dynamic conditions.
3.8. Polythene contact angle measurement
Measurements showed that the values of the polythene contact angle(Ɵ) on the left and right of the distilled water drop on three fragments respectively fluctuated between 83.5 and 85.6° and between 82.7 and 86.3°. The mean values ranged from 83.1±0.6 to 85.8±0.8°. The distilled water drop therefore tends not to spread well on polythene fragment. The polythene used in our study seems moderately hydrophobic and hydrophilic (30°<Ɵ<90°).
4. DISCUSSION
A. hydrophila cells adhered to polythene at
different degrees with respect to incubation periods, cell surface hydrophobicity, cell growth phases and disinfectant concentrations in water. Irrespective of the cell growth phase or experimental condition considered, the abundance of A. hydrophila cells adhered to polythene decreased with incubation periods as well as with decrease concentrations of NaOCl and H2O2.
Interactions exist between solid fragments that are invariant and bacterial cell surfaces which depend on the bacterial physiological condition (Grasso et al., 1996). Decrease in planktonic A. hydrophila cell abundance expresses sorption on polythene fragments. A. hydrophila adsorption on polythene in NaOCl and H2O2 treated water decreased with
respect to disinfectant concentrations and incubation durations. According to Simoni et al. (1998), adsorption process is passive at the beginning, less energy-dependent, and turns to be moreenergy-dependent as incubation durationbecomes longer, probably due to the restriction ofbacterial sorption sites number. Whatever experimental condition or cell growth phase considered, the adsorption coefficient (Kf) of
A. hydrophila cells adhered to polythene was
relatively higher in NaOCl treated water than that found in H2O2 disinfected water. Higher value of
adsorption coefficients implies greater adsorption capacity and lower adsorption coefficient implies lower polythene fragments adsorption capacity.
The variability sometimes observed in this substrate adsorption potential could be due to the variability of the number of adhesion sites groups on fragments (Fein et al., 1997; Sadovskaya et al., 2010).
On the contrary, the linearity coefficient (1/n) of this bacterium was relatively higher in H2O2 treated
water than that registered in NaOCl disinfected water. Lower values of linearity coefficient implied that bacterial adsorption intensity was relatively great and greater linearity coefficient implied adsorption intensity was relatively low (Fein et al., 1997). Some disinfectants are more effective than others in inactivation of microorganisms adhered to substrates. Changes in the efficacy of disinfectants in different experimental conditions can have implications in practice, where the same disinfectant could have a different impact on the cells adhered in different contexts (Leung et al., 2012). When considering A. hydrophila cells at a specific growth phase and in definite disinfectant solutions, the adsorption coefficient was relatively higher under static condition than under dynamic condition. Inversely, the linearity coefficient was relatively higher under dynamic condition than under static condition. Disinfectants in different experimental conditions may have implications for practice as regards variations in efficacy. A disinfectant may have a different influence on adhered cells under different conditions (Leung et al., 2012). Once the bacterium adhered to the surface, its multiplication leads to the formation of a colony which will progressively cover all or part of the surface according to the surface properties of the bacteria and materials, and result in the formation of a biofilm (Douterelo et al., 2014). It has been noted that bacterial sorption to surfaces is due to cell-surface components call adhesin which is a hydrophobic protein of molecular weight greater than 10 kDa, located at the cellular surface or in the cytoplasm (Nikolaev, 2000; Asamoah Sakyi and Asare, 2012). Its activity is inhibited in the presence of an anti-adhesin which is a substance that recognizes a receptor-binding motif. This anti-adhesin is hydrophobic non proteinic and heat-sensitive compound (Nikolaev and Prosser, 2000). Many interactions have been indicated to be exhibited by adhered bacteria and they can significantly influence their structure and
____________________________________________________________________________________________________________
283
their physiology (Millsap et al., 1998). The structure of a biofilm depends on environmental conditions such as the carbon source or hydrodynamic regime (Klausen et al., 2006; Abe et al., 2012). Thereafter the biofilm has an exponential cell growth resulting in a significant increase in its thickness to form a three dimensional heterogeneous film (Sauer et al., 2002). In this three dimensional structure, channels are formed for the circulation of nutrients (Costerton et al., 1999; Asamoah Sakyi and Asare, 2012).
The apparent adhesion speed of A. hydrophila cells fluctuated with respect to different growth phases and experimental conditions. This could be explained by changes in the physiology of A.
hydrophila at each cell growth phase. Indeed,
bacteria at each cell growth phase adopt several strategies for survival. Some differentiate themselves into metabolically inactive resistant forms. Others develop regulatory systems to control the stress suffered by adapting their metabolism for maximum energy and nutrients savings. In the latter situation, bacteria exhibit several adaptations: The degradation of cellular RNA and protein with the release of nucleotides and amino acids respectively to be used for new RNA synthesis or used as an energy source (Nazarovs et al., 2012). The implementation of transport systems and assimilation as substitutes for missing elements are essentially nitrogenous, phosphoric, carbonic and ferric compounds. The synthesis of stress proteins protected microorganisms from nutrient deprivation and other stress (Ramos et al., 2010). Moreover, O'Toole and Kolter (1998) were able to identify certain factors of mobility and adherence. They showed that a defective mutant in the formation of flagella adheres lightly to a support. It has been shown that mutants possessing an inactive flagellum were also unable to adhere to a surface (Vallet et al., 2001). The initial step of bacterial attachment to substrates involves generating motion appendices which allow them to approach the surface to colonize (O'Toole and Kolter, 1998; Douterelo et al., 2013). These appendices consist of flagella and pili which are at the origin of specific interactions between the parietal molecules of
microbial surface and the surface of the substrates (Rijnaarts et al., 1999; Camesano and Logan, 2000). The presence of these appendices and their normal operations were indicated as important factors for the adhesion of bacteria to the substrates (Vallet et al., 2001).
The measurement of the contact angle reflects the ability of a liquid to spread on a surface as a function of wettability. The use of water as a laying liquid for the drop allowed the evaluation of the hydrophilic/hydrophobic character of the surface. The polythene used in this study is moderately hydrophobic and hydrophilic. Indeed, the surface of the polythene does not possess sufficiently polar or ionic functional groups, or suitable sites for hydrogen bond formation; this surface is inert as opposite to water. Water molecules found at the proximity of polythene surface tend to move away to be surrounded by other water molecules (Guillemot, 2006). A high surface hydrophobicity of bacteria is often correlated to a strong adhesion to plastic substrates which are hydrophobic (Kuhn et al., 2002). Gallardo-Moreno et al. (2002) observed that germs with high surface hydrophobicity adhere more strongly to hydrophobic substrates.The same trend was also observed in cell adhesion to polystyrene.
5. CONCLUSION
This study demonstrated that decrease in kinetic adhesion of A. hydrophila cells abundance expresses on one hand cell adsorption on polythene fragments and on the other hand bactericidal activity of disinfectants influencing cell adhesion. Adsorption of A. hydrophila cells on polythene in water treated with NaOCl and H2O2
decreased with incubation duration and disinfectant concentrations. This study also revealed greater adsorption capacity and adsorption intensity of A. hydrophila cells on polythene in water treated with NaOCl than that obtained in water disinfected with H2O2.
Adsorption kinetics seemed to result from interactions between bacterial cells and substrates. Adsorption kinetics also results both on fragment type and bacterial species.
284
Adhesion of A. hydrophila to polythene is mediated by cell growth phases, cell surface hydrophobicity, cell kinetic adhesion, adsorption capacity and adsorption intensity amongst others.
REFERENCES
- ABE Y., SKALI-LAM IS., BLOCK J.C., FRANCIUS G. (2012). Cohiveness and hydrodynamic properties of young drinking water biofilms. Water
Research, 46, 1155-1166.
- ASAMOAH SAKYI P., ASARE R. (2012) Impact of Temperature on Bacterial Growth and Survival in Drinking-Water Pipes, Research Journal of
Environmental and Earth Sciences 4(8): 807-817.
- BANTON O., BANGOY L.M. (1997). Hydrogéologie, Multiscience environnementale des eaux souterraines, Puq/Aupelf, Sainte-Foy, 460 p.
- BOUTALEB N. (2007).Étude de la formation des biofilms sur les surfaces de matériaux couramment utilisés dans les canalisations d’eau potable. Thèse de Doctorat, Université de Bretagne-Sud, 194p.
- BRIANDET R. (1999). Maîtrise de l’hygiène des surfaces par la création des biofilms-Aspects physicochimiques. Thèse de Doctorat, École Nationale Supérieure Agronomique de Rennes, Rennes, 170p.
- CAMESANO T.A., LOGAN B.E. (1998). Influence of fluid velocity and cell concentration on the transport of motile and nonmotile bacteria in porous media. Environ. Sci. Technol., 32: 1699-1708.
- CHAURET C., VOLK C., CREASON R., JAROSH J., ROBINSON J., WARNES C. (2001). Detection of
Aeromonas hydrophila in a drinking-water
distribution system: a field and pilot study.
Review of Canadian Microbiology, 47: 782-786.
- CHO M., KIM J., KIM J.Y., YOON J., KIM J.H. (2010). Mechanisms of Escherichia coli
inactivation by several disinfectants. Water
Research, 44: 3410-3418.
- COSTERTON J.W., STEWART P.S., GREENBERG E.P. (1999). Bacterial biofilms: a common cause of persistent infections. Science, 284: 1318-1322. - Coeyrehourcq K.L. (2003). Étude de méthodes
rapides d’analyse de la structure moléculaire du polyéthylène. Thèse de Doctorat de l’École des
Mines de Paris Spécialité Science et Génie des Matériaux, 227 pages.
- DOUTERELO I., SHARPE R.L., BOXALL J.B. (2013). Influence of hydraulic regimes on bacterial community structure and composition in an experimental drinking water distribution system.
Water Research, 47: 503-516.
- DOUTERELO I., HUSBAND S., BOXALL J.B. (2014). The bacteriological composition of biomass recovered by flushing an operational drinking water distribution system. Water research, 54: 100-114.
- DUKAM S., PIRION P., LEVI Y. (1995) Modélisation du développement des biomasses bactériennes libres et fixées en réseau de distribution d’eau potable. Dans :Adhésion des microorganismes aux surfaces. Bellon-Fontaine M.N. et Fourniat J. (éds), Paris, 149-160.
- FALKINHAM J.O., PRUDEN A., EDWARDS M. (2015). Opportunistic Premise Plumbing Pathogens: Increasingly Important Pathogens in Drinking Water, Pathogens, 4, 373-386.
- FEIN J.B., DAUGHNEY C.J., YEE M., DOWIS T.A. (1997). A chemical equilibrium model for metal adsorption on to bacterial surfaces. Geochimica
Cosmochimica Acta, 61: 3319-3328.
- GALLARDO-MORENO A.M., GONZALEZ-MARTIN M.L., PEREZ-GIRALDO C., GARDUNO E., BRUQUE J.M., GOMEZ-GARCIA A.C. (2002). Thermodynamic analysis of growth temperature dependence in the adhesion of Candida
parapsilosis to polystyrene. Applied Environment Microbiology, 68:2610-2613.
- GAUTHIER F. (2002). Biofilms et qualité biologique de l'eau Potable au cours de sa distribution. Mémoire DESS Université de Picardie - Amiens, 78p.
- GRAVIEL A.A., LANDRE J.P.B., LAMB A.J. (1998). Incidence of mesophilic Aeromonas within a public drinking water supply in North-East Scotland. Journal of Applied Microbiology, 84: 383-392.
- GRASSO D., SMETS B.F., STREVETT K.A., MACHINIST B.D., VAN OSS C.J., GIESE R.F., WU W. (1996). Impact of physiological state on surface thermodynamics and adhesion of Pseudomonas
aeruginosa. Environmental Sciences and Technology, 30: 3604-3608.
____________________________________________________________________________________________________________
285
- GUILLEMOT G. (2006). Compréhension des mécanismes à l’origine de l’adhésion de
Saccharomyces cerevisiae sur acier
inoxydable-Implications pour l’hygiène des surfaces en industrie agroalimentaire.Thèse de Doctorat de l'Institut National des Sciences Appliquées de Toulouse, 324p.
- HADDOUCHI F., LAZOUNI H.A., MEZIANE A., BENMANSOUR A. (2009).Étude physicochimique et microbiologique de l’huile essentielle de
Thymus fontanesii Boiss & Reut, Afrique Science,
05(2):246-259.
- HAMIEH A., OLAMA Z., KHAWAJA G., HOLAIL H. (2015). Bacterial Diversity and Biofilm Formation in Drinking Water Distribution System in Lebanon.International Journal of Current Microbiology and Applied Sciences,4(5): 976-990.
- HOLT J.G., KRIEG N.R., SNEATH P.H.A., STALEY J.T., WILLIAMS S.T. (2000). Bergey’s manual of
determinative bacteriology. 9th edition, Lipponcott Williams and Wilkins, Philadelphia. 359p.
- JAIN A., NISHAD K.K., BHOSLE N.B. (2007). Effects of DNP on the cell surface properties of marine bacteria and its implication for adhesion to surfaces. Biofouling, 23:171-177.
- KANG D., LANSEY K. (2011) Demand and roughness estimation in water distribution systems, Journal of Water Resources, 137, 20-30. - KLAUSEN M., GJERMANSEN M., KREFT J.U.,
TOLKER-NIELSEN T. (2006). Dynamics of development and dispersal in sessile microbial communities: examples from Pseudomonas
aeruginosa and Pseudomonas putida model
biofilm. Federation of European Microbiological
Societies Microbiology Letters, 261:1-11.
- KROVACEK K., FARIS A., BALODA S.J., LINDBERG T., PETERZ M., MANSSON I. (1992). Isolation and virulence profiles of Aeromonas spp. from different municipal drinking water supplies in Sweden. Journal of Food and Microbiology, 9 (3): 215-222.
- KUHN D.M., CHANDRA J., MUKHERJEE P.K., GHANNOUM M.A. (2002). Comparison of biofilms formed by Candida albicans and Candida
parapsilosis on bioprosthetic surfaces. Infection and Immunity, 70:878-888.
- LEUNG C.Y., CHAN Y.C., SAMARANAYAKE L.P., SENEVIRATNE C.J. (2012). Biocide resistance of
Candida and Escherichia coli biofilms is
associated with higher antioxidative capacities.
Journal of Hospital Infection, 81:79-86.
- Lontsi Djimeli C., Nola M., Tamsa Arfao A., Nandjou Nguéfack R.V., Noah Ewoti O.V., Nougang M.E., Moungang M.L. (2013). Effect of disinfectants on adhered Aeromonas hydrophila to polythene immersed in water under static and dynamic conditions, International Journal of
Research in BioSciences, vol. 2, pp. 33–48.
- LONTSI DJIMELI C., TAMSA ARFAO A., NOAH EWOTI O.V., NOUGANG M.E., MOUNGANG M.L., BRICHEUX G., NOLA M., SIME-NGANDO T. (2014) Mixture of Sodium Hypochlorite and Hydrogen Peroxide on Adhered Aeromonas hydrophila to Solid Substrate in Water: Impact of Concentration and Assessment of the Synergistic Effect. International Journal of Bacteriology. Volume 2014, Article ID 121367, 13p.
- MARCHAL N., BOURDON J.L., RICHARD C. (1991). Culture mediafor isolationandbiochemical identificationofbacteria. Doin ed., Paris, 509p. - MARTIN AND MARIS (1993). Modes of action of
disinfectants. In: Disinfectants: actions and applications, Mc Daniel H.A., ed., Revue
Scientifique et Technique de l’Office International d’Epizootics, 14 :47-55.
- MILLER M.J., CRITCHLEY M.M., HUSTON J., FALLOWFIELD H.J. (2001). The absorption of cyanobacterial hepatotoxins from water onto soil during batch experiments. Water Research, 35: 1461-1468.
- MILLSAP K.W., VAN DER MEI H.C., BOS R.,. BUSSCHER H.J (1998). Adhesive interaction between medically important yeasts and bacteria. Federation of European Microbiological
Societies Microbial Review, 21: 321-336.
- MOUCHET P., MONTIEL A., RIGAL S. (1992). Dégradations physico-chimiques de l’eau dans les réseaux de distribution. T.S.M. L’eau, 87: 299-306.
- NAZAROVS S., DEJUS S., JUHNAT. (2012). Modelling water quality in drinking water distribution networks from real-time direction data,Drinking Water Engineering and Science, 5, 39-45.
- NDJAMA J., KAMGANG V., SIGHA L., LIENOU L., EKODECK G.E., TITA M.A. (2008). Water supply, sanitation and health risks in Douala, Cameroon.
286
African Journal of Environmental ScienceTechnology, 11(2): 422-429.
- NIKOLAEV Y.A. (2000). Role of long-range interactions in the regulation of adhesion of
Pseudomonas fluorescens cell. Mikrobiologiya,
69: 356-361.
- NIKOLAEV Y.BA., PROSSER J.I. (2000). Some properties of Pseudomonas fluorescens adhesion and anti-adhesin. Mikrobiologiya, 69: 237-242. - NOAH EWOTI O.V., NOLA M., MOUNGANG L.M.,
NOUGANG M.E., KRIER F., NOUR-EDDINE C. (2011). Adhesion of Escherichia coli and
Pseudomonas aeruginosa on Rock surface in
aquatic Microcosm: Assessment of the influence of Dissolved Magnesium Sulfate and Monosodium Phosphate. Research Journal of
Environment and Earth Science, 3(4):364-374.
- PAYMENT P., FRANCO E., SIEMIATYCKI J. (1993). Absence of relationship between health effects due to tap water consumption and drinking water quality parameters. Water Science
Technology, 27, 137-143.
- RAMOS, H., LOUREIRO D., LOPES A., FERNANDES C., COVAS D., REIS L.F., CUNHA M.C. (2010). Evaluation of chlorine decay in drinking water systems for different flow conditions: from theory to practice. Water Resources and
Management 24, 815-834.
- Ratner B. D. (1993). Plasma deposition of organic thin film-control of film chemistry. Polymer
Preprints, vol. 34, pp. 643-644.
- Ratner B.D. (1995). Surface modification of polymers: chemical, biological and surface analytical challenges, Biosensors and Bioelectronics, 10: 797-804.
- RIJNAARTS H.H.M., NORDE W., BOUWER E.J., LYKLEMA J., ZEHNDER A.J.B. (1995). Reversibility and mechanism of bacterial adhesion. Colloids
and Surfaces B: Biointerfaces, 4: 5-22.
- RODIER J., LEGUBE B., MERLET N., MIALOCQ J.C., P. LEROY, HOUSSIN M., LAVISON G., BECHEMIN C., VINCENT M. (2009). L’analyse de l’eau In Dunod Paris, 9ème Edition, 1579p.
- ROSENBERG M., GUTNICK D., ROSENBERG E. (1980). Adherence of bacteria to hydrocarbons: A simple method for measuring cell-surface hydrophobicity. FEMS Microbiology Letters, 9: 29-33.
- SADOVSKAYA I., VINOGRADOV E., LI J., HACHANI A., KOWALSKA K., FILLOUX A. (2010). High-level antibiotic resistance in Pseudomonas aeruginosa biofilm: the ndvB gene is involved in the production of highly glycerol-phosphorylated beta-(1->3)-glucans, which bind aminoglycosides.
Glycobiology, 20: 895-904.
- SAUER K., CAMPER A.K., EHERLICH G.D., COSTERTON J.W., DAVIES D.G. (2002).
Pseudomonas aeruginosa displays multiple
phenotypes during development as a biofilm.
Journal of Bacteriology, 184: 1140-1154.
- SCHOENEN D. (2002). Role of disinfection in suppressing the spread of pathogens with drinking water: possibilities and limitations.
Water Research, 36: 3874-3888.
- SCHUBERT R.H.W. (1991). Aeromonas and their significance as potential pathogens in water.
Journal of Applied Bacteriology Supplied, 70:
131S-135S.
- SHAMSAEI H., OTHMAN J., NOOR EZLIN A.B. (2013). Effects Residence Time to Water Quality in Large Water Distribution Systems. Engineering, 5, 449-457.
- SIMONI S.F., HARMS H., BOSMA T.N., ZEHNDER A.J.B. (1998). Population heterogeneity affects transport of bacteria through sand columns at low rates. Environmental Science and Technology, 32:2100-2105.
- TEUTSCH G., HERBOLD-PASCHKE K., TOUGIANIDOU D., HAHN T., BOTZENHART K. (1991). Transport of microorganisms in the underground-processes, experiments and simulation models. Wat. Sci. Technol., 24: 309-314.
- THOMAS J.M., ASHBOLT N.J. (2011). Do free-living amoebae in treated drinking water systems present an emerging health risk? Environmental
Sciences and Technology, 45: 860-869.
- VALLET I., OLSON J.W., LORY S., LAZDUNSKI A., FILLOUX A. (2001). The chaperone/usher pathways of Pseudomonas aeruginosa:
identification of fimbrial gene clusters (cup) and their involvement in biofilm formation.
Proceedings of the National Academy Science U.S.A, 98: 6911-6916.
- VAN DER MEI H.C., BOS R., BUSSCHER H.J. (1998). A reference guide to microbial cell surface
____________________________________________________________________________________________________________
287
hydrophobicity based on contact angles. Colloids and Surfaces B: Biointerfaces, 11:213-221. - WANG I., ANDERSON J.M., JACOBS M.R.,
MARCHANT R.E. (1995). Adhesion of
Staphylococcus epidermidis to biomedical polymers: Contributions of surface thermodynamics and hemodynamic shear conditions. Journal of Biomedical Material
Resources, 29, 485-493.
- O’TOOLE G.A., KOLTER R. (1998). Flagellar and twitching motility are necessary for
Pseudomonas aeruginosabiofilm development. Molecular Microbiology,30: 295-304.
- WANG W., ZHANG X., WANG D. (2002). Adsorption of p-chlorophenol by biofilm components. Water Resource, 36: 551-560. - YEE N., FEIN J.B., DAUGHNEY C.J. (2000).
Experimental study of the pH, ionic strength, and reversibility behavior of bacteria-mineral adsorption. Geochimica and Cosmochimica Acta, 64: 609-617.
- YU J., KIM D., LEE T. (2010). Microbial diversity in biofilms on water distribution pipes of different materials. Water Science and Technology 61, 163-171.
View publication stats View publication stats