SUPPLEMENTARY INFORMATION
Immunological response to nitroglycerin-loaded shear-responsive
liposomes in vitro and in vivo
Marzia Buscema
a, Sofiya Matviykiv
a, Tamás Mészáros
b,c, Gabriela Gerganova
a,
Andreas Weinberger
d, Ute Mettal
d, Dennis Mueller
d, Frederik Neuhaus
d, Etienne Stalder
d,
Takashi Ishikawa
e, Rudolf Urbanics
c, Till Saxer
f, Thomas Pfohl
a, János Szebeni
b,c,
Andreas Zumbuehl
dand Bert Müller
aaBiomaterials Science Center, Department of Biomedical Engineering, University of Basel, Allschwil, Switzerland bNanomedicine Research and Education Center, Semmelweis University Budapest, Hungary
cSeroScience Ltd, Budapest, Hungary
dDepartment of Chemistry, University of Fribourg, Fribourg, Switzerland ePaul Scherrer Institute (PSI), Villigen, Switzerland
fCardiology Division, University Hospital of Geneva, Geneva, Switzerland
* Corresponding author at: Biomaterials Science Center, Department of Biomedical Engineering, University of Basel, 4123 Allschwil, Gewerbestrasse 14, Switzerland, Tel: +41 61 207 54 30
E-mail address: [email protected] (B. Müller).
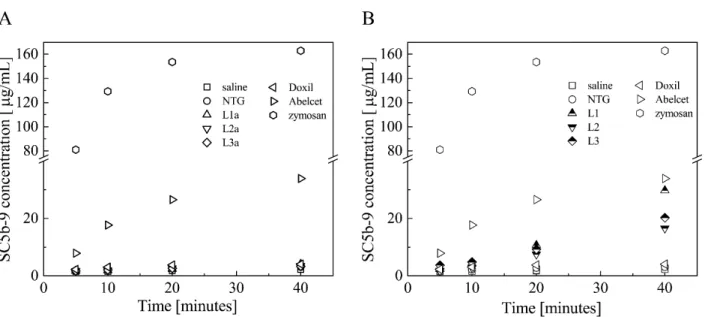
Fig. S1. Time point in vitro experiment. SC5b-9 concentration of six human sera incubated at a temperature of 37 °C
with the positive, negative controls and liposomes at high lipid content (A) and at low lipid content (B). The data are shown as the mean value among the six donors. The reaction was terminated after 5, 10, 20, and 40 minutes. The data were sorted as A and B, in order to visualize clearly the SC5b-9 level of the Pad-PC-Pad-based liposomes at high and low lipid content.
Table S2
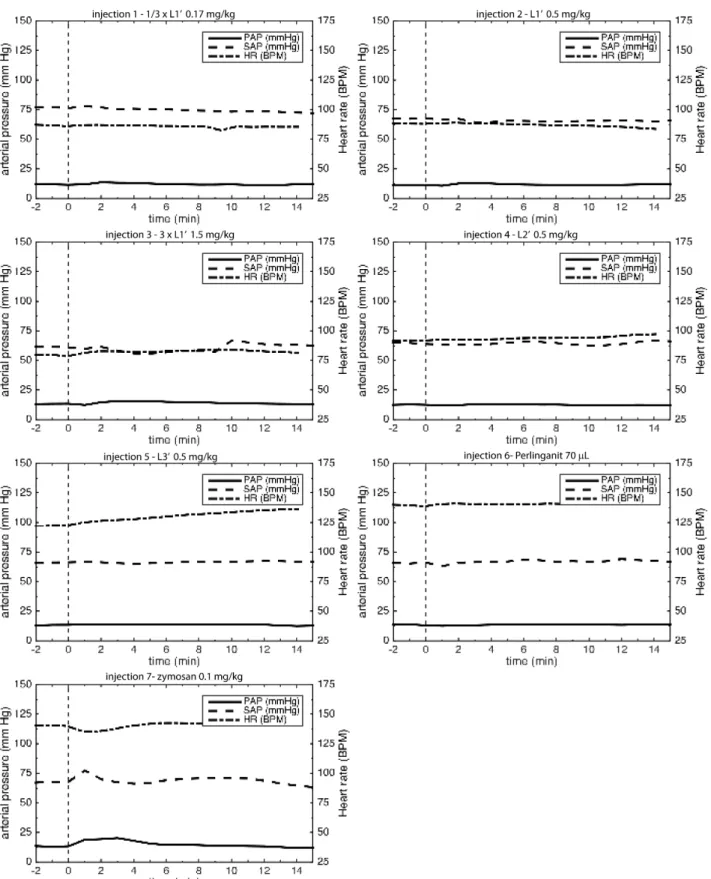
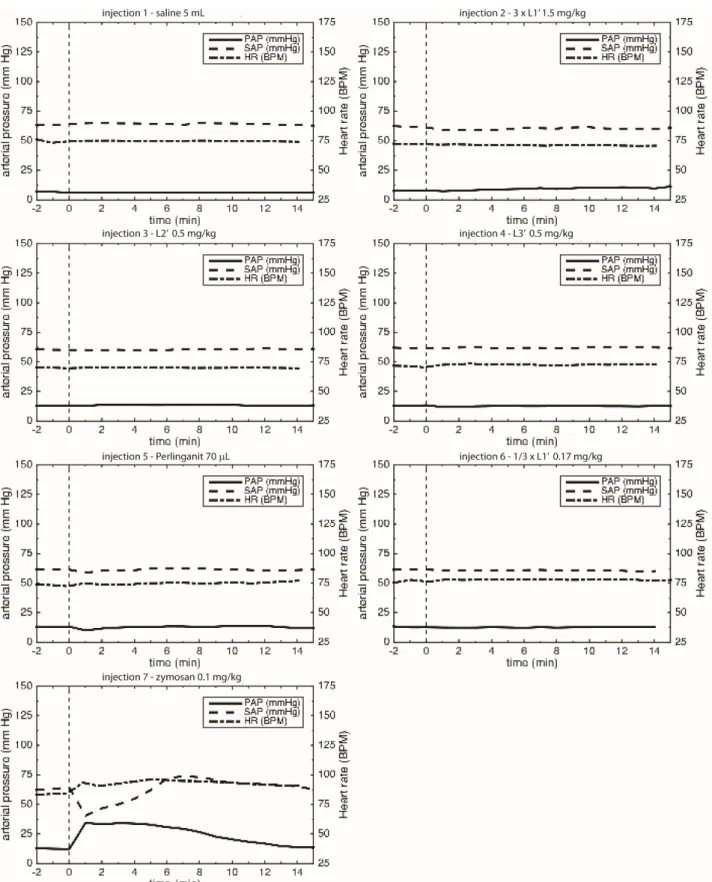
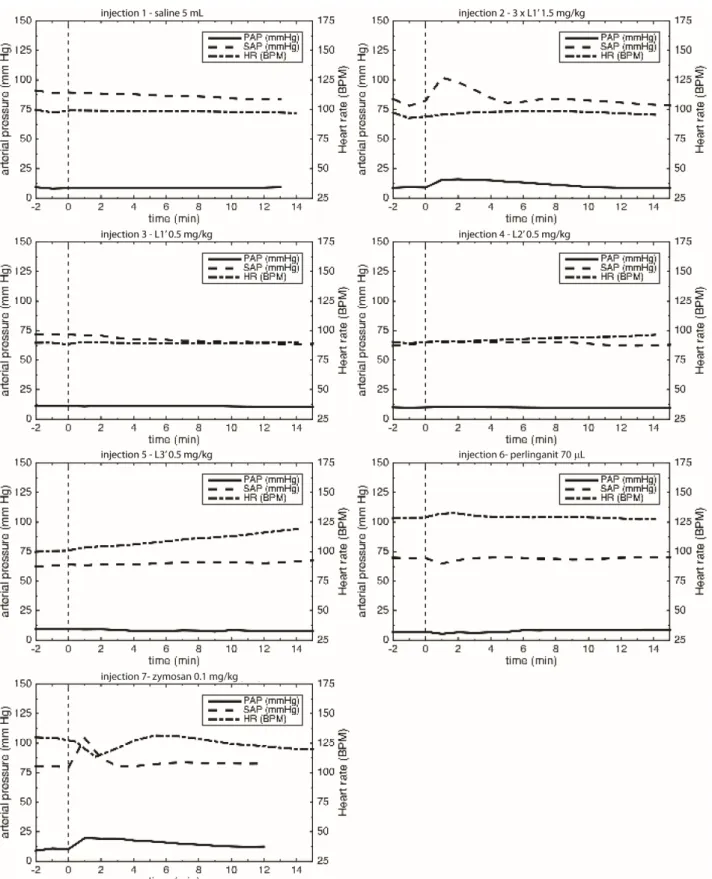
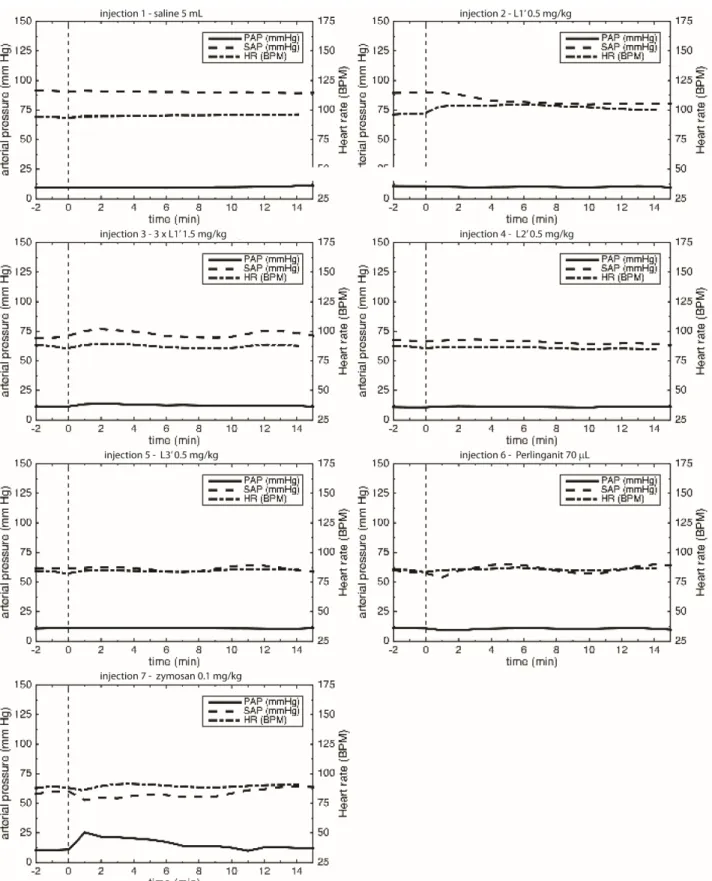
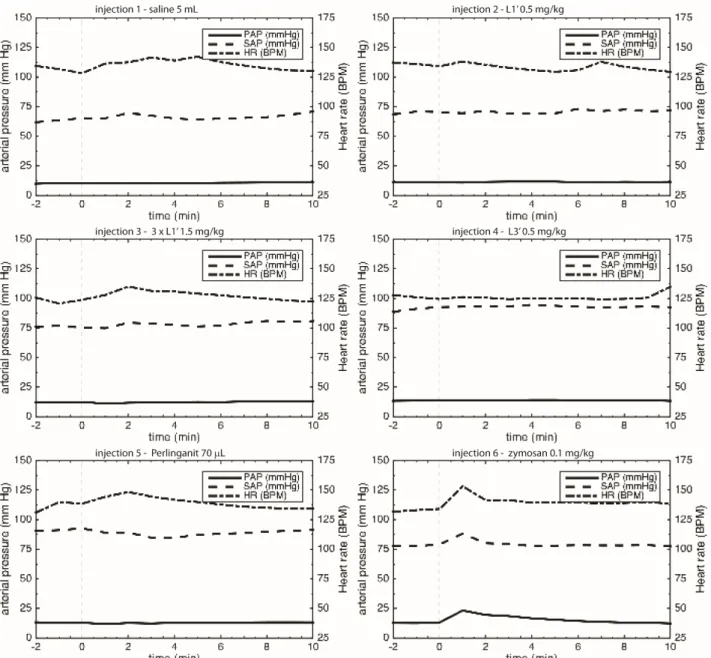
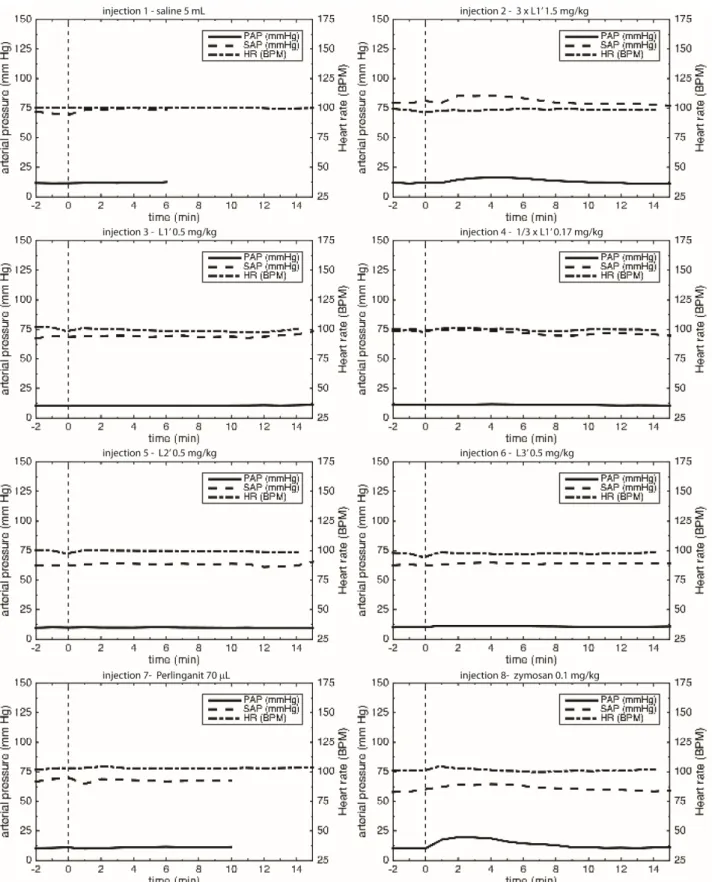
Temporal sequences of liposomal injections in the six pigs, from left to right. L1’ was administrated in three liposomal
concentrations, while L2’ and L3’ in a single concentration. For each injection, the pulmonary arterial pressure, PAP, and systemic arterial pressure, SAP, and heart rate, HR, were recorded and displayed in Figures S3 to S8.
Pig ID
Injection
#1 #2 #3 #4 #5 #6 #7 #8
1 1/3 × L1’ L1’ 3 × L1’ L2’ L3’ Perlinganit zymosan
2 saline 3 × L1’ L2’ L3’ Perlinganit 1/3 × L1’ zymosan
3 saline 3 × L1’ L1’ L2’ L3’ Perlinganit zymosan
4 saline L1’ 3 × L1’ L2’ L3’ Perlinganit zymosan
5 saline L1’ 3 × L1’ L3’ Perlinganit zymosan
Fig. S3. Pig 1 (21 kg male)—Summary: Monitoring of PAP, SAP, and HR changes after injection; dashed line denotes
Fig. S4. Pig 2 (20 kg male)—Summary: Monitoring of PAP, SAP, and HR changes after injection; dashed line denotes
Fig. S5. Pig 3 (22 kg male)—Summary: Monitoring of PAP, SAP, and HR changes after injection; dashed line denotes
Fig. S6. Pig 4 (19 kg male)—Summary: Monitoring of PAP, SAP, and HR changes after injection; dashed line denotes
Fig. S7. Pig 5 (19 kg male)—Summary: Monitoring of PAP, SAP, and HR changes after injection; dashed line denotes
Fig. S8. Pig 6 (24 kg male)—Summary: Monitoring of PAP, SAP, and HR changes after injection; dashed line denotes