Case Studies in DSM: Utilizing the Design Structure Matrix to Improve
New Product Introduction
by Julie W. Go
B.S., Industrial Engineering and Operations Research, University of California at Berkeley (2000) Submitted to the MIT Sloan School of Management and the Engineering Systems Division in
partial fulfillment of the requirements for the degrees of Master of Business Administration
AND
Master of Science in Engineering Systems
In conjunction with the Leaders for Manufacturing Program at the Massachusetts Institute of Technology
June 2007
© Massachusetts Institute of Technology, 2007. All rights reserved.
n
/1
0 A Signature of Author Certified by Certified by_ _ Certified by_ _ Accepted by___ Accepted by MASSACHUSETTS INSTITUTEE ineering Systems Division MIT an School of Management
May 11, 2007
Daniel E. hitney, Thesis S ervisor Senior Research Scientist, Center for Technology, Policy, and - evelopment Senior Lecturer, Engineering Systems Division
(Sar. Beckman, Thesis Supervisor Senior-Lecturer, Haas Schoolff Business
Donald Rosenfield, Thesis Reader Senior Lecturer, Sloan School of Management Director, Leaders for Manufacturing Program
Debbie Berechman, E4cutive Director of the MBA Program MIT Sloan School of Management
ci+ard de Neufville, Professor of Engineering Systems "Clair, Engineering Systems Division Education Committee
Case Studies in DSM: Utilizing the Design Structure Matrix to Improve the New Product Introduction Process
By
Julie Go
Submitted the MIT Sloan School of Management and Department of Engineering Systems on May 11, 2007 In partial fulfillment of the requirements for the degrees of
Master of Business Administration and Master of Science in Engineering Systems
ABSTRACT
This thesis describes a project that applies the Design Structure Matrix (DSM) in support of the Manufacturing Excellence (MX) program at Cisco Systems, Inc to reduce the cycle time of new product development initiatives (NPI). Because they are inherently iterative with interdependent tasks, NPIs are difficult to manage. Two case studies applying the DSM were performed and used to study the inputs and outputs of the process as well as the dependencies between the process steps.
Both case studies indicated that defining product requirements and needs upfront helped to eliminate rework later on in the process. The DSMs also showed that cycle time and standard deviation of cycle time were especially sensitive to interactions between changes in the Bill of Materials (BOM) and other tasks. In fact there was a "tipping point" where reducing the
dependency between tasks could yield significant reductions in cycle time and standard deviation of cycle time.
More significantly, the case studies highlighted the large number of stakeholders involved in the process and revealed the degree to which engineering and manufacturing must work together to
reduce NPI cycle times. In fact, the name "Manufacturing Excellence Initiative in NPI" is a misnomer. New Product Introduction is not just the job of manufacturing but is highly integrated between such groups as marketing, design, and engineering. If the Mx Initiative in NPI is to
fully meet its potential, all of these groups must fully realize this. In addition, there is a need for process infrastructure, data infrastructure, and close examination of incentives.
This thesis thus shows that in order for Cisco's process improvement initiatives to succeed, buy-in from all relevant stakeholders must be won.
Thesis Supervisor: Daniel E. Whitney
Title: Senior Research Scientist, Center for Technology, Policy, and Industrial Development Senior Lecturer, Engineering Systems Division
Thesis Supervisor: Sara L. Beckman
Acknowledgements
This thesis would not have been possible without the support of Cisco Systems, Inc. Raj Saxena provided outstanding guidance and coaching throughout this project. Special thanks to Vah Erdekian and Jim Miller who provided help throughout the project from the Executive level and who continue to be strong supporters of the Cisco/LFM relationship. Several others, including Karen Ashley, Mike Ruddick, Mike Lydon, Mark Cavanaugh, Trina Jahnsen, Brad Warwick, Derrick Kidani, Joe Puyat, Duke Hoang, Jason Stuck, Charu Agarwal, Manny Ocampo, Carl Woodward, Stan Lim, Dave Luck, and Hoang Pham were also valuable resources for me. I was constantly amazed by how open Cisco employees are and how willing they are to help. Thank you for making my seven months at Cisco productive and fun.
I would also like to thank the Leaders for Manufacturing faculty and staff for giving me the incredible opportunity to take part in a program that leaves a sustainable legacy on the world. Thank you for your hard work making this happen year after year.
During the course of my internship and thesis, I had the privilege and honor to work with Dan Whitney and Sara Beckman, my thesis advisors. Thank you for your time and energy during this entire process as well as for constantly challenging my thoughts and logic. You have given me countless new ideas that I will continue to ponder for times to come.
Special thanks to my friends and classmates in the LFM and MIT Sloan Classes of 2007. Without you all, the times never would have seemed so good. Don't stop believin'!
Lastly, thank you to my family. Thank you Mom and Dad for always believing in me and pushing me to succeed, Eddy for giving me the tough advice and setting the bar high, Laurie for your constant optimism and support, and to Nora, thanks for everything else!
Table of Contents
1.0 Introduction ... 10
2.0 Cisco System s History... 11
2.1 M arket Position ... 13
3.0 Cisco's M anufacturing M odel and Business Strategy ... 14
3.1 Focusing on the Core, Outsourcing Context ... 14
3.2 Outsourcing and Clockspeed... 15
3.2.1 Clockspeed and its Implications on Product Developm ent... 15
3.2.2 Capability chains ... 16
3.3.3 Temporary Advantage... 16
4.0 The New Product Introduction Process ... 18
4.1 The NPI Process ... 18
4.2 Product Development Organization Structure ... 20
4.3 The M anufacturing Excellence (M x) Initiative... 23
5.0 The M ethod - The Design Structure M atrix ... 25
5.1 DSM history and applications ... 25
5.2 DSM - The M echanics ... 26
5.3 Other M ethods... 28
5.3.1 Value Stream M apping... 29
5.3.2 Critical Path M ethod ... 29
5.3.3 Theory of Constraints... 29
6.0 DSM Case Study 1: Manufacturing Test Development Process...31
6.1 M anufacturing Test Development Process... 31
6.2 M anufacturing Test Development DSM ... 32
7.0 DSM Case Study 2: The Entire NPI Process ... 39
7.1 Case Study 2: DSM Build ... 39
7.2 Simulation and Sensitivity Analysis... 42
7.2.1 Simulation ... 42
7.2.2 Sensitivity Analysis... 44
7.2.4 A Tipping Point? ... ... ... ... 46
7.3 Limitations of the DSM M odels... 47
8.0 Putting the DSM into practice and use...50
8.1 Organizational Challenges ... 50
8.1.1 The M x NPI Team : Outsider-Insiders... 50
8.2.2 Experience-based organizations versus technocratic ... 51
8.2.3 Relationship between Design and Manufacturing - Social Networks ... 52
9.0 Them es and Lessons from the Case Studies ... 54
9.1 Provide the infrastructure for change ... 54
9.2 Utilize Outsider-Insiders ... 54
10.0 Conclusion ... 59
Appendix A: Manufacturing Test Development Partitioned DSM ... 61
Appendix B: NPI Process Partitioned DSM ... 62
Table of Figures
Figure 1: Cisco growth in employees and revenue ... 12
Figure 2: Cisco's acquisition and revenue growth... 12
Figure 3: Groups involved in the NPI process ... 20
Figure 4: Cisco Organizational Structure... 21
Figure 5: Central Development Organization ... 21
Figure 6: Product Operations Structure... 22
Figure 7: Simple DSM Example ... 27
Figure 8: Banded Matrix ... 28
Figure 9: Partitioned Matrix... 28
Figure 10: Block 1, understand test requirements ... 34
Figure 11: Block 2, Plan and Budget ... 35
Figure 12: Block 3, Write test scripts... 36
Figure 13: Block 4, Utilize scripts in a build ... 37
Figure 14: Block representing prototyping ... 41
Figure 15: Original Matrix ... 43
Figure 16: Probability rework matrix... 43
Figure 17: Rework impact matrix ... 44
Figure 18: Sample output sensitivity analysis ... 45
Figure 19: Pareto analysis of sensitivity to probability of rework ... 46
Figure 20: A Tipping Point, sensitivity of mean cycle time ... 47
Figure 21: A Tipping Point, sensitivity of standard deviation ... 47
Figure 22: Effects of Over commitment... 48
1.0 Introduction
The product development process is difficult to predict as it involves many
interconnected decision-making activities that are performed both by individuals and by groups. The output of product development activities is also variable; in many cases the output is information that can change given other pieces of information. This causes the process to be highly iterative with tasks or entire groups of tasks redone. Therefore, structure is needed to understand how to schedule tasks and product launches.
As Eppinger (2001)' points out, while information exchange and iteration allows for experimentation and innovation, excessive iterations are counter productive. Therefore, innovation and iterations must be carefully planned and managed.
This thesis describes a project undertaken at Cisco Systems as part of an effort to
understand and improve its product development process, specifically reducing the time that it takes to launch a new product.
This thesis begins with history of Cisco System and its current market position. It goes on to describe Cisco's manufacturing model and strategy, including the New Product Introduction (NPI) process and the organizational structure. Then, the Design Structure Matrix (DSM) methodology is explained as well as and how the DSM is useful to understand and study Cisco's process. The thesis then applies the DSM methodology in two different cases using various features of the DSM tool. The goal of these case studies is first to highlight cycle time improvement activities within the NPI process and then to show the importance of the organizational structure in process improvement. Themes and learning from the case studies are then examined within the context of the organizational structure. Finally, recommendations are given to address the learning from the DSM.
The next chapter provides information on how Cisco grew up as well as its current position in the market today.
2.0 Cisco Systems History
This Chapter addresses the history of Cisco Systems as well as its position in the market. This is important to understand because its position in the market affects how tools such as the DSM can help Cisco. Cisco Systems is an industry leader in telecommunications equipment and services. After tremendous growth in employees, revenue and stock price through the 1990s, Cisco experienced a period of significantly less growth. Now,
Cisco is experiencing a second period of tremendous growth. This growth will be fueled by the new products getting to market.
Cisco was founded in 1984 by a group of computer scientists from Stanford University and went public in 1990. Today, there are over 50,000 employees worldwide.
Throughout its life, Cisco has been an active acquirer of and investor in innovative startups, acquiring 108 companies since 1993. However, organic development is still a large part of Cisco's culture with over $3.22 Billion spent on R&D in Fiscal Year 2005. At the end of FY07 Quarter 1, Cisco had over $8 Billion in revenues. Figure 1 shows
Cisco's growth throughout the 1990s, falling with the market downturn in 2002 and growing for the past four years. Figure 2 represents Cisco's acquisitions and revenue growth. Cisco steadily acquired companies throughout the 1990s and even though it acquired fewer companies during the downturn, it remains an active acquirer.
Figure 1: Cisco growth in employees and revenue 30000 25000 20000 15000 10000 5000 0 1993 1994 1995 1996199719981999200020012002200320042005
Year Sara L. Beckman
Figure 2: Cisco's acquisition and revenue growth
45000 4000011111 P1111 IC-11WO 35000 30000 25000 -+- Employees Revenue (millions) 20000 15000 10000 -500000 1980 1985 1990 1995 2000 2005 2010
Year Sara L. Beckman
I Revenue (millions) - Acquisitions 25 20 15 * 10 5 0
2.1 Market Position
Cisco is one of the leading suppliers of network switches and routers in the
telecommunications industry. In 2005, the company had a market share of about 70% and 73% in the internet switches and routers segments, respectively. In 2004, Cisco's revenue was more than the combined revenue of its main competitors, which include Avaya, Juniper and Nortel Networks. Other major competitors are 3Com, Alcatel, Avaya, D-Link Corporation, Dell, Fujitsu, HP, Lucent Technologies, Nokia, Nortel Networks and Siemens, among others. Cisco is playing in several different markets, and some of these competitors are only in a few of those markets.
Currently, the company has more than 200 offices in around 60 countries worldwide. In addition, the company has a stable financial position. Its cash flow from operations increased from $7.0 billion in fiscal 2004 to $7.6 billion in fiscal 2005. Currently, the company has zero bad debts. To date, Cisco has been successful in aligning its business with the new market opportunities, and continues to gain share in new and established markets. Because of its dominant position in the market, Cisco has significant
competitive advantages including economies of scale, a broad product portfolio, a large customer and installed base and large research and development resources.
In this section, we explored Cisco's current situation and concluded that while they have a storied young history and are currently in an enviable position, there is still work that needs to be done to maintain this position. In the next section, we look more closely at Cisco's manufacturing strategy and how it fits in with the overall business strategy.
3.0 Cisco's Manufacturing Model and Business Strategy
This chapter explores several concepts that relate to outsourcing and competitivedynamics in order to have a frame of reference with which to study Cisco.
3.1 Focusing on the Core, Outsourcing Context
This section covers the idea of core and context and how it pertains to the Cisco's outsourced model of manufacturing.
Most of Cisco's products are manufactured by outside contract manufacturers. This is driven by the idea of "core" and "context" activities. According to author Geoffrey Moore, the word "core" is what distinctively differentiates you in the eyes of the customer. By focusing on the core, a company puts as much human and financial capital behind processes that have this impact. Everything outside of this is defined as "context." This is not to say that context is not extremely important to the success of the company. If a firm fails to fulfill a context task, it could easily lose a customer, be out of compliance with regulation or law, or alienate an employee, a partner, or the
community at large.2 At Cisco, much of the direct manufacturing and assembly work is
considered to be "context," while activities such as managing the supply chain and design engineering are considered "core." The idea is to work closely with partners and
support them where needed.
As Cisco CEO John Chambers expressed, "...Moore asserts-and I agree-that by focusing on what is core in your business, outsourcing context activities, and leveraging your competitive advantage, your company can achieve maximum shareholder value.
And in this (or any) economic environment, managing for shareholder value is critical for success."3
Similarly, Fine and Whitney (1996)4 argue that companies should retain not only those skills directly involving product or process but also those skills that support the very process of choosing which skills to retain.
3.2 Outsourcing and Clockspeed
In the past several decades, outsourcing has transformed from transactional partnerships to more collaborative partnerships. Understanding what and when deciding what and when to outsource is an important decision for any firm. A few concepts are useful to use as a lens in which to think about firm resources and capabilities and when to outsource. These are explained in the next sections.
3.2.1 Clockspeed and its Implications on Product Development In Charles Fine's book Clockspeed,' he defines Clockspeed as the rate at which an industry evolves. This industry Clockspeed is based partially on the product, process, and organizational Clockspeed. An example of a fast Clockspeed industry would be the motion picture industry where movies could have lives measured in weeks or days. On the other end of the spectrum is the airline industry with its Clockspeed in the decades or even more.
There are two main drivers of Clockspeed: technological innovation and competitive pressure. In a situation with high innovation and pressure, there tends to be the fastest Clockspeed. This makes sense; in an industry such as semiconductor manufacturing, there is both high innovation and high competition and firms have been following Moore's Law for the past four decades.
A firm such as Cisco is considered to have a fast Clockspeed with changes in the
telecommunications industry happening at rapid rates. In industries like this, firms have more opportunities to disrupt the industry and gain advantage. Therefore, it is even more important to make rapid decisions.
Because Cisco outsources its manufacturing, the supply chain complexity is even higher. Coordination in the supply chain design is crucial and development of the capability has very direct effects on the speed of its product development process.
3.2.2 Capability chains
One central theme in Clockspeed is the idea of a capability chain. The idea is that no capability exists in a vacuum and that the linkage between capabilities is where value lies. Analogously to a mechanical system, a chain is only as strong as its weakest link. In fact "no capability is more critical than that of superior design of one's capability chain - from the final consumer all the way upstream to the sources of raw materials and new technological concepts." 6
Firms must understand the importance of building robust capability chains as well as having mechanisms for understanding of their capabilities. In an outsourced model of operation such as Cisco's, capabilities must include those of its contract manufacturing partners and the mechanisms by which the firms' capabilities are linked.
Fine also makes the case that no advantage is forever. Even though Cisco is currently dominant in the market, this can quickly change.
3.3.3 Temporary Advantage
Applying the Clockspeed logic, firms can only hold temporary advantages, and the faster the Clockspeed, the faster advantages turn over. Cisco must continue to evolve in order to maintain this position. Fine cites such examples as the IBM of the 1970s and the General Motors of the 1950s and 1960s as examples of firms that once seemed unassailable but needed to adjust in the face of temporary advantage. Another example is photolithography and how the dominant firm has changed with each new generation of product technology.
Similarly, Teece, Pisano, and Shuen (1997)7 argue that firms develop and sustain competitive advantage through development of dynamic capabilities -the ability to adapt competences to changing market conditions and the ability to rearrange skills, resources, and functional competences to match the changing market.
In summary, Cisco is a company in a high Clockspeed industry, meaning technological innovation and competitive pressure is high. Because of this, their competitive
advantage may be even more temporary and tenuous. Further, because Cisco utilizes an outsourced model of production, not only are Cisco's and their contract manufacturer's individual capabilities important, the link between their capabilities is also important. Therefore, even though there can be organizational inertia that prevents a firm from moving forward, it is important for the managers to keep doing something to stay ahead.
4.0 The New Product Introduction Process
In Chapters 1-3, Cisco's history, current market position, and manufacturing strategy were discussed. This section looks more deeply at the NPI process including its process steps and the organizational structure surrounding it. The Manufacturing Excellence (Mx) Initiative in NPI and its role will also be explained. In Chapters 6 and 7, case studies focused specifically on the NPI process will be performed.
4.1 The NPI Process
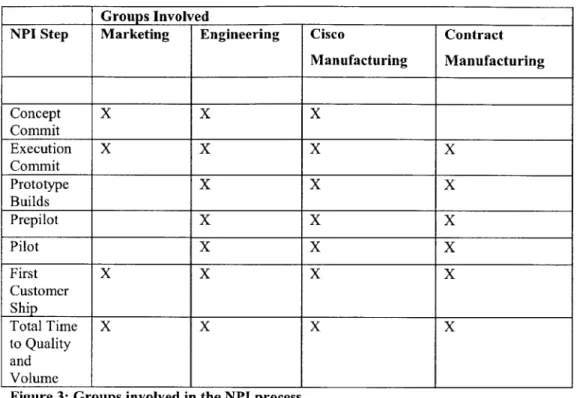
Cisco's NPI process is structured in a Phase-Gate Model. There are seven gates:
Concept Commit, Execution Commit, Prototype Builds, Pre-Pilot, Pilot, First Customer Ship, and Total Time to Quality and Volume, At each gate, there is a review with the major stakeholders and the project must meet certain criteria to pass.
Concept Commit is an event where marketing product management presents a
conceptual draft of customer requirements to engineering for new product development or existing product enhancement in the form of a Product Requirements Document (PRD). Concept Commit can be done in one-on-one settings or as a cross-functional meeting with representatives from marketing, engineering, manufacturing, and customer advocacy present. Marketing usually drives the Concept Commit.
The next step is Execution Commit. This is where the senior level, cross-functional management team and product teams agree to allocate resources and fund the
development as described by the Program plan and the System Functional Specification. The System Functional Spec is the engineering of the requirements specified in the PRD. The New Product Program Manager is responsible for completing the Initial Manufacturing Plan for Execution Commit.
After Execution Commit, design is done along with Bill of Materials (BOM) risk analysis and supply chain definition. Many products are derivative products that build
on existing designs. However, the phase-gate process is the same for both derivative and brand new products.
Once designs have passed design for manufacturing guidelines, prototypes are built. This is the longest part of the process. Cisco manufacturing works with the CMs to start prototyping the products. Each prototype is sent back to Cisco for testing and design changes. Typically, several iterations are done before a product is ready for Prepilot.
Prepilot is the last prototype build before a product is readied for launch and is meant to test the new products through final production processes to reduce risk at Pilot. This is the last chance to work out the kinks before Pilot, the first production build.
If all goes well during the Pilot and there are waiting customers, the first product is shipped (First Customer Ship). After FCS, the product is ramped; the product passes through the Total Time to Quality and Volume (TTQV) gate. At this point, the product is no longer considered NPI and is passed to the Manufacturing Operations team for full production.
Within the NPI process, many of the steps require tight coordination between both smaller groups and larger organizations. Because manufacturing is outsourced, this coordination is necessary between companies as well as within companies. As a result, the attitude toward contract manufacturers tends to be that of "partners" rather than
Groups Involved_
NPI Step Marketing Engineering Cisco Contract
Manufacturing Manufacturing Concept X X X Commit Execution X X X X Commit Prototype X X X Builds Prepilot X X X Pilot X X X First X X X X Customer Ship Total Time X X X X to Quality and Volume
Figure 3: Groups involved in the NPI process
4.2 Product Development Organization Structure
In any product development, the organizational structure plays a large role in how work
gets done and how it is coordinated. This section details the roles of the main players in
new product development.
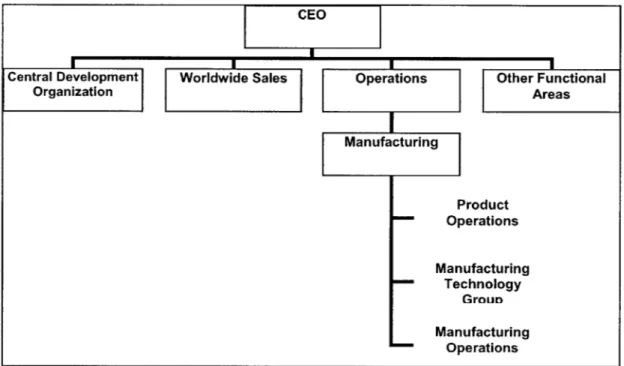
Cisco's organizational structure is a classic functional organizational structure. At the
senior executive level are Operations, Sales, Development, and functional areas such as Finance. Manufacturing sits inside the Operations organization. Figure 4 shows a general organization chart for Cisco.
CEO
Central Development Organization
Worldwide Sales Operations Other Functional
Areas Manufacturing Product Operations Manufacturing Technology Groun Manufacturing Operations Figure 4: Cisco Organizational Structure
Within the Central Development Organization (CDO), over 30 Business Units (BU) are responsible for the design and marketing of products. BUs are organized according to product family. Within design, there are both software and hardware functions. Figure
5 shows how the CDO is organized.
Figure 5: Central Development Organization
Central Development
Organization
Business Unit A Business Unit B Business Unit C Business Unit D*
Markieting
Over3O Business Units in al
HW Design SW Design Design Tes rogram
17Developmen
anageent
BUs. For example, each Product Operations group will interface with a specific BU on its products. This allows for the BUs to have a single point of contact within
manufacturing.
There are several key manufacturing roles on the NPI team and they are explained below. Figure 6 shows how they are organized within the Product Operations Group
Product Operations Group (partnered with
Business Unit A)
Program Management Manufacturing Test New Product Supply Base
Engineering Introduction Engineering
Engineering
Figure 6: Product Operations Structure
The New Product Program Manager (NPPM) is Manufacturing's representative to the Business Unit and on the Engineering Product Team. The NPPM leads the NPI team
ensuring that all necessary representatives are included and all tasks are completed. This includes setting up the meeting times for the team, setting the agenda, and performs follow up on problems.
New Product Introduction Engineer (NPIE) owns interaction with Engineering to ensure the technical manufacturability of the product. This includes mitigation of assembly risks, BOM risks, technology risks, and design for manufacturing. The NPIE also works closely with the materials organization to make sure the parts are on order.
The Manufacturing Test Engineer works with the BU test engineering to write test scripts that automate the testing process in manufacturing. They typically take software diagnostics and automate them. They are also required to be in close communication with the diagnostics engineers in the event of bugs or other issues that need to be resolved. They are also in communication with the test engineers who work for the contract manufacturer
The Supply Base Engineer (SBE) owns the ongoing process assessment, process development and process capability feedback associated with the Contract Manufacturers. SBEs work closely with the suppliers to perform assembly and
inspection qualifications, communicate related Design for "x" issues, manage documentation needs and monitor yields and drive improvements.
Outside of the Product Operations team, there are other players within manufacturing who have important roles. Within the Commodities group, the NPI Buyer/Planners are responsible for mitigating BOM risk sourcing issues and managing the supply chain partners during the proto build and pilot process. A member of the Demand Planning
organization, the Demand Planning Manager is responsible for setting up Oracle so that demand can be placed against the product and then for loading the production demand based on forecasts from the Business Unit.
The BU obviously also has many players involved in the process including a BU
program manager, HW Design Engineers, Development Test Engineers, and SW Design Engineers. Manufacturing integrates tightly with them during the design and
manufacturing process. Even though some members of the Business Units were interviewed during the course of this project, efforts of the Mx initiative were much more focused on manufacturing. Through this project however, it was found that
collaboration and partnership with the design organization in the process improvement is critical.
The Contract Manufacturer (CM) is responsible for the actual assembly of product and shipping it to customers. During the NPI stage, the CM builds all prototypes and partners with Cisco in the development of the process.
4.3 The Manufacturing Excellence (Mx) Initiative
class process, product, and leadership excellence, such that Cisco is the undisputed leader in supply chain management, guaranteeing Cisco's sustained innovation and competitive advantage. New Product Introduction (NPI) is one of 6 Focus Areas within Mx and aspires to develop best-in-class processes and capabilities for introducing new products to the market. These initiatives are manufacturing-centric. Some pull in
members of various engineering teams but this is ad hoc. The engineering teams have a process improvement team that works loosely with the Mx NPI team but they do not have formal channels in which to partner.
The Mx NPI initiative is divided into four tracks or sub-initiatives, under which 8 projects were created. Each project is staffed with a Program Manager, a Technical Leader, and subject matter experts (SME) from across Cisco's organization. The
DMAIC Process is being used as a framework for all process improvements, and there is a Master Black Belt to facilitate and coach the teams on the process. This project was associated with the Mx NPI initiative to reduce cycle time between Concept Commit and Total Time to Quality and Volume.
Mx is using a DMAIC framework that is being deployed along with targeted six sigma black belts and master black belts being utilized in specific areas. The Mx NPI area has a master black belt and 2 black belts supporting this effort, all of whom are relatively new to the company.
In this chapter, the NPI process at Cisco was described as a phase gate model. Many of the different players in the organization were explained as well. Cisco's NPI process has a large number of players who reside in various groups and organizations. In
addition, as new products move through the NPI phases, various groups become more or less involved. In the next chapter, the Design Structure Matrix will be explained along with how it can be used to learn more about and improve the NPI process. In the two chapters following that, two case studies will be used to demonstrate how the DSM was used to reduce cycle time in the NPI process.
5.0 The Method
-The Design Structure Matrix
The Design Structure Matrix (DSM) offers a method to figure out the tasks necessary to complete a project and also which tasks depend on which tasks. In this project, the DSM was used to understand the new product development process at Cisco.
The NPI process at Cisco is generally understood to be a series of interdependent tasks. However, the DSM gives a simple framework to clearly map what those tasks are and how their relationships affect the whole process. In this chapter, the history and applications of the DSM are detailed as well as the mechanics of how the DSM works. In Chapters 6 and 7, the DSM is used in two case studies.
Also included in this chapter are short explanations of alternate methods.
5.1 DSM history and applications
There are four types of DSM models: component based, parameter based, activity based, and team based. In a team based DSM, organizational analysis and design based on information flow among various organizational entities. Individuals and groups participating in a project are the elements being analyzed. A component-based DSM documents interactions between elements in complex system architecture. Parameter-based DSM captures dependencies between decisions on design parameters. The DSM used in this project is an activity based DSM which focuses on input/output relationships of tasks.
In the literature, there have been several applications in the DSM. Many of these ideas rely heavily on the work of Whitney and Eppinger, et al. First, the DSM gives the ability to visualize the complex system and manage iteration formally. For example, decoupling of tasks can ultimately speed up the product development process by cutting out steps and iteration. However, there is a tradeoff between speed and the level of innovation; less iteration can result in a suboptimal product by not taking advantage of the information exchange. Therefore, firms must make strategic decisions about which
Second, the DSM can give insights into restructuring the organization. In an example, Eppinger (2001) uses the DSM to improve communication across product development teams at an automobile manufacturer. The result was to reorganize its 4 product
development teams into 4 overlapping teams with an additional systems integration team as a structural mechanism to ensure overall work.
Another useful application is linking product design and organizational design. Many studies have used the DSM to study product design or organizational design. However,
Sosa, et al (2004),8 integrates product architectural knowledge with the organizational design of product development teams. They show through DSM analysis that the likelihood of misalignment is greater across organizational and system boundaries and that indirect interactions are an important coordination mechanism within boundaries.
The DSM also highlights areas of improvement in both complex and simple situations. In Eppinger (2001),9 the DSM was applied to the extremely complex process of
semiconductor manufacturing. He found that most of the major steps had many iterative steps including a significant number of unplanned iterations. For example, a poor outcome on a manufacturing test could result in an entire product redesign. The value of DSM to the organization lies in pointing out these unplanned iterations and giving the firm an opportunity to change the process in order to mitigate or eliminate this iteration. A case study to be described later on in this thesis is an example of a simple DSM.
5.2 DSM- The Mechanics
This section explains the mechanics to the DSM. Later on, these steps are used in two case studies. The following are the steps to develop an activity based Design Structure Matrix
1) Define the system and the scope 2) List all system elements
3) Study information flow between systems elements and build a matrix to represent information flow between the elements
4) Validate matrix with subject matter experts
5) Partition the matrix
6) Use optimized matrix to make recommendations
Note that the steps 2-4 can be iterative with changes being made as more subject matter experts lend their thoughts to the DSM.
Task relationships based on informational dependencies as parallel (no information flow), sequential (A feeds information to B) and coupled (A and B are mutually
dependent on each other for information). In the example in Figure 7, all tasks are listed on both the vertical and horizontal axes. The vertical axis receives information while the horizontal axis provides information. The presence of a "1" in the box means that there is a dependency between two tasks. In this example, "A" provides information to "B". Any dependency marks above the diagonal signify feedback where a step relies on information that occurs after it is first performed. The dependency between steps "C" and "A" is an example of this. "C" provides information to "A" but "A" is performed before "C." This means that under these conditions, "C" could cause rework of "A."
XD Providing Information CD (D. Name A B C D E F G B1 C1 0 D E1 F
Figure 7: Simple DSM Example
Once a DSM is created, there are software macros available to partition and band the matrix. To band the matrix means to separate the tasks steps into "chunks" that can be done concurrently. The macros also reorder the tasks into optimal order. Figure 8 represents the matrix from Figure 7 in a banded form. For example, in Figure 8, tasks B,
2.
(0
Providina Information
1 NmA I A I P I r I n i F I F I G I
Figure 8: Banded Matrix
In Figure 9 below, the matrix is partitioned into "blocks." The DSM does not have to be banded before it is partitioned. These blocks represent a section of the process that loops back on itself.
Providing Information M Name A B C E F G D C1 E 3 F G1 1 1 0
Figure 9: Partitioned Matrix
The DSM provides a tool for easily seeing interdependencies between tasks as well as beginning to think about the how tight the coupling of tasks is.
In addition to using the tool, the process of creating the matrix can also bring insights to a larger number of stakeholders. Much of the value-add can come from gathering the data from stakeholders and raising the awareness of task and group interdependencies.
5.3 Other Methods
The DSM is not the only method that could be used to study the NPI process. In fact, several other methods or combinations of methods could have been used and are discussed below. Practically speaking, many of these tools are quite useful and should
be considered in product development. DSM was chosen over these tools because it is very simple and intuitive way to study dependencies.
5.3.1 Value Stream Mapping
Value Stream Mapping provides a template for determining the steps that a product goes through during the process. It also provides for determining the inputs and outputs of the different steps. Using the Value Stream Map (VSM), the user can also see the where waste occurs. The VSM also provides a coherent and intuitive device for users to
understand the process. Like the DSM, it also hinges on many users coming together to gather the data and inputs and can also be used for process simulation. With a VSM however, the tendency can go towards creating a linear path - while it is possible to utilize it to look at interlinked steps, the map can become quite messy.
5.3.2 Critical Path Method
Like DSM, the Critical Path Method (CPM) lists all tasks required to complete the project, records the duration of each task and also the dependencies between the tasks. Using these values, CPM calculates the start and end times for each task and determines which activities are on the critical path. The critical path is the sequence of tasks that determine the shortest time possible to complete the project. Put another way, any delay of an activity on the critical path directly impacts the planned project completion date. A project can have several parallel critical paths.
5.3.3 Theory of Constraints
According to the Theory of Constraints (TOC), any system has a constraint or a bottleneck and these constraints determine the performance of the system. There are 5
Thinking Steps in TOC:
1. Identify the bottleneck or constraint.
4. Increase capacity of the constraint if required.
5. If the constraint has now moved, repeat steps 1-4.
In this chapter, the basics of DSM were explained and several alternate methods were discussed. In Chapters 6 and 7, this knowledge is applied to a case study.
6.0 DSM Case Study 1: Manufacturing Test
Development Process
This section explores the first case study using the DSM at Cisco. In the case study, the steps to build a DSM are used and applied.
6.1 Manufacturing Test Development Process
This case study is intended as a way to show Cisco a simple tool that highlights the interdependencies and connectedness of its NPI process steps. The Manufacturing Test Development Process was chosen because it requires a cross section of several groups including the contract manufacturer, the engineering organization, and several areas of Cisco manufacturing. Also, because the test case development process is a manageable chunk of the process, there is the ability to clearly validate the process and learning.
Manufacturing tests are conducted on the manufacturing line at the contract manufacturer but are developed by Cisco engineers in manufacturing and design. Occasionally, design errors are found during these tests.
Manufacturing test development begins after Execution Commit and must be completed for Pilot. Software Diagnostic engineers write diagnostics (diags) to test functionality of the product. This occurs for both the system and for components. A Manufacturing Test Engineer (TE) will take these diags and automate them by writing scripts. Because one key piece of software development is finding and correcting bugs, the
manufacturing test development process can be a very iterative one. During the Pre-pilot stage, the test scripts are released to the contract manufacturer and bugs can emerge here as well. This creates another area where iteration comes about during this process.
Since each of Cisco's business units follows a slightly different process, one business unit was chosen to be the case study. The Internet Systems Business Unit (ISBU) was
significant percentage of Cisco's revenue. Because of this, even a small improvement could have far reaching impacts.
6.2 Manufacturing Test Development DSM
In this section, the DSM steps described in Chapter 4 are applied in a case study about Manufacturing Test Development.
Step 1: Define the system and the scope
For our case study, the test development process was chosen as a manageable chunk of the process. In addition, the process is centered in the manufacturing organization (specifically manufacturing test) but requires inputs from several other organizations including marketing, engineering, and the contract manufacturer. Even though the process occurs during many other process steps, only those with information or inputs related to manufacturing test development are used in the DSM.
Step 2: List the system elements
The system elements were determined first by a rough cut based on specs and other documentation. Several subject matter experts including software diagnostic engineers, manufacturing test engineers, hardware engineers, new product program managers, and supply base engineers were assembled to refine the system elements. This step was revisited during Step 3 and Step 4 as more subject matter experts were engaged.
Step 3: Study information flow between systems elements and build a matrix to represent information flow between the elements
The dependency marks were placed first by rough cut based on specs and other documentation. This rough draft was given to subject matter experts to refine the dependency marks as well as change system elements where necessary.
Step 4: Validate matrix with additional subject matter experts
This step utilizes a larger population of subject matter experts in a series of one on one meetings. These were mainly manufacturing test engineers and others who were
intimately involved in the test process. When there were disagreements, the majority opinion was placed in the model. This including tweaking the system elements by adding and subtracting rows and columns as well as adjusting marks.
Step 5: Partition the matrix
This step involves running the DSM software to optimize the system. The software program reorders the task steps in order to decrease rework. It also localizes rework loops into blocks.
A high level view of the entire partitioned model can be found in Appendix A.
It became clear from the DSM that we can articulate the test development process as four main "blocks" that consist of task steps that are interdependent.
1) understand requirements 2) plan and budget
3) write test scripts
4) utilize scripts in a build
Understanding these four main steps was useful in being able to break down the process to find areas for improvement. Next, these four blocks and the learning from them are
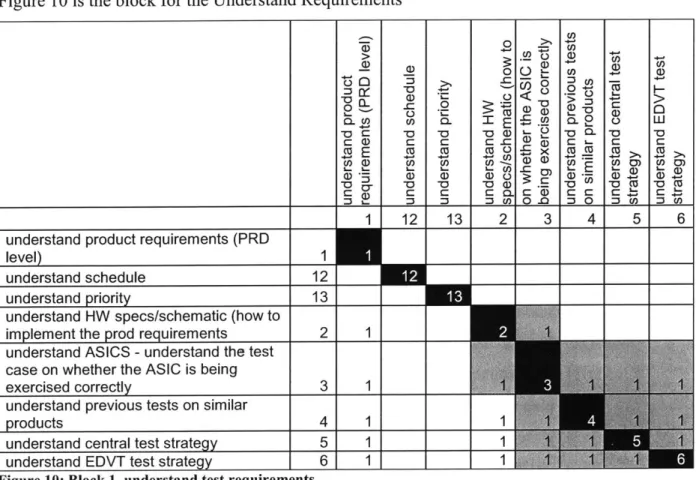
Understand Reciuirements
Figure 10 is the block for the Understand Requirements
0 >- Cl O 2: ) Q C L. F -L C 0 0n A.- 1 E M 0, -CflU U C ClU ) C -dr- Cl )
-0- 1- -W VU); -V a)U (DU
Cn ) U) C n C/__________ c
_ r-. f 0) En EU 120 QU) E 0))
understand product requirements (PRD
level) 1
understand schedule understand priority
understand HW specs/schematic (how to implement the prod requirements
12 I 12 1 13 1 1 2 1 13 2 3 4 5
I
__I
__ __I
__I
__understand ASICS - understand the test case on whether the ASIC is being
exercised correctly 3 1
understand previous tests on similar
products 4 1
understand central test strategy 5 1 1
understand EDVT test strategy 1_6 1 1
Figure 10: Block 1, understand test requirements
This block shows how the various test strategies are interlinked and the importance of understanding this upfront. It also showed how many different test groups there are and how coordination between the various groups could cut out rework time and effort later
in the process.
Plan and Budget
The block shown in Figure 11 shows the interactions between the various test plans and the budget. Overall, there were no surprises here for the team.
communication test plan budgeting for
write test needs of diags review and new
anfor mfg test approval equipment
8 9 10 14.
write test plan 8
communicate needs for diags to
mfg test 9
test plan review
and approval 10
budgeting for new
equipment 14
Write Test Scripts
Figure 12, below, is the block that shows the process for writing test scripts.
mC U) m E o M *M * m m 5 *o E Cnoe @*~ -.U)-,. - 'ea 3m a 3-.0 0 a - c -) .c C -. a 4) o. .0 receive 7" boards1 write diags 1 test functionality of board 1 understand diag readiness 2 write scripts 2 find and report issues with diags 2 diag eng works on bugs 2 diag eng write and test new dias 2 understand new diag features 2 TE tweaks based on changes 2 design and layout boards 2
Figure 12: Block 3, Write test scripts
This block is the "meat" of the Test Development process and it was also where most of the interaction with the Business Unit occurs. This block showed the Test Engineering (TE) team how interconnected the Software Diagnostic and Test Engineering teams are. While this was known generally, the block clearly demonstrated how both teams
Utilize Scripts in a Build
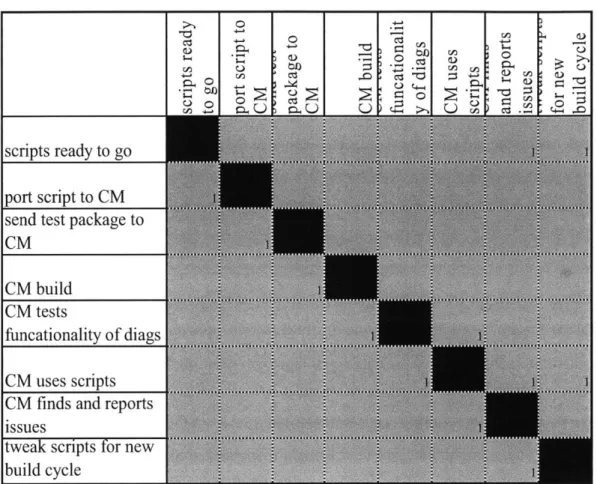
Figure 13, below, represents the fourth block, where the scripts are ported to the Contract Manufacturers and utilized in a build.
scripts ready to go port script to CM send test package to
CM4
Cl cl 4
cures scriptsa b
ptscriparst to thMadue.WeMteC id susorbg nteporm
CMpts
Cbuilde
FPgues th ost scripts Utilth in uilt
Th is an reprets tepitwe h Mcmsit h itr.Hrets
tkscripts re sn oteCMadse.WethCMfdsiseorbginhepgam
iteration occurs. This was an obvious point to the Test Engineering group.
Step 6: Use optimized matrix to recommend improvements
Perhaps the most difficult task in utilizing the DSM is "selling" the results. In the case of test development at Cisco, the DSM results were validated by the subject matter experts. It also brought to light the blocks within the process - something that the experts inherently knew but did not fully consider until seeing the model. Subject
conversation around what truly happens during the process. In this case, this occurred and both the people doing the work as well as the managers were able to leam more about the process. While this discovery is quite common in many companies, it is still important to highlight as an issue.
This chapter walked through a case study of developing and using a DSM for the Manufacturing Test Development process. In the course of the case study, both management and the subject matter experts were able to take a step back and look at their process more objectively. There were two main takeaways. First, defining
customer and product requirements was a necessary first step that could derail the entire process if not done thoroughly. Second, the Manufacturing Test and Software
Diagnostics teams also came to realize how interconnected the Manufacturing Test Engineering, Hardware Design Engineering, and Diagnostics Engineering teams are. It was valuable insight to begin to start looking at how these groups could work more closely in order to improve both the speed and quality of the process.
For example, the Manufacturing Test Engineering group used the DSM model as
leverage to try to convince their partners in engineering and marketing to engage early in order to avoid rework later in the process.
7.0 DSM Case Study 2: The Entire NPI Process
During the first case study, several subject matter experts expressed the sub-optimality of addressing just one portion of the process. Therefore, a second case study was used to study the entire NPI process. This DSM represents the process extending from
Concept Commit to Total Time to Quality and Volume. This DSM better illustrates the linkages between all groups involved in the process and helps the users to understand the capability chains that Cisco needs in order to be successful in its new product
development.
This case study follows the same steps as outlined in Chapter 5 and that were used in the previous case study. In addition, for this case study, simulation and sensitivity analysis
features of the DSM were applied.
7.1 Case Study 2: DSM Build
Step 1: Define the System and the scope
In this example, the NPI process from Concept Commit to Total Time to Quality and Volume is studied. Since the various Business Units do things differently, this case study is limited to the Internet Systems Business Unit. Later on, this model can be modified to study other Business Units.
Step 2: List the System Elements
In the first case study, one of the difficulties was decoupling the test development activities from those that did not affect test. In this case study, the difficulty was in figuring out the proper level of detail in which to represent the process. As a result, the task steps in this case study are more general than those in the previous one. The processes of finding the appropriate system elements required several iterations to make
Step 3: Study information flow between system elements and build a matrix to represent information flow between the elements
Determining the dependency marks was a process that required a several rounds of back and forth. A small subsection of New Product Program Managers (NPPM), New
Product Introduction Engineers (NPIE), Supply Base Engineers (SBE), Test Engineers (TE), and members of the Manufacturing Excellence (Mx) team were utilized to determine the dependency marks.
Step 4: Validate matrix with additional subject matter experts
A larger group of NPPMs, SBEs, NPIEs, and TEs were utilized for validate the matrix. This process also required a great deal of clarifying the steps and dependency marks.
Step 5: Partition the matrix
A full partitioned matrix is available in Appendix B. When the analysis was run, one large block was discovered. This was the prototype stage, shown in Figure 14.
0~ 0 = 0 00c ortoaloctinU DFMfeebak pCU s) a cc m- 6) )0 C: 0 CU= 0 sytCD sp0t 0 b) st m 10 6 n .2 0 EDVT 0 p r0 0 2 MDVT - 22 -prUot. cc CU CU C O o0 -0 Cc- CD 0 0 0 -2 > H CL -I pdu eq u rem 2 CM allocatio 23 rirng 34poo CAD 39 w=r Dfu eeackpe 4 DFM pebc prti 449 vadocn handgresu 10 schematic 11 diallreain 12
Figure 14: Block representing prototyping
Step 6: Use optimized matrix to recommend improvements
The matrix clearly shows that the largest contrnbutor to NPI cycle time is the prototype stage. This conclusion is also supported by empirical evidence. One key finding is that some of the early tasks, including nailing down product requirements, provide inputs to many other crucial steps such as BOM changes. This shows the importance of doing the due diligence in the beginning of the process to reduce the need for rework later on. This is a common theme from the first case study.
has highlighted it as a clear issue and the model can be used to gain leverage on the BUs to at least start studying the process and beginning to understand why it takes so long to get through the prototype stage.
The DSM also demonstrates that the Mx team must make connections outside
manufacturing into the CMs and BUs in order to drive the most change. This is not a new finding to the Mx team knows this. However, in its process improvement activities, the Mx team relied on the New Product Program Managers, New Product Introduction Engineers, and other members of the Product Operations group to gather inputs from the Business Units and act as "ambassadors" for the process improvement work. Since the Product Operations groups already had working relationships with the Business Units, this seemed like a good idea. However, this was not enough to gain full engineering partnership. The DSM showed how interdependent the organizations are and the importance for the Mx team itself to personally make inroads into gaining engineering support.
7.2 Simulation and Sensitivity Analysis
The second case study showed how improving the entire NPI process depended greatly on a partnership between the BUs, Manufacturing, and CMs. Gathering support though, will be difficult and it is helpful to first get an idea which areas might be high value areas to target first. This chapter builds on the second case study and uses the
simulation capabilities of DSM. Sensitivity analysis of the NPI process to probability of rework is also performed. These models can be used to simulate the process as well as be modified to test various process improvements.
7.2.1 Simulation
One DSM feature that is helpful in this case study is the simulation capability of DSM. However, in order to simulate the process, several factors in addition to task
dependencies are required.
"ballpark" estimation of task duration. This was done using a triangular distribution with a Best, Worst, and Most Likely duration determined for each task.
Second, the probability of rework is a critical factor. This is only relevant for tasks that are dependent. For example, if Figure 15 is the original matrix and Figure 16 is the probability rework matrix, only in the places where there are dependency marks in Figure 15, will there be probabilities of rework in Figure 16. The probability of rework is the probability that one task will cause another to be reworked. For example, if "A" is reworked, there is a 20% chance that "B" will be reworked and a 10% chance that "C" will be reworked.
I
I
Providing information Name AB C D E FG 0 A 1 1 Eo B1 E1 12 1 E1 F G 11 1Figure 15: Original Matrix
Providing information Name AB IC ID E ffF -G C: 0 0) Ci) A
E
.6 B. C .1 D .9 E .3 F G .2 .5 .4Figure 16: Probability rework matrix
Second, the impact of the rework is examined. This is the percentage of the task that is performed if the task is reworked. In the example in Figure 17, if C causes A to be
If A is reworked, there is a 20% chance that B will also be reworked
C: 0 C E -Providing information Name A B CDE F G A .8 .4 B .3 C .5 D .7 E .2L F _
Figure 17: Rework impact matrix
Learning Curve is another important part of the puzzle. This refers to the percentage of the duration of the task the second time. For example, a learning curve of 90% means that 90% of the task must be done the second time and 81% the third time (90% of the time of the second task).
With these factors known, the model can be simulated to estimate the time the entire process takes. This functionality can also be utilized to simulate potential process improvements.
7.2.2 Sensitivity Analysis
The DSM also has capability to run sensitivity analysis to understand which tasks have the most impact on process time and standard deviation. The probability of rework was the lever used.'0 By modifying an Excel macro that Cory Welch developed for his 2001 LFM thesis, sensitivity analysis was performed on the probability of rework. This meant that it was possible to simulate the process times given a reduction in the probability of rework. Put another way, if we tighten or loosen the coupling of tasks, how does this affect the process?
After performing sensitivity analysis, it was then possible to create a Pareto analysis of the tasks that had the most impact. Not surprisingly, tasks that had many dependency marks seemed to have the most impacts. In this particular DSM, the BOM Change task seemed to have the most impact. This intuitively makes sense; changing parts in the
middle of the process not only drives wait time for the part, but also possible design and testing changes. Figure 18 is a sample of the output of the model when sensitivity analysis is run. The baseline mean cycle time and the baseline standard deviation are the values when running the simulation based on the original inputs for task duration,
probability of rework, and amount of task rework. The new mean and standard deviation are based on the original input for task duration and amount of task rework, but a reduced probability of rework. This means that in the probably of rework matrix, all values in a specific task's row are reduced by the "percent reduction." The "Percent Reduction" box records what this amount is. In each row, the task is listed along with the new cycle time mean and standard deviation based on the new probability of rework. It also lists the percentage cycle time mean and standard deviation.
Baseline
Mean Baseline Std Dev Percent Reduction Runs per Simulation
377 168.6533 0.05 1000
Task New Mean New Std Dev % Mean Change % Std Dev Change
product requirements 379 167 0% -1%
schedule 375 171 -1% 1%
proto allocation 386 169 2% 0%
iskratin 334 156 11% 8%
mfg plan 384 171 2 2%
DFM feedback pre proto 372 161 1% -4%
DFM feedback mitigation pre
proto 375 167 -1% -1%
valor run and results 368 165 -2% -2%
schematic 379 171 0% 2%
diag readiness 372 167 -2% -1%
system specification 383 170 2% 1%
functional test script readiness 65 163 -3% -4%
mechanical tooling strategy 382 168 1% 0%
Fab out custom mechanicals 376 167 % 1%
Figure 18: Sample output sensitivity analysis
In this example, we can see that the most significant changes occur when reducing the probability rework of BOM Changes and doing Parts Qualification. This makes sense as changes to the BOM change a number of other tasks including various tests and
Figure 19 shows a Pareto analysis of the mean sensitivity and standard deviation sensitivity to the probability of rework. BOM Changes are found to be the most significant.
Mean sensitivity to row probability Std deviation sensitivity to row probability
(U 100% __________________
80%
0% E 0~~~~0% 20/*-i 0 :.
~0
-Task step Task step
Figure 19: Pareto analysis of sensitivity to probability of rework
7.2.4 A Tipping Point?
After studying the sensitivity of the process to the probability of rework, further research was done to see if there was a "tipping point" in which a small change in the probability of rework caused by BOM Changes could greatly affect the process. This is helpful in understanding if there is a point of diminishing returns in certain areas of improvement. The model suggests that at a certain point, the amount of rework "tips the system" such that larger blocks of the system are reworked causing a greater cycle time of the process. In Figures 20 and 21, the graphs demonstrate that at approximately 30% likelihood of rework due to BOM Changes, the sensitivity of both the mean cycle time and standard
Sensitivity of Mean to the Probabilty the BOM affects other tasks 1600 1400 1200 1000 V800 600 5 400 200 0 0 0.1 0.2 0.3 0.4 0.5 0.6 0.7 0.8 0.9 1 Probability of rework
Figure 20: A Tipping Point, sensitivity of mean cycle time
Sensitivity of std dev to Probability the BOM affects other tasks 450 350 300-250 -200 . 100 50 0 0.1 0.2 0.3 0.35 0.4 0.45 0.5 0.6 0.7 0.8 0.9 1 Probability of rework
Figure 21: A Tipping Point, sensitivity of standard deviation
While this is just an example, running this analysis on "high value targets" can streamline the process improvement by giving the team a guideline for when further improvements may not be as useful.
7.3 Limitations of the DSM Models
The models in these two case studies make several assumptions in order to simplify the problem.