Z Ern~ihrungswiss 36:237-243 (1997) © Steinkopff Verlag 1997 P. Colombani S. Sp~ti C. Spleiss P. Frey-Rindova C. Wenk
Exercise-induced sweat nitrogen excretion:
evaluation of a regional collection method
using gauze pads
Belastungsbedingte Stickstoff- verluste fiber den Schweiss: Auswertung einer lokalen Sammelmethode mit Gazen
Summary The exercise-induced sweat nitrogen excretion was investigated during a 45-minute run at moderate intensity on a treadmill. Sweat was collected with a regional collection technique using gauze pads and compared with the whole-body wash-down (WBW) method. In the regional collection, sweat was sampled from the upper back (UB), lower back (LB), abdomen (AB), and thigh (TH). Additionally, the relation of sweat urea, ammonia, and amino acids was investigated with the regional collection method during a second 45-minute run. Independent of the sweat collection method, a significant and positive correlation
Received: 22 January 1997 Accepted: 4 July 1997
Dipl. Lm.-Ing. P. Colombani (~) • S. Sp~iti C. Spleiss • P. Frey-Rindova - C. Wenk INW Nutrition Biology
ETH Zentrum, LFW A33 CH-8092 Zurich, Switzerland
E-mail: paolo.colombani@inw.agrl.ethz.ch
was found between sweat rate and the excretion rate of the largest nitrogen fraction urea, suggesting that the sweating response to exercise might be one of the most important factors determining absolute sweat nitrogen losses. The urea nitrogen excretion was nearly 140 mg.h -1 in the second run, representing the largest nitrogen fraction. Ammonia nitrogen and amino acid-derived nitrogen rate were approximately 30 mg-h q and 10 mg.h -t, respectively. The com- parison of the sampling methods during the first run revealed that the urea nitrogen rate was significantly higher, but the ammonia nitrogen rate significantly lower in the WBW. After summing urea and ammonia nitrogen, no significant difference between the methods was observed anymore, except for UB. It is concluded that the regional collection method using gauze pads is a valuable approach to measure
exercise-induced sweat nitrogen losses during moderate running exercise.
Zusammenfassung Die belastungs- bedingte Ausscheidung von Stick- stoff tiber den Schweiss wurde w~ih- rend eines mit moderater Intensitat durchgeftihrten 45-Minuten-Laufes auf einem Laufband bestimmt. Schweissproben wurden mittels ei- ner lokalen Sammelmethode mit Ga-
zen und zum Vergleich mit dem Ganzkrrper-Waschverfahren entnom- men. In der lokalen Methode wur- de der Schweiss v o m oberen und unteren Rticken, Bauch und Ober- schenkel gesammelt. W~hrend ei- nes zweiten 45-Minuten-Laufes wnr- de zusatzlich das Verh~ltnis yon Harnstoff, A m m o n i a k und Ami- nos~iuren im Schweiss analysiert. Es konnte eine yon der Sammelme- rhode unabhfingige, signifikant posi- tive Korrelation zwischen Schweiss- rate und Ausscheidungsrate der grrssten Stickstoffraktion im Schweiss (Harnstoff) beobachtet werden. Dies l~sst den Schluss zu, dass die Schweissrate einer der we- sentlichen Faktoren ist, der die Stickstoffverluste im Schweiss fest- legt. Die Ausscheidungsrate des Harnstoffstickstoffes betrug im zweiten Lauf etwa 140 mg.h "1, die des Ammoniakstickstoffes etwa 30 mg-h -~ und die des Aminos~uren- stickstoffes rund 10 mg.h -1. Der Vergleich beider Sammelmethoden wahrend des ersten Laufes zeigte, dass die Ausscheidungsrate des Harnstoffstickstoffes im Ganzkrrper- Waschverfahren signifikant hrher, die des Ammoniakstickstoffes dage- gen signifikant niedriger war. Die- ser Unterschied zwischen den Me- thoden versehwand, nachdem Harnstoff- und Ammoniakstiekstoff summiert wurden, ausser fur den oberen Rticken. Die Bestimmung von belastungsbedingten Stickstoff- verlusten tiber den Schweiss mit-
238 Zeitschrift fiir Ernghrungswissenschaft, Band 36, Heft 3 (1997) © Steinkopff Verlag 1997
tels der lokalen Sammelmethode kann far mit moderater Intensitfit durchgeftihrten Laufe empfohlen werden.
Key words Aerobic exercise - sweat nitrogen losses - whole-body washdown - regional sweat
collection
Sehliisselwiirter Aerobe kOrper- liche Belastung - Schweiss-Stick- stoffverluste - Ganzkrrper-Wasch- verfahren - lokale Schweiss- Sammelmethode
Introduction Materials and methods
Optimizing sports performance is a major goal of physi- cally active people and proper nutrition can help to achieve this goat. The most important nutritional aspects to optimize sports performance are to maintain energy, fluid, and nitrogen balance over an extended period of time. The analysis of the nitrogen balance in sedentary people involves quantitative analysis of dietary nitrogen intake and urinary and fecal nitrogen excretion. In exer- cising people, nitrogen balance analysis must also focus on the sweat nitrogen excretion, since some authors pro- vided evidence for substantial sweat nitrogen losses dur- ing exercise (100-400 mg-h q) (6, 17). An appropriate method for collecting sweat samples for nitrogen analysis must therefore be used. Previously, sweat samples were either collected by the whole-body washdown (WBW) or by much easier applicable regional collection methods (5, 9, 17, 18). In the WBW, subjects and exercise cloth- ing are rinsed after exercising and the wash water of body and clothes is subsequently analyzed. In the re- gional collection method, sweat is sampled with small gauze pads or capsules that are fixed on the skin and whole-body losses are extrapolated from regional losses. Most studies analyzing nitrogenous sweat compounds have used the regional collection method (3, 5, 9, 10, 16, 17, 20); however, the W B W method is claimed to be the criterion measure (17). While the regional collec- tion method tends to give higher sweat urea (17).and total nitrogen excretion values (8) than the WBW, the absolute difference between the methods is quite small at low to moderate exercise intensities.
According to our knowledge, there is only one study reporting amino acid sweat losses during exercise (20). The results of that work suggest that the amino acid-de- rived nitrogen losses ( - 200 mg-L -1) are as high as urea nitrogen losses when sweat is collected from the forearm. However, the reported value probably overestimates the effective loss, because different sweat nitrogen com- pounds yield much higher values when measured from the arms as compared to the trunk (8, 14, 15).
We decided to evaluate the feasibility of a regional sweat collection method using gauze pads for the use in field tests by comparing it with the WBW. Additionally, we also planned to verify the high sweat amino acid losses that were reported previously (20).
A 45-minute (45') run at moderate intensity was chosen as the test model, as this is a common exercise practise. The run was performed on a motor-driven treadmill where sweat was sampled both with regional collection and W B W (Run 1). Since the amino acid loss could not be analyzed in this run because the sampled sweat vol- ume was not sufficient, a second 45' run (Run 2) was performed at a later time. Sweat was collected only with regional collection in Run 2, because preliminary analy- ses revealed that in the wash water of the W B W the concentrations of most amino acids would have been below the reliable concentration of the analytical system.
Subjects
Nineteen healthy and moderately- to well-trained men volunteered and agreed to participate in this study after being informed about its purpose and possible risks. Ten subjects participated in Run 1 and nine in Run 2. The characteristics of the athletes are described in Table 1. Each subject's anaerobic threshold was determined ac- cording to Simon et al. (21) on a motor-driven treadmill (1.5 % grade) the week before the 45' run. The athletes were advised to refrain from any intense physical activity the day before the determination of the anaerobic thresh- old, as well as before the 45' run (see next paragraph). Additionally, carbohydrate-rich meals were prescribed qualitatively on the day before both occasions. The ath- letes reported to the laboratory during the morning of the test days after having consumed a qualitatively pre- scribed carbohydrate-rich breakfast. Physical activity and food intake were recorded on a protocol.
45-Minute run
Nude body weight was recorded with a precision of 50 g before and after the run to calculate sweat loss. Both 45' runs were performed on a motor-driven treadmill (1.5 % grade) at an intensity that corresponded to about 75 % of the speed at each individual's anaerobic threshold. Room temperature and degree of humidity during Run 1 and Run 2 were approximately 18 °C and 40 %, and 20 °C and 50 %, respectively. No fluid or food intake was allowed during the run. Sweat dropping from the face was collected with a small towel and considered together with the exercise clothing in the W B W analysis.
P. Colombani et al. 239 Sweat nitrogen losses during exercise
Table 1 Characteristics of the subjects (median and interquartile range)
Trial Subjects Age (years) Weight (kg) Running exercise (h.wk -~) Other exercise (h-wk -~)
Run 1 10 25 (22-26) 70 (65-72) 3.0 (0.0-3.8) 7.5 (4.0-11.0)
Run 2 9 25 (21-28) 66 (62-70) 1.0 (0.0-1.5) 4.0 (0.5-5.3)
Regional sweat collection
Sweat was collected using gauze pads which were fixed on the upper back (UB) and lower back (LB). Additional gauze pads were also placed on the abdomen (AB) and thigh (TH) in Run 1. The sterilized pads (6 x 8 cm, 100 % cotton) were placed symmetrically on the right and left part of each body part with a dressing (Ensure-it TM, 12.7 x 17.5 cm, Becton Dickinson Vascular Access, Utah, USA) that was fixed subsequently with an adhesive plas- ter. The skin was disinfected with pure isopropanol before placing the gauze pads on the body to avoid possible microorganism activity. The gauze pads were removed after the run, placed into a tared syringe and weighed. Syringes were then used to squeeze the sweat out of the gauze pads. Sweat was analyzed immediately for urea and ammonia, whereas a sweat aliquot was stored at -70 °C for amino acid analysis (only Run 2).
Whole-body washdown
The subjects o f Run 1 took a pre-experimental shower to remove possible traces of urea, ammonia, or amino acids from the skin. Thereafter, the gauze pads for the regional sweat collection were fixed to the skin and the athletes were dressed with underwear, socks, long tights, and long-sleeved shirts that were previously washed with deionized water.
The exercise clothing was collected after the run and rinsed in deionized water. Meanwhile, the athletes took a post-experimental shower for two minutes in a shower with closed water circulation (2.5 L deionized water). The shower water and laundry water were analyzed immedi- ately for urea and ammonia.
Biochemical analysis
All materials used for sweat sampling did not contain detectable amounts of urea and only negligible traces of ammonia. Urea and ammonia were analyzed enzymati- cally at 37 °C on a Cobas-Mira analyzer (Hoffmann-La Roche, Basel, Switzerland) using commercially available assay kits. An urease-glutamate dehydrogenase kit was used for urea (Hoffmann-La Roche, Basel, Switzerland) and a glutamate dehydrogenase kit for ammonia (Boeh- ringer Mannheim GmbH, Mannheim, Germany). Since the urea analysis does not distinguish between urea and ammonia, urea values were corrected by subtracting am-
monia values (two mol ammonia correspond with one mol urea). Free amino acids were analyzed by high per- formance liquid chromatography (LKB 4151 Alpha Plus, Pharmacia LKB, Bromma, Sweden) after having filtered the sweat sample through a 0.2 ~tm filter membrane. Amino acids having a concentration below the reliable detection limit of the assay system (< 10 pmol.L "I) were included in the calculation of the amino acid-derived nitrogen loss using a concentration of 10 ~tmol.L-L The analyzed free amino acids were atanine, arginine, aspar- gine, aspartic acid, cysteine, glutamine, glutamic acid, glycine, histidine, isoleucine, leucine, lysine, methionine, ornithine, phenylalanine, serine, taurine, threonine, tyro- sine, and valine.
Sweat loss
Total sweat loss during the run was calculated as the difference between the nude body weight before and after the run minus estimated respiratory and metabolic losses of 125 g.
Calculation of urea, ammonia, and amino acid sweat loss In the regional collection method, whole-body urea, am- monia, and amino acid losses were calculated by extrapo- lation of the local losses. The concentration of each gauze was multiplied by total sweat loss and the respective molecular mass. WBW losses were calculated by multi- plying the concentration in the laundry and shower water with the amount of water that was used and the respective molecular mass. Then, the content of the respective com- ponent of the gauze pads was added to the values of laundry and shower water. Total nitrogen loss was cal- culated by adding up the nitrogen portion of each ana- lyzed component.
Statistical analysis
All statistical analyses were performed with the STATIS- TICA/W TM software version 4.5 (Statsofff M Inc., Tulsa OK, USA). Mann-Whitney U-Test was performed to de- tect differences between Run 1 and Run 2, and Wilcoxon matched pairs test was used when comparing paired sam- pies within a run. In addition, Spearman's R was calcu- lated to look for correlations. The level o f significance was set at p < 0.05. Data in tables and text are presented as median and interquartile range.
240 Zeitschrift ffir Ern~hrungswissenschaft, Band 36, Heft 3 (1997) © Steinkopff Verlag 1997 350 300 250 200 150 100 a A
ib
0 ...UBRunt UBRun2 LBRunl LBRun2 ABRunt THRunl WBWRunt
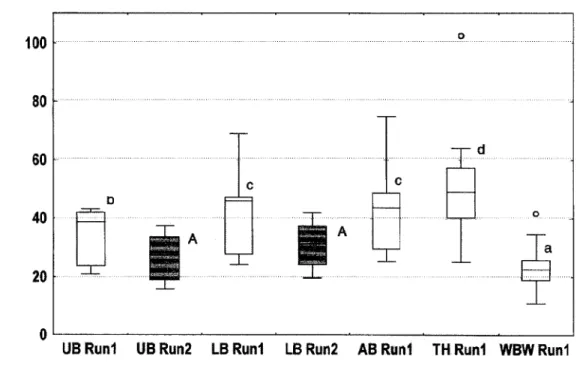
Fig. 1 Urea nitrogen sweat excretion in mg.h -I (UB = upper back, LB = lower back, AB = abdomen, TH = thigh, WBW = whole-body washdown). Results of Run t are presented as white boxplots and those of Run 2 as gray boxplots. The boxplots divide the data into four areas of equal frequency. The central box covers the middle 50 % of the values between the lower and upper quartile, while the
horizontal line inside the box is the median. The vertical lines outside the box extend to data points within 1.5 interquartile range. Separate data points are outliers (between 1.5 and 3.0 interquartile range). Box plots sharing a common regular letter are not statis- tically different (p > 0.05) in Run 1, boxplots sharing a common capital letter are not statistically different (p > 0.05) in Run 2.
Results
The a m o u n t o f w e e k l y e x e r c i s e differed to s o m e extent b e t w e e n the subjects o f Run 1 and Run 2, but the differ- ences f a i l e d to r e a c h s i g n i f i c a n c e (p > 0.06). On the other hand, the b l o o d lactate c o n c e n t r a t i o n at each i n d i v i d u a l ' s a n a e r o b i c t h r e s h o l d was s i g n i f i c a n t l y l o w e r in the sub- j e c t s o f Run 1 (p < 0.05). The distance c o v e r e d during Run 1 and Run 2 was 7.7 ( 7 . 4 - 8 . 3 ) k m and 8.1 ( 7 . 7 - 8 . 6 ) km, r e s p e c t i v e l y , and not s t a t i s t i c a l l y different.
In Run 1, the sweat rate was 1.02 ( 0 . 8 7 - 1 . 1 3 ) kg.h "~ and s i g n i f i c a n t l y h i g h e r than during Run 2 (0.77 ( 0 . 6 3 - 0 . 8 3 ) k g . h l ) . U r e a nitrogen (urea-N) and a m m o n i a n i t r o g e n ( a m m o n i a - N ) e x c r e t i o n rates w e r e also both sig- n i f i c a n t l y h i g h e r in Run 1 c o m p a r e d to Run 2.
N i t r o g e n o u s s w e a t c o m p o n e n t s
In b o t h runs, no s i g n i f i c a n t d i f f e r e n c e s were found be- t w e e n the two g a u z e p a d s that were p l a c e d s y m m e t r i c a l l y on the s a m e b o d y part. The a v e r a g e o f these two gauze p a d s was, therefore, u s e d for statistical analyses. R e s u l t s o f u r e a - N and a m m o n i a - N e x c r e t i o n rate are p r e s e n t e d in Figs. 1 and 2, r e s p e c t i v e l y .
R e g i o n a l c o l l e c t i o n
No significant d i f f e r e n c e s w e r e f o u n d in the u r e a - N ex- cretion rate b e t w e e n e a c h b o d y part w i t h i n the r e s p e c t i v e run (Fig. 1), In contrast, the rate o f a m m o n i a - N e x c r e t i o n was s i g n i f i c a n t l y different b e t w e e n all b o d y sites, e x c e p t for LB versus A B in Run 1, and UB versus LB in Run 2 (Fig, 2). The c o r r e l a t i o n a n a l y s e s r e v e a l e d that the u r e a - N e x c r e t i o n rates o f all b o d y sites w e r e s i g n i f i c a n t l y corre- lated to each other (R = 0 . 7 3 - 0 . 9 6 , p = 0 . 0 2 - 0 . 0 0 1 ) within the r e s p e c t i v e run as well as the a m m o n i a - N rates (R = 0 . 6 8 - 0 . 9 2 , p = 0 . 0 3 - 0 . 0 0 1 , e x c e p t for A B vs TH: R = 0.60, p > 0,07). W i t h i n a b o d y site, u r e a - N and a m m o n i a - N w e r e not s i g n i f i c a n t l y c o r r e l a t e d to each other (R = 0 . 5 6 - 0 . 6 2 , p > 0.09) e x c e p t for T H (R = 0.90, p < 0.001). The sweat rate was s i g n i f i c a n t l y c o r r e l a t e d to the u r e a - N rate o f all b o d y sites (R = 0 . 7 3 - 0 . 8 9 , p < 0.04) e x c e p t for LB in R u n 2 (R = 0.52, p > 0.14).
C o m p a r i s o n o f n i t r o g e n o u s s w e a t f r a c t i o n s
In Run 2, the rate o f u r e a - N , a m m o n i a - N , and a m i n o a c i d nitrogen e x c r e t i o n in U B w e r e 134 mg-h -~ (79 %), 27 mg-h t (16 %), and 9 m g . h -~ (5 %), r e s p e c t i v e l y . T h e d a t a for LB were 140 m g . h -1 (77 %), 31 m g . h -1 (17 %), and
P. Colombani et al. 241 Sweat nitrogen losses during exercise
Fig. 2 Ammonia nitrogen sweat excretion in mg.h -1 (for abbreviations and explanations
see Fig. 1). 100 80 60 40 20 ... .o ...
...
: ...
2 ... ...
...
UBRunl UBRun2 LBRunl LBRun2 ABRunl THRunl WBWRunl
Whole-body washdown
Urea-N and ammonia-N excretion rates are shown in Figs. 1 and 2, respectively. The urea-N excretion rate was highly correlated (R -- 0.94, p < 0.001) with the sweat rate.
Comparison between regional collection and whole-body washdown
The urea-N excretion rate was significantly higher in the W B W compared to all body sites (p < 0.01) except for TH (p > 0.07, Fig. 1). In contrast, the ammonia-N rate was significantly lower in the W B W compared to all body sites (p < 0.006, Fig. 2). After summing urea-N and ammonia-N, no significant difference between the methods was observed (p > 0.72), except for UB, which was higher in the W B W (p < 0.04).
Discussion
The main finding in our study is that the difference in sweat nitrogen losses between the regional collection method using gauze pads and the W B W is rather low during moderate running exercise when both urea and ammonia losses are considered.
The urea-N rate of excretion measured by W B W in the present study was significantly higher by 12 to 24 % compared to the regional estimates. In contrast, Lemon et al. (17) showed no difference between the WBW and a regional collection method using small capsules when
a 60 minute-long treadmill exercise was performed at intensities of 42 or 55 % VO2 max. At an intensity of 67 % VO2 max, the urea-N rate was even lower in the WBW. An explanation for this discrepancy between the results of both studies is not evident.
The urea-N rate varied widely during both runs at moderate intensity in our study (Fig. 1). This is in line with previous reports documenting variable urea-N excre- tion rates between 100 and 400 mg.h -1 (17) and 320 and 490 mg-h -1 (3). Reasons for a large variation in sweat urea losses include sweat rate (see next paragraph), status of the glycogen stores (16), protein content of the pre- exercise diet (6), and ambient temperature (11). Further- more, it has been suggested that acclimatization to heat is an important factor in reducing sweat nitrogen losses (2).
The urea-N rate in Run 1 was markedly higher than in Run 2 (Fig. 1). This difference can be explained largely by the 25 % lower sweat rate of the subjects in Run 2, since a significant, positive correlation was ob- served between sweat rate and urea-N excretion. Two reasons may be responsible for the higher sweat rate in Run 1. The subjects wore long-sleeved shirts and long tights to facilitate sweat sampling for the WBW. The heat transfer by conduction and convection was probably more difficult compared to the subjects of Run 2 who were dressed with T-shirts and shorts. Therefore, heat removal from the skin was probably compensated by increased evaporation (i.e., sweating rate). The second reason for the higher sweat rate might be that the athletes of Run 1 were probably better trained, since their blood lactate concentration was significantly lower at the individual anaerobic threshold. A positive relation between VO2 and
242 Zeitschrift fiir Ernahrungswissenschaft, Band 36, Heft 3 (1997) © Steinkopff Verlag 1997
sweat loss during a 60 minute run was reported (13) and physical training was shown to improve peripheral sweat production (4). The positive correlation between sweat rate and rate of the largest nitrogen fraction urea suggests that the absolute sweat nitrogen loss might at least in part be a function of the sweat rate, although an inverse relation between sweat rate and sweat nitrogen concen- tration was documented (8).
Urea represented the largest fraction of the three analyzed nitrogenous sweat components. This finding is consistent with results from non-exercising subjects where sweating was induced by heat (1). The relation between sweat urea-N, ammonia-N, and amino acid- derived nitrogen in our study was also similar to the one reported by Araki and Ando (1), which was 70 % urea-N and 30 % ammonia-N and amino acid nitrogen. Ammo- nia-N and amino acid nitrogen in our study corresponded approximately 30 % of the urea-N loss. Their contribution to whole-body nitrogen losses in regularly exercising peo- ple should, therefore, not be neglected. The rate of am- monia-N excretion in our study (Fig. 2) was comparable with other findings (30--45 mg-h-1; 9, 10). Interestingly, the ratio of ammonia-N to urea-N in the regional collec- tion method was approximately 1:4, regardless of body site and respective excreted amounts. Sweat ammonia concentrations ranging between 1 and 5 mmol.L -1 indicate that sweating might be an important clearance pathway of blood ammonia that is not further metabolized. This is underlined by considering that kidneys do not take up ammonia (12) and that ammonia expiration by the lung during aerobic exercise seems to be negligible (7).
As discussed above, the ammonia-N sweat loss was nearly 20 % of the urea-N sweat loss in the regional collection method, but only 10 % in the WBW method. This significant difference between the sampling methods was probably due to evaporation of the ammonia in the WBW, which was caused by the "mechanical movement" of shower water and laundry water.
The absolute nitrogen loss deriving from amino acid excretion was lower than the urea or ammonia nitrogen loss. Our results of approximately 10 mg.h -~ could not confirm previous data reported by Liappis et al. (20) who found extremely high amino acid-derived nitrogen losses of approximately 200 mg.L -~ and 400 mg.L -~ sweat in trained and untrained subjects, respectively. This large difference can not be solely explained by the different study designs. In their study, sweat was sampled from the forearm during a very short-lasting exercise (15 min cycling at 150 W). Indeed, earlier findings on heat-pro- voked amino acid sweat excretion showed that extremi- ties had higher amino acid concentrations than the trunk, but only by a factor of approximately three (15). The amino acid-derived nitrogen levels in sweat from the back in their study were similar to our results (7-16 mg-L-1; 15).
The current daily dietary protein recommendation is 0.8 g.kg u body mass (22). Increased amino acid oxidation and sweat and urinary urea excretion in endurance ath- letes suggest that the protein requirement for regularly exercising athletes is increased compared to sedentary individuals. Considering this raised need for nitrogen, the daily protein recommendation for endurance athletes is now set to 1.2 to 1.4 g protein • kg -t body mass (19).
In summary, the difference between regional sweat collection using gauze pads and W B W in subjects run- ning at a moderate intensity is small in regard of sweat nitrogen losses. The former method can, therefore, be recommended for the analysis of sweat nitrogen in exer- cising people, especially because it is easier to apply than the W B W in a field test.
Acknowledgments This work was supported by a grant of Nestec Ltd. (Switzerland) to Caspar Wenk.
References
1. Araki Y, Ando S (1953) Urea, amino acid and ammonia in human sweat. Ja- pan J Physiol 3:211-218
2. Ashworth A, Harrower ADB (1967) Protein requirements in tropical coun- tries: nitrogen losses in sweat and their relation to nitrogen balance. Br J Nutr 21:833-843
3. Brouns F, Saris WHM, Stroecken J, Beckers E, Thijssen R, Rehrer NJ, Hoor F (1988) The effect of diet ma- nipulation and repeated sustained exer- cise on nitrogen balance, a controlled tour de France simulation study, part 3. In: Brouns F (ed) Food and fluid related aspects in highly trained athletes. Uitgeverij De Vrieseborch, Haarlem, pp 73-81
4. Buono MJ, Sjoholm NT (t988) Effect of physical training on peripheral sweat production. J Appl Physiol 65:811-814
5. Calles-Escandon J, Cunningham JJ, Snyder P, Jacob R, Huszar G, Loke J, Felig P (1984) Influence of exercise on urea, ceratinine and 3-methylhistidine excretion in normal human subjects. Am J Physiol 246:E334-E338 6. Calloway DH, Odell ACF, Margen S
(1971) Sweat and miscellaneous nitro- gen losses in human balance studies. J Nutr 101:775-786
7. Colombani P, Zehnder M, Wenk C (t996) Ammonia expiration during en- durance exercise. Med Sci Sports Exerc 28 (Suppl):S62 (abstract)
8. Costa F, Calloway DH, Margen S (1969) Regional and total body sweat composition of men fed controlled diets. Am J Clin Nutr 22:52-58 9. Czarnowski D, G6rski J (1991) Sweat
ammonia excretion during submaximal cycling exercise. J A p p l Physiol 70:371-374
10. Czarnowski D, Langfort J, Pilis W, G6rski J (1995) Effect of a low car- bohydrate diet on plasma and sweat ammonia concentrations during pro- longed nonexhausting exercise. Eur J Appl Physiol 70:70-74
11. Dolny DG, Lemon PW (t988) Effect of ambient temperature on protein breakdown during prolonged exercise. J Appl Physiol 64:550-555
P. Colombani et al. 243 Sweat nitrogen losses during exercise
12. Graham TE, Rush JWE, MacLean DA (1995) Skeletal muscle amino acid metabolism and ammonia production during exercise. In: Hargreaves M (ed) Exercise metabolism. Human Kinetics, Champaign IL, pp 131-175
13. Greenhaff PL, Clough PJ (1989) Pre- dictors of sweat loss in man during prolonged exercise. Eur J Appl Physiol 58:348-352
14. Heyningen R, Weiner JS (1952) A comparison of arm-bag sweat and body sweat. J Physiol 116:395-403
15. Itoh S, Nakayama T (1952) Amino acids in human sweat. Japan J Physiol 2:248-253
16. Lemon PWR, Mullin JP (1980) Effect of initial muscle glycogen levels on protein catabolism during exercise. J Appl Physiol 48:624-629
17. Lemon PWR, Yarasheski KE, Dolny G (1986) Validity/reliability of sweat analysis by whole-body washdown vs. regional collections. J Appl Physiol 61:1967-1971
18. Lemon PWR (1983) A simple and inexpensive method for making sweat collection capsules. Res Q Exerc Sport 54:299-301
19. Lemon PWR (1997) Dietary protein re- quirements in athletes. J Nutr Biochem 8:52-60
20. Liappis N, Kelderbacher SD, Kesseler K, Bantzer P (1979) Quantitative study of free amino acids in human accrine sweat excreted from the forearms of healthy trained and untrained men during exercise. Eur J Appl Physiol 42:227-234
21. Simon G, Berg A, Dickhuth H-H, Si- mon-Alt A, Ketll J (1981) Bestimmung der anaeroben Schwelle in Abh~ingig- keit vom Alter und der Leistungsf~ihig- keit. Dtsch Z Sportmed 32:7-t4 22. US Food & Nutrition Board (1989) Re-
commended Dietary Allowances 10 tb edition. National Academy Press, Washington DC, p 66