HAL Id: hal-01806747
https://hal.archives-ouvertes.fr/hal-01806747
Submitted on 6 May 2021
HAL is a multi-disciplinary open access
archive for the deposit and dissemination of
sci-entific research documents, whether they are
pub-lished or not. The documents may come from
teaching and research institutions in France or
abroad, or from public or private research centers.
L’archive ouverte pluridisciplinaire HAL, est
destinée au dépôt et à la diffusion de documents
scientifiques de niveau recherche, publiés ou non,
émanant des établissements d’enseignement et de
recherche français ou étrangers, des laboratoires
publics ou privés.
in Antarctica
E. Fourré, A. Landais, A. Cauquoin, P. Jean-Baptiste, V. Lipenkov, J.-R.
Petit
To cite this version:
E. Fourré, A. Landais, A. Cauquoin, P. Jean-Baptiste, V. Lipenkov, et al.. Tritium Records to
Trace Stratospheric Moisture Inputs in Antarctica. Journal of Geophysical Research: Atmospheres,
American Geophysical Union, 2018, 123 (6), pp.3009 - 3018. �10.1002/2018JD028304�. �hal-01806747�
Tritium Records to Trace Stratospheric Moisture
Inputs in Antarctica
E. Fourré1 , A. Landais1 , A. Cauquoin1,2,3 , P. Jean-Baptiste1, V. Lipenkov4 , and J.-R. Petit5
1
Laboratoire des Sciences du Climat et de l’Environnement (UMR 8212 IPSL/CEA-CNRS-UVSQ), Orme des Merisiers,
Gif-sur-Yvette, France,2Laboratoire de Météorologie Dynamique, Université Paris 6, France,3Now at Alfred Wegener
Institute, Bremerhaven, Germany,4Arctic and Antarctic Research Institute, St. Petersburg, Russia,5Institut des Géosciences
de l’Environnement (UMR 5001 UGA/CNRS/IRD/G-INP), Paris, France
Abstract
Better assessing the dynamic of stratosphere-troposphere exchange is a key point to improve our understanding of the climate dynamic in the East Antarctica Plateau, a region where stratospheric inputs are expected to be important. Although tritium (3H or T), a nuclide naturally produced mainly in the stratosphere and rapidly entering the water cycle as HTO, seems afirst-rate tracer to study these processes, tritium data are very sparse in this region. We present thefirst high-resolution measurements of tritium concentration over the last 50 years in three snow pits drilled at the Vostok station. Natural variability of the tritium records reveals two prominent frequencies, one at about 10 years (to be related to the solar Schwabe cycles) and the other one at a shorter periodicity: despite dating uncertainty at this short scale, a good correlation is observed between3H and Na+and an anticorrelation between3H andδ18O measured on an individual pit. The outputs from the LMDZ Atmospheric General Circulation Model including stable water isotopes and tritium show the same3H-δ18O anticorrelation and allow further investigation on the associated mechanism. At the interannual scale, the modeled3H variability matches well with the Southern Annular Mode index. At the seasonal scale, we show that modeled stratospheric tritium inputs in the troposphere are favored in winter cold and dry conditions.1. Introduction
Antarctica is a key region to better document past and present climate dynamic. This remote continent and especially the East Antarctic plateau are characterized by harsh climate conditions and significantly influenced by stratosphere-to-troposphere transport. Numerous climate and environmental reconstruc-tions have been made possible thanks to numerous proxies archived in the Antarctic snow and ice over the last million years (e.g., Epica, 2004; Higgins et al., 2015) and at high resolution over the last centuries (Abram et al., 2014; Schneider et al., 2006). Among the different proxies measured on the ice matrix, stable water isotopes (δ18O or δD) are particularly useful to document past temperature variations (Jouzel et al., 2003) and aerosols concentration (e.g., Na+, Ca2+, and SO42 ) to document past atmospheric transport as well as natural aerosols sources (e.g., Fischer et al., 2007; Lambert et al., 2012; Legrand et al., 2016). Despite the use of sulfur isotopic anomaly to detect past stratospheric volcanic explosions in ice cores (Baroni et al., 2007), documenting the past stratospheric input is not straightforward from ice core proxies.
Natural tritium (3H or T) is mainly produced in the stratosphere at a rate of ~0.32 atoms/cm2/s by spallation of nitrogen and oxygen (Masarik & Beer, 2009) and rapidly enters the water cycle in the form of tritiated water molecules HTO.3H has a radioactive half-life of 4,500 ± 8 days (Lucas & Unterweger, 2000). Since 1954 and until the 1963 Nuclear Test Ban Treaty, vast amounts of thermonuclear tritium (~525 kg, United Nations Scientific Committee on the Effects of Atomic Radiation, 2000) have been injected in the stratosphere and upper atmosphere compared to the steady state global natural inventory of ~4.6 kg (deduced from the above production rate). Since 1963 tritium levels in precipitation have been steadily decreasing due to radio-active decay and dilution within the large oceanic reservoir. As a consequence, tritium concentration in pre-cipitation today is very close to the natural level and insignificantly affected by anthropogenic production as shown by a recent modeling of natural tritium concentration in water confronted to present-day measure-ments in precipitation (Cauquoin et al., 2015). The present-day tritium content of the stratosphere is about 9 × 10⁵tritium unit (TU) (Ehhalt et al., 2002; Fourré et al., 2006) whereas tritium in precipitation is in the range of a few tens of TU (IAEA/GNIP database, International Atomic Energy Agency / Global Network of Istopes in
PUBLICATIONS
Journal of Geophysical Research: Atmospheres
RESEARCH ARTICLE
10.1002/2018JD028304Key Points:
• Tritium records in three snow pits at Vostok show natural variability at about 10 years (solar cycles) and at a shorter periodicity
• From measurements on a same pit at same depths, tritium is found to be correlated to Na+and anticorrelated toδ18O
• Modeled tritium outputs suggest that this correlation is at least partly linked to atmospheric conditions
modulating input of stratospheric air
Supporting Information: • Supporting Information S1 Correspondence to: E. Fourré, [email protected] Citation:
Fourré, E., Landais, A., Cauquoin, A., Jean-Baptiste, P., Lipenkov, V., & Petit, J.-R. (2018). Tritium records to trace stratospheric moisture inputs in Antarctica. Journal of Geophysical Research: Atmospheres, 123, 3009–3018. https://doi.org/10.1002/2018JD028304
Received 10 JAN 2018 Accepted 25 FEB 2018
Accepted article online 10 MAR 2018 Published online 25 MAR 2018
©2018. American Geophysical Union. All Rights Reserved.
Precipitation), 1 TU meaning a T/H ratio of 10 18. This large difference is due to the higher H2O content in the troposphere, diluting the signal.
HTO concentration in accumulated snow (precipitation and ice crystals settling) can thus be related to strato-spheric water input. Stratostrato-spheric inputs are expected to be particularly important in polar regions, especially in central Antarctica in austral winter (Roscoe, 2004). A clear increase of tritium concentration in snow from the coast to the interior of East Antarctica is observed both in data and in modeling experiments (Cauquoin et al., 2015; Fourré et al., 2006). This effect on the local tritium concentration in snow is also favored by the very low accumulation rate in East Antarctica.
In turn, tritium concentrations in East Antarctica snow should ideally be used to assess the dynamic of stratosphere-troposphere exchanges. However, tritium data are very sparse in East Antarctica except a few mean concentration measurements performed on surface snow (Becagli et al., 2004; Cauquoin et al., 2015; Proposito et al., 2002) and a couple of samples at the Vostok station covering the period 1980–1990 (Fourré et al., 2006). In this study, we present thefirst high-resolution measurements of tritium concentration over the last 50 years at the Vostok station. The Vostok station, at an elevation of ~3,500 m, is characterized by its very low accumulation rate and temperature (respectively 2.4 cm eq ice yr 1and 57°C) and is thus one of the best place in Antarctica to detect stratospheric water vapor input. The signature of such an input at Vostok has already been suggested by combined measurements of water stable isotopes and10Be (Winkler et al., 2013). Indeed, variations of10Be concentrations in snow are influenced by the10Be production itself modulated by the solar activity (as for the tritium production) and by its transport in the atmosphere (Baroni et al., 2011). In addition, because of photochemical reactions involving ozone in the stratosphere, the triple iso-topic composition of the water vapor in the stratosphere is not expected to follow a mass-dependent relation-ship so that17O-excess of water (17O-excess = ln(δ17O + 1) 0.528 × ln(δ18O + 1)) (Barkan & Luz, 2005; Barkan & Luz, 2007; Landais et al., 2008) is expected to bear a signal of stratospheric moisture input (Winkler et al., 2013). The correlation between17O-excess and10Be in the Vostok snow pits (Touzeau et al., 2016; Winkler et al., 2013) has thus been assumed to reflect a temporal modulation of the stratospheric moisture input.
In contrast to10Be and17O-excess whose signatures in terms of stratospheric input can be debated, variabil-ity in tritium data at Vostok is more directly linked to variabilvariabil-ity of the stratospheric moisture inputs. In the following, the combination of the tritium measurements with stable water isotopes (δ18O,δD, and δ17O), aerosols concentration, and10Be as well as a confrontation with modeling outputs permits to identify the mechanisms at play that link climatic conditions and stratospheric moisture inputs.
2. Analytical Methods and Results
Tritium concentrations have been measured on samples collected with a 2 to 3 cm depth resolution from the wall of three snow pits drilled respectively in 2006 (2.95 m deep), 2007 (3 m deep), and 2008 (3.65 m deep) at Vostok station. The last one covers the period 1945–2008 and is the most documented (Baroni et al., 2011; Winkler et al., 2013).
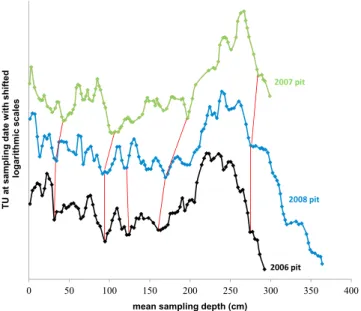
The tritium content of the ice was measured by mass spectrometry using the 3He regrowth method (Jean-Baptiste et al., 1992): the principle of this method is to degas the water sample to remove all the3He initially dissolved and then to store it under high vacuum in a sealed glass bulb (Corning 1724 glass to prevent helium diffusion) to allow for the accumulation of tritiugenic3He. Special care is taken at the degas-sing step to avoid any fractionation (and subsequent questionable correction): a cold trap is inserted between the sample and the pumping unit and the water trapped in it is further fully transferred back to the sample. The tritium content of the sample is then deduced from the amount of3He produced during the storage time and measured by mass spectrometry (MAP215-50 with an electron multiplier operated in the pulse mode). In this study, measurements range from about 10TU to 400TU, with analytical one-sigma uncertainty of 1.5–3%. For each snow pit (Figure 1 and data in supporting information), a clear peak corresponding to the bomb tests is identified at about 230–250 cm depth. The postbomb parts of the records suggest an interannual variability yet affected by some spatial distortion although the pits are separated by only a few hundred meters. This can be attributed to redistribution of snow by wind, formation of dunes influencing local accumulation patterns, and densification processes as reported, for instance, by Ekaykin et al. (2002) for δD andδ18O at Vostok. Diffusion and wind ventilation can also alter the original tritium variations in surface
snow (Johnsen et al., 2000; Neumann & Waddington, 2004). However, despite this stratigraphic noise, a similar cyclic interannual pattern can be identified on all pits with a wavelength of ~20–30 cm. Building a chronology is a necessary step to further study this cyclic interannual pattern and to correct tritium data for radioactive decay since deposition time. In this dry region of East Antarctica, the accumu-lation rate is too small to enable annual layer counting from the chem-istry or water isotopes profiles. The dating strategy is based on the following time markers (full blue symbols in Figure 2): afirst tie point was taken at the surface of the pit; second, we matched the tritium bomb peak recorded in the snow pit record with the same tritium bomb peak observed in the precipitation record from the IAEA/GNIP database (more specifically data from Invercargill station, south of New Zealand, WMO Code 9384400); third, a linear interpolation was applied between these two horizons. For the 2008 pit, a check of the relevance of such a linear interpolation is possible through the compar-ison with the non-sea-salt sulfate record (Baroni et al., 2011) allowing the identification of volcanic events: actually years 1964 (Agung erup-tion) and 1992 (Pinatubo eruperup-tion) exactly match the non-sea-salt sulfate peaks (Figure 2). For the 2006 and 2007 pits, we used the same twofirst time markers and since sulfate records were not available we used the 2008 pit chronology as a refer-ence to match the tritium variations patterns as shown by the solid red lines in Figure 1. Errors in the chron-ology of a couple of years are expected locally because of specially low amount of precipitation, spatial variability of accumulation patterns due to wind scouring (Libois et al., 2014), and possible wind blowing effects leading to possible hiatus and missing annual layers. Still, the fact that a single linear interpolation cali-brated only on the surface and the bomb tritium peak in precipitation matches well with the volcanic erup-tions record gives some confidence to the approach. This also confirms that diffusion does not have a major effect on the tritium variations archived in snow (otherwise, we would expect a larger width of the bomb peak in the pits than in precipitation).
Figure 1. Tritium records versus depth for three pits dug at Vostok in 2006, 2007, and 2008.
Figure 2. Chronology for the 2008 pit from tritium record in precipitation and volcanic events recorded by non-sea-salt (nss) sulfate concentration. Full symbols show the identified tie points (see text): in blue the surface of the pit and the tritium peak as recorded in precipitation and in red the linearly derived years corresponding to the Agung and Pinatubo eruptions (1964 and 1992), matching well the non-sea-salt sulfate profiles. TU = tritium unit.
3. Discussion
3.1. Tritium Data
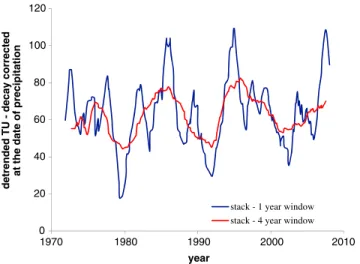
To further analyze the temporal variations of natural tritium on the longest possible period, it is important to (1) remove the bomb tritium component and (2) increase the ratio signal versus noise. To remove the anthropogenic signal on the tritium profile, we approximated the decreasing trend of the tritium peak by a combination of two exponen-tials. This signal has then been subtracted from the measured signal over the period 1970–present. To remove the local noise component from the global signal, we followed previous studies of water isotopes in East Antarctica that stacked different records from several neighbor snow pits (Ekaykin et al., 2014; Münch et al., 2016). We thus put our three pits on their reconstructed chronology, described in the previous section, together to build a stack by averaging all the data in a temporal sliding window (Figure 3).
The stack reveals two prominent frequencies, one of about 10 years (red curve in Figure 3) and the other at 3–5 years (blue curve in Figure 3). The 10 year frequency can be linked to the solar forcing mod-ulating the natural cosmogenic tritium production (Schwabe cycles), while the 3–5 years cycles may be related to internal modes of atmospheric circulation with similar periodicity such as the Southern Annular Mode (SAM) (Fogt & Bromwich, 2006; Marshall, 2003; Thompson & Wallace, 2000; Thompson et al., 2000), although an influence of deposition effects cannot be completely ruled out at this stage.
3.2. Tritium Compared With Water Isotopes and Other Tracers
Figure 4 compares the relative variability of tritium and stable water isotopes (Winkler et al., 2013) on the same snow pit dug in 2008 at Vostok. Tritium data have been corrected from the influence of the bomb test peak, and we concentrate only on the top 2 m where the natural variability is dominant. In addition, we dis-play the10Be and the sodium concentration (Baroni et al., 2011). Na+concentration is usually linked in inland
0 20 40 60 80 100 120 1970 1980 1990 2000 2010
detrended TU - decay corrected
at the date of precipitation
year
stack - 1 year window stack - 4 year window
Figure 3. Stack of the three pits: data are averaged in different temporal sliding windows after the numerical removal of the bomb tritium component. TU = tritium unit. 32 64 128 tritium (TU) 200 150 100 50 0 depth (cm) 40 30 20 10 Na + (ppb) 120x103 100 80 60 40 10 Be (at.g -1 ) 40 20 0 -20 17 O-excess (ppm) -60 -58 -56 -54 -52 δ 18 O snow (‰)
Figure 4. From top to bottom, variability of10Be concentration, sodium concentration,δ18O of snow, and17O-excess of snow and tritium (corrected from the influence of the bomb test peak) on the 2008 Vostok snow pit on a depth scale. For the four upper panels, the tritium concentration is also displayed in light gray (reverse axis for the third panel) for comparison with the other proxies.
Antarctic snow to sea ice production rate during brine or frost flower formation (Rankin et al., 2000; Wagenbach et al., 1998; Wolff et al., 2003; Yang et al., 2008). Na+concentration is thus associated with larger sea ice extent, and maximum Na+concentrations are observed during austral winter on short timescales and in ice corresponding to glacial maxima on long timescales (see review by Abram et al., 2013).
The frequency analysis of these parameters has revealed a periodicity of 4 to 5 years similar to what has been observed for the tritium variability and that may be attributed to SAM. As mentioned above, the chronology of one pit is not entirely reliable in such dry area and postdeposition effects can be huge so that we do not elaborate more on the frequency analysis for this individual record. Despite this limitation, interesting features arise from the comparison and correlation of the different records on the same coherent depth scale (i.e., on the very same snow pit).
From the combined measurements ofδ18O andδ17O on the Vostok snow pit dug in 2008 and whose tritium concentration profile is presented here, Winkler et al. (2013) found a surprising anticorrelation between the δ18O and the17O-excess signals. This anticorrelation is opposite to the general correlation betweenδ18O and 17O-excess observed in cold regions of Antarctica in transect surface snow samples and large precipitation samples at Vostok which can be explained by kinetic fractionation during snow condensation in clouds (Touzeau et al., 2016). This anticorrelation between17O-excess andδ18O has been confirmed on more recent snow pits drilled at Vostok (Touzeau et al., 2016) but could not easily be explained by postdeposition effects. The correlation observed for the recent period (since 1975) between10Be (Baroni et al., 2011) and17O-excess on the same snow pit rather led to the suggestion that the origin for the17O-excess variability could be linked to the variability of stratospheric moisture input in central East Antarctica (Winkler et al., 2013) since17 O-excess anomalies can be created by photochemical reactions in the stratosphere.
However, comparing10Be with stable water isotopic records to retrieve information on the stratospheric input is not very satisfactory since10Be is attached to aerosols. Transport and deposition processes for water isotopes and10Be are thus not comparable which raises potential doubts on the interpretation. Tritium is actually a much better tracer for stratospheric moisture input than10Be.
We notice a significant correlation between tritium and Na+(R = 0.44; N = 65) as well as an anticorrelation between tritium andδ18O (R = 0.39; N = 65). The correlation between tritium and10Be is also strongly visible (R = 0.41, N = 65) and expected, given the common stratospheric origin of the two tracers. Sinceδ18O and 17O-excess are strongly antiorrelated despite the noise on the17O-excess data, we observe some correlation between tritium and17O-excess (R = 0.3; N = 65). An anticorrelation between Na+andδ18O has already been observed both on similar and much longer timescales in East Antarctica (e.g., Bigler et al., 2010 ; Hoshina et al., 2016) and is classically explained by more sea ice on the Antarctic margins during cold periods associated with lowδ18O. The fact that aerosols concentration (Na+) andδ18O display comparable temporal variabilities suggest that the postdeposition effects on water isotopes expected from water vapor diffusion within surface snow (Johnsen et al., 2000; Town et al., 2008) do not fully erase the climatic imprint onδ18O. If so, tritium,10Be, and17O-excess maxima at the Vostok station would mostly correspond to cold conditions indicated by low δ18
O values.
3.3. Modeled Tritium and Water Isotopes Using an Atmospheric General Circulation Model
To further investigate the mechanisms leading to an anticorrelation betweenδ18O and tritium, we have used outputs from the LMDZ Atmospheric General Circulation Model (Laboratoire de Météorologie Dynamique Zoom), version LMDZ5a (Dufresne et al., 2013). Tritium and water isotopes have been implemented in this version thereby called LMDZ-iso (Cauquoin et al., 2015; Cauquoin et al., 2016; Risi et al., 2010). The details of water stable isotopes and tritium implementation, as well as their dynamical and physical descriptions, have been described in the aforementioned references: Risi et al. (2010) describe the implementation of water stable isotopes with the fractionation processes involved; Cauquoin et al. (2015) describe the implementation of natural (i.e., cosmogenic) tritium, while Cauquoin et al. (2016) focus on the addition of the anthropogenic tritium from the atmospheric nuclear bomb tests. For the natural signal, the tritium production rate used in the model is constant over time but takes into account the strong dependency with latitude and altitude (see details in Cauquoin et al., 2015, and the references therein). It is derived from the calculations of Masarik and Beer (2009) for a long-term average value of solar activity and a geomagneticfield intensity corresponding to present-day values. Although the mean value of the tritium production rate is
associated with a relatively large uncertainty within 30–50% (Masarik & Beer, 2009), this does not impact the following discussion since it only implies a global shift in the values. Finally, note that in our study, we also use the recently corrected version of the advection scheme of LMDZ-iso. The erroneous scheme, so-called “upstream scheme,” is too diffusive (Hourdin & Armengaud, 1999) and affects all water isotopes, with as the main consequence a humid bias at the poles and especially in the polar stratosphere (Cauquoin et al., 2016; Cauquoin & Risi, 2017). As in Cauquoin et al. (2016), the isotopic outputs shown here are from simulations that were nudged by the horizontal winds from 20CR reanalyzes (Compo et al., 2011).
Risi et al. (2010) and Cauquoin et al. (2015) have shown that LMDZ-iso captures well the relative spatial varia-bility ofδ18O and tritium in Antarctica with (1) a decrease ofδ18O toward low-temperature areas because of the distillation of the water mass and (2) an increase of tritium toward the East Antarctic plateau reflecting, on top of the elsewhere observed“continental effect,” the strong influence of stratospheric input combined with very low humidity conditions. The temporal variability is also well depicted by the LMDZ-iso model:first, the general shape (bomb peak and slow decrease) of the tritium concentration is well reproduced over the per-iod 1950 to 2008 which is the perper-iod of interest of the present study (Cauquoin et al., 2016); and second, at the seasonal scale in Antarctica, the higher content of tritium in the winter precipitation is well reproduced as observed in the available tritium record in monthly precipitation on the Antarctic base of Halley Bay (Cauquoin et al., 2015). Interannual and seasonal variations ofδ18O in Antarctic precipitations are also well reproduced in the LMDZ-iso with a clear dominance of the temperature signal in the precipitationδ18O signal (Risi et al., 2010). We thus confidently use the simulated tritium and δ18O variability in Antarctica from the LMDZ-iso model in the following.
Figure 5 shows the outputs of tritium and water isotopes in Vostok precipitation from LMDZ-iso over the per-iod 1990–2008. There is a clear maximum in modeled tritium concentration during austral winter as already
300 250 200 150 100 50 0 Tritium (TU) 2005 2000 1995 1990 date -70 -65 -60 -55 -50 -45 -40 δ 18 O snow (‰) 4 2 0 -2 -4 SAM index
Figure 5. Variations ofδ18O (on a reverse scale) and tritium of snow at the seasonal scale (light colors) and at interannual scale (12 months precipitation weighted running average, dark colors) for the years 1990–2008 at Vostok as obtained from the LMDZ-iso model equipped with tritium. The lower panel shows the variations of the annual Southern Annular Mode (SAM) index over the same period (Marshall, 2003). Light gray rectangles indicate minima of the tritium content in snow which are also associated with minima of the SAM index.
observed at Halley Bay in both analyzed and modeled precipitation tritium content. For our study at Vostok we cannot compare directly the modeled tritium and water isotopes variability from Figure 5 to the measured profiles from Figures 3 and 4 because of local chronology uncertainties of a few years in our reconstructed tritium concentration record in Figure 3. As mentioned in section 2, precipitation intermittency and wind blowing effects in such a low accumulation site are associated with hiatus of a few years and anomalously thick snow layers. This is the reason why we restrict our analysis to the comparison of the relative variations of tritium and stable water isotopes in both snow pit profiles and model outputs. The pertinence of such a data-model comparison is supported by the validation of stable water isotopes and tritium modeled variability (both temporally and spatially) in Antarctica with the LMDZ-iso model (Risi et al., 2010; Cauquoin et al., 2015, 2016). In addition, even if a straightforward comparison is limited by the chronology issue, the mean tritium level is similar in our data (Figure 4) and in the modeled outputs (Figure 5). The amplitude of the measured tritium variability is slightly higher than the amplitude of the modeled tritium variability on annual average which is also expected from the sampling resolution (3 cm) which is smaller than the average thickness of an annual snow layer (~7 cm).
There is a significant anticorrelation in the model between δ18O and tritium at the seasonal and interannual scale (Figure 5): R = 0.59 at the monthly scale (N = 228) and R = 0.78 at the annual scale using tritium and δ18O precipitation weighted averages (N = 19), in agreement with what is observed in the data. As expected and already noted in Winkler et al. (2013), there is a strong correlation in the model betweenδ18O and tem-perature at both the seasonal and interannual timescales at Vostok. In the model nudged by reanalyzes, the Vostok annual temperature is significantly anticorrelated with the annual SAM index (R = 0.54, N = 19) in agreement with thefinding of Thompson and Solomon (2002) using data from different weather stations. This anticorrelation between SAM index and East Antarctic temperature is mainly explained by stronger circumpolar wind during positive phases of the SAM that prevent heat to reach the interior of Antarctica (van den Broeke & van Lipzig, 2003).
3.4. Characteristic Atmospheric and Isotopic Patterns During Stratospheric Input
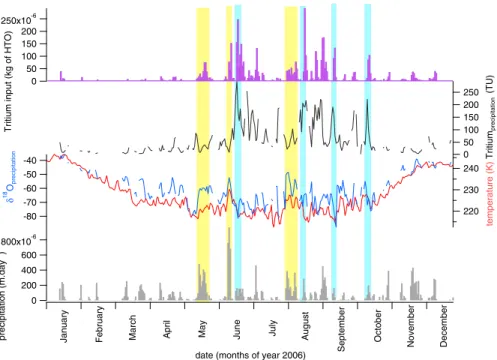
We observe similar relationships betweenδ18O and tritium in both model outputs and data. Moreover,δ18O of precipitation is strongly imprinted by temperature, a link that is observed both in data records and in the
800x10-6 600 400 200 0 precipitation (m.day -1 )
date (months of year 2006)
250 200 150 100 50 0 Tritium precipitation (TU) 240 230 220 temperature (K) -80 -70 -60 -50 -40 δ 18 O precipitation 250x10-6 200 150 100 50 0
Tritium input (kg of HTO)
January February March April May June July August
September
October November December
Figure 6. Modeled variations of tritium,δ18O of precipitation, temperature, and precipitation amount during year 2006 from the LMDZ-iso modeled equipped with tritium at the Vostok station. Light blue rectangles highlight periods associated with significant tritium input during cold periods. Yellow rectangles highlight periods associated with a larger amount of precipitation but little tritium input, in winter milder temperatures and higherδ18O episodes.
model. This relationship is explained by the distillation effect (e.g., Touzeau et al., 2016). Because the link betweenδ18O, temperature, and tritium is well captured by the LMDZ-iso model, we use the model outputs to progress on the understanding of the atmospheric conditions leading to high natural tritium values in East Antarctica. At a seasonal scale, precipitations are very rich in tritium during winter (Figure 6). The strongest peaks of tritium concentration are observed during cold days when the daily precipitation amount is rela-tively small (i.e., at least 5 times lower than the strongest daily precipitation amount; light blue rectangles in Figure 6). Still, since the tritium concentration can reach up to 300 TU, these events contribute significantly to the average annual tritium content in snow. This can be clearly seen on the upper panel of Figure 6, which quantifies the amount of HTO brought by the precipitation events. On the opposite, during the larger winter precipitation events associated with warmer temperatures and hence highδ18O, tritium level remains low (yellow rectangles in Figure 6). These events reflect strong intrusion of warm air from the coast linked to amplification of Rossby waves in the circumpolar westerlies and mostly negative SAM index (e.g., Schlosser et al., 2016, and references therein). Finally, our modeling results suggest that the tritium level in Antarctic precipitation is controlled by the climatic conditions during austral winter. It suggests that when precipitation is mainly related to arrivals of warm air from the coast in austral winter, hence negative SAM index like for the observations in 2009 (Schlosser et al., 2016), tritium level in precipitating snow should be low due to dilution. On the opposite, cold austral winter in the East Antarctic associated with positive SAM index as observed in 2010 (Schlosser et al., 2016) is expected to be associated with higher tritium level in precipitating snow. This is also the case when we compare the modeled tritium in winter (Figure 5) and the SAM index (from Marshall & National Center for Atmospheric Research Staff, 2016): for the 1995–1999 period, for instance, year 1996 correspond to negative SAM index and relatively low tritium values compared to the period 1997–1999 when the SAM index was positive and winter tritium values higher (Figure 5).
4. Conclusion
We have displayed thefirst tritium profiles over 3 to 3.6 m deep snow pits retrieved during three consecutive years at the remote station of Vostok in East Antarctica. A correction from the bomb peak permits to study the natural tritium variability at the Vostok station. As for the other climatic and environmental proxies measured in snow pits at Vostok, there is no straightforward depth correspondence between the tritium minima and maxima from one pit to its neighbor. Therefore, the best way to look at tritium natural variability is to perform a stack of the three snow pits plotted against their own timescale. This stack displays two kinds of variability: (1) a 10 years periodicity variability that most probably corresponds to the solar influence on the tritium pro-duction and (2) a 3–5 years periodicity. Due to the low accumulation at Vostok, the snow pit samples cannot capture the seasonal cycle, and also, processes like wind scouring can lead to inhomogeneous accumulation pattern at the surface (e.g., Libois et al., 2014). It is therefore not clear whether the 3–5 year variability should be regarded as a result of inhomogeneities in surface accumulation processes or as a signal of interannual variability linked to SAM. However, it is still possible to compare the tritium record to variability of other climatic and environmental proxies provided that they are all measured on the same snow pit, hence on a common timescale.
Over the 3–5 years periodicity, tritium variations are significantly correlated with10Be concentration also reflecting stratospheric input. They are also correlated with sodium concentration and anticorrelated with δ18O variations in the same snow pit. Using the atmospheric model LMDZ-iso equipped with stable water iso-topes and tritium, we show that the strong tritium inputs likely occur during cold conditions. During these periods, the air is dry and the dilution of the tritium of stratospheric origin in the tropospheric water vapor is less efficient. These periods also correspond to low δ18O in falling snow (because of low condensation tem-perature) in the model, hence explaining the anticorrelation between tritium andδ18O.
The correlation between17O-excess,10Be, and tritium on the 2008 snow pit supports a possible stratospheric origin for the17O-excess signal in remote region of East Antarctica as hypothesized by Winkler et al. (2013). The alternative explanation for the origin of the17O-excess signal was linked to fractionating postdeposition process (e.g., diffusion, Johnsen et al., 2000, or wind pumping associated with condensation on cold layer, Neumann & Waddington, 2004). Indeed, these two processes linked to water vapor transport are favored within the top meters of the snow because of high snow porosity. However, tritium concentrations show such a large variability that diffusion effects are impactless, and it is not expected that10Be, sodium concentration,
and water isotopes are affected similarly by fractionating postdeposition effects. We thus believe that the cor-relation observed between stable water isotopes parameters, sodium concentration, and tritium is at least partly linked to atmospheric conditions modulating input of stratospheric air in East Antarctica.
Finally, our work opens new perspectives. In particular the combined use of tritium and stable water isotopes is a strong tool to assess the input of stratospheric moisture in the past (only recent past for tritium because of its radioactive decay). This combination can thus be used to quantify the evolution over the last decades of stratospheric versus tropospheric moisture inputs, that is, distinguish winters with frequent arrivals of warm air from the coast from winters with more local moisture sources.
References
Abram, N. J., Mulvaney, R., Vimeux, F., Phipps, S. J., Turner, J., & England, M. H. (2014). Evolution of the Southern Annular Mode during the past millennium. Nature Climate Change, 4(7), 564–569. https://doi.org/10.1038/nclimate2235
Abram, N. J., Wolff, E. W., & Curran, M. A. J. (2013). A review of sea ice proxy information from polar ice cores. Quaternary Science Reviews, 79, 168–183. https://doi.org/10.1016/j.quascirev.2013.01.011
Barkan, E., & Luz, B. (2005). High precision measurements of17O/16O and18O/16O ratios in H2O. Rapid Communications in Mass Spectrometry,
19(24), 3737–3742. https://doi.org/10.1002/rcm.2250 Barkan, E., & Luz, B. (2007). Diffusivity fractionations of H2
16 O/H2 17 O and H2 16 O/H2 18
O in air and their implications for isotope hydrology. Rapid Communications in Mass Spectrometry, 21(18), 2999–3005. https://doi.org/10.1002/rcm.3180
Baroni, M., Bard, E., Petit, J.-R., Magand, O., & Bourlès, D. (2011). Volcanic and solar activity, and atmospheric circulation influences on cosmogenic10Be fallout at Vostok and Concordia (Antarctica) over the last 60 years. Geochimica et Cosmochimica Acta, 75(22), 7132–7145. https://doi.org/10.1016/j.gca.2011.09.002
Baroni, M., Thiemens, M. H., Delmas, R. J., & Savarino, J. (2007). Mass-independent sulfur isotopic compositions in stratospheric volcanic eruptions. Science, 315(5808), 84–87. https://doi.org/10.1126/science.1131754
Becagli, S., Proposito, M., Benassai, S., Flora, O., Genoni, L., Gragnani, R., et al. (2004). Chemical and isotopic snow variability in East Antarctica along the 2001/02 ITASE traverse. Annals of Glaciology, 39(1), 473–482. https://doi.org/10.3189/172756404781814636
Bigler, M., Röthlisberger, R., Lambert, F., Wolff, E. W., Castellano, E., Udisti, R., et al. (2010). Atmospheric decadal variability from high-resolution Dome C ice core records of aerosol constituents beyond the Last Interglacial. Quaternary Science Reviews, 29(1–2), 324–337. https://doi.org/10.1016/j.quascirev.2009.09.009
Cauquoin, A., Jean-Baptiste, P., Risi, C., Fourré, É., & Landais, A. (2016). Modeling the global bomb tritium transient signal with the AGCM LMDZ-iso: A method to evaluate aspects of the hydrological cycle. Journal of Geophysical Research: Atmospheres, 121, 12,612–12,629. https://doi.org/10.1002/2016JD025484
Cauquoin, A., Jean-Baptiste, P., Risi, C., Fourré, É., Stenni, B., & Landais, A. (2015). The global distribution of natural tritium in precipitation simulated with an Atmospheric General Circulation Model and comparison with observations. Earth and Planetary Science Letters, 427, 160–170. https://doi.org/10.1016/j.epsl.2015.06.043
Cauquoin, A., & Risi, C. (2017). Importance of the advection scheme for the simulation of water isotopes over Antarctica by general circulation models: A case study with LMDZ-iso (LMDZ5a revision 1750). Geoscientific Model Development Discussion, 11, 1–10. https://doi.org/ 10.5194/gmd-2017-178
Compo, G. P., Whitaker, J. S., Sardeshmukh, P. D., Matsui, N., Allan, R. J., Yin, X., et al. (2011). The twentieth century reanalysis project. Quarterly Journal of the Royal Meteorological Society, 137(654), 1–28. https://doi.org/10.1002/qj.776
Dufresne, J.-L., Foujols, M.-A., Denvil, S., Caubel, A., Marti, O., Aumont, O., et al. (2013). Climate change projections using the IPSL-CM5 Earth System Model: From CMIP3 to CMIP5. Climate Dynamics, 40(9–10), 2123–2165. https://doi.org/10.1007/s00382-012-1636-1
Ehhalt, D. H., Rohrer, F., Schauffler, S., & Pollock, W. (2002). Tritiated water vapor in the stratosphere: Vertical profiles and residence time. Journal of Geophysical Research, 107(D24), 4757. https://doi.org/10.1029/2001JD001343
Ekaykin, A. A., Kozachek, A. V., Lipenkov, V. Y., & Shibaev, Y. A. (2014). Multiple climate shifts in the Southern Hemisphere over the past three centuries based on central Antarctic snow pits and core studies. Annals of Glaciology, 55(66), 259–266. https://doi.org/10.3189/ 2014AoG66A189
Ekaykin, A. A., Lipenkov, V. Y., Barkov, N. I., Petit, J. R., & Masson-Delmotte, V. (2002). Spatial and temporal variability in isotope composition of recent snow in the vicinity of Vostok station, Antarctica: Implications for ice-core record interpretation. Annals of Glaciology, 35(1), 181–186. https://doi.org/10.3189/172756402781816726
Epica, C. M. (2004). Eight glacial cycles from an Antarctic ice core. Nature, 429(6992), 623–628. https://doi.org/10.1038/nature02599 Fischer, H., Siggaard-Andersen, M. L., Ruth, U., Röthlisberger, R., & Wolff, E. W. (2007). Glacial/interglacial changes in mineral dust and sea-salt
records in polar ice cores: Sources, transport, and deposition. Reviews of Geophysics, 45, RG1002. https://doi.org/10.1029/2005RG000192 Fogt, R. L., & Bromwich, D. H. (2006). Decadal variability of the ENSO teleconnection to the high-latitude South Pacific governed by coupling
with the southern annular mode. Journal of Climate, 19(6), 979–997. https://doi.org/10.1175/JCLI3671.1
Fourré, E., Jean-Baptiste, P., Dapoigny, A., Baumier, D., Petit, J. R., & Jouzel, J. (2006). Past and recent tritium levels in Arctic and Antarctic polar caps. Earth and Planetary Science Letters, 245(1–2), 56–64. https://doi.org/10.1016/j.epsl.2006.03.003
Higgins, J. A., Kurbatov, A. V., Spaulding, N. E., Brook, E., Introne, D. S., Chimiak, L. M., et al. (2015). Atmospheric composition 1 million years ago from blue ice in the Allan Hills, Antarctica. Proceedings of the National Academy of Sciences of the United States of America, 112(22), 6887–6891. https://doi.org/10.1073/pnas.1420232112
Hoshina, Y., Fujita, K., Iizuka, Y., & Motoyama, H. (2016). Inconsistent relationships between major ions and water stable isotopes in Antarctic snow under different accumulation environments. Polar Science, 10(1), 1–10. https://doi.org/10.1016/j.polar.2015.12.003
Hourdin, F., & Armengaud, A. (1999). The use offinite-volume methods for atmospheric advection of trace species. Part I: Test of various formulations in a general circulation model. Monthly Weather Review, 127(5), 822–837. https://doi.org/10.1175/1520-0493(1999)127% 3C0822:TUOFVM%3E2.0.CO;2
Jean-Baptiste, P., Mantisi, F., Dapoigny, A., & Stievenard, M. (1992). Design and performance of a mass spectrometric facility for measuring helium isotopes in natural waters and for low-level tritium determination by the3He ingrowth method. International Journal of Radiation Applications and Instrumentation. Part A. Applied Radiation and Isotopes, 43(7), 881–891. https://doi.org/10.1016/0883-2889(92)90150-D
Journal of Geophysical Research: Atmospheres
10.1002/2018JD028304
Acknowledgments
We thank Camille Risi for her modeling expertise, Arnaud Dapoigny for his technical contribution to the tritium measurements, and Melanie Baroni, Elisabeth Schlosser, and
AlexandraTouzeau for fruitful discussions. We are also grateful to two anonymous reviewers who provided helpful comments to greatly improve this manuscript. Amaelle Landais and Alexandre Cauquoin have received funding from the European Research Council under the European Union’s Seventh Framework Programme (FP7/2007–2013)/ERC grant agreement 306045. The table reporting detailed tritium data of the three pits can be downloaded in the supporting information.
Johnsen, S. J., Clausen, H. B., Cuffey, K. M., Hoffmann, G., Schwander, J., & Creyts, T. (2000). Diffusion of stable isotopes in polarfirn and ice: The isotope effect infirn diffusion. Physics of Ice Core Records, 159, 121–140.
Jouzel, J., Vimeux, F., Caillon, N., Delaygue, G., Hoffmann, G., Masson-Delmotte, V., & Parrenin, F. (2003). Magnitude of isotope/temperature scaling for interpretation of central Antarctic ice cores. Journal of Geophysical Research, 108(D12), 4361. https://doi.org/10.1029/ 2002JD002677
Lambert, F., Bigler, M., Steffensen, J. P., Hutterli, M., & Fischer, H. (2012). Centennial mineral dust variability in high-resolution ice core data from Dome C, Antarctica. Climate of the Past, 8(2), 609–623. https://doi.org/10.5194/cp-8-609-2012
Landais, A., Barkan, E., & Luz, B. (2008). Record ofδ18O and17O-excess in ice from Vostok Antarctica during the last 150,000 years. Geophysical Research Letters, 35, L02709. https://doi.org/10.1029/2007GL032096
Legrand, M., Yang, X., Preunkert, S., & Theys, N. (2016). Year-round records of sea salt, gaseous, and particulate inorganic bromine in the atmospheric boundary layer at coastal (Dumont d’Urville) and central (Concordia) East Antarctic sites. Journal of Geophysical Research: Atmospheres, 121, 997–1023. https://doi.org/10.1002/2015JD024066
Libois, Q., Picard, G., Arnaud, L., Morin, S., & Brun, E. (2014). Modeling the impact of snow drift on the decameter-scale variability of snow properties on the Antarctic Plateau. Journal of Geophysical Research: Atmospheres, 119, 11,662–11,681. https://doi.org/10.1002/ 2014JD022361
Lucas, L. L., & Unterweger, M. P. (2000). Comprehensive review and critical evaluation of the half-life of tritium. Journal of Research of the National Institute of Standards and Technology, 105(4), 541–549. https://doi.org/10.6028/jres.105.043
Marshall, G. J. (2003). Trends in the southern annular mode from observations and reanalyses. Journal of Climate, 16(24), 4134–4143. https:// doi.org/10.1175/1520-0442(2003)016%3C4134:TITSAM%3E2.0.CO;2
Marshall, G. J., & National Center for Atmospheric Research Staff (2016). The Climate Data Guide : Marshall Southern Annular Mode (SAM) Index (Station-based). Retrieved from https://climatedataguide.ucar.edu/climate-data/marshall-southern-annular-mode-sam-index-station-based
Masarik, J., & Beer, J. (2009). An updated simulation of particlefluxes and cosmogenic nuclide production in the Earth’s atmosphere. Journal of Geophysical Research, 114, D11103. https://doi.org/10.1029/2008JD010557
Münch, T., Kipfstuhl, S., Freitag, J., Meyer, H., & Laepple, T. (2016). Regional climate signal vs. local noise: A two-dimensional view of water isotopes in Antarcticfirn at Kohnen Station, Dronning Maud Land. Climate of the Past, 12(7), 1565–1581. https://doi.org/10.5194/ cp-12-1565-2016
Neumann, T. A., & Waddington, E. D. (2004). Effects offirn ventilation on isotopic exchange. Journal of Glaciology, 50(169), 183–194. https:// doi.org/10.3189/172756504781830150
Proposito, M., Becagli, S., Castellano, E., Flora, O., Genoni, L., Gragnani, R., et al. (2002). Chemical and isotopic snow variability along the 1998 ITASE traverse from Terra Nova Bay to Dome C, East Antarctica. Annals of Glaciology, 35(1), 187–194. https://doi.org/10.3189/ 172756402781817167
Rankin, A. M., Auld, V., & Wolff, E. W. (2000). Frostflowers as a source of fractionated sea salt aerosol in the polar regions. Geophysical Research Letters, 27(21), 3469–3472. https://doi.org/10.1029/2000GL011771
Risi, C., Bony, S., Vimeux, F., & Jouzel, J. (2010). Water-stable isotopes in the LMDZ4 general circulation model: Model evaluation for present-day and past climates and applications to climatic interpretations of tropical isotopic records. Journal of Geophysical Research, 115, D12118. https://doi.org/10.1029/2009JD013255
Roscoe, H. K. (2004). Possible descent across the“tropopause” in Antarctic winter. Advances in Space Research, 33(7), 1048–1052. https://doi. org/10.1016/S0273-1177(03)00587-8
Schlosser, E., Stenni, B., Valt, M., Cagnati, A., Powers, J. G., Manning, K. W., et al. (2016). Precipitation and synoptic regime in two extreme years 2009 and 2010 at Dome C, Antarctica—Implications for ice core interpretation. Atmospheric Chemistry and Physics, 16(8), 4757–4770. https://doi.org/10.5194/acp-16-4757-2016
Schneider, D. P., Steig, E. J., Van Ommen, T. D., Dixon, D. A., Mayewski, P. A., Jones, J. M., & Bitz, C. M. (2006). Antarctic temperatures over the past two centuries from ice cores. Geophysical Research Letters, 33, L16707. https://doi.org/10.1029/2006GL027057
Thompson, D. W. J., & Solomon, S. (2002). Interpretation of recent Southern Hemisphere climate change. Science, 296(5569), 895–899. https:// doi.org/10.1126/science.1069270
Thompson, D. W. J., & Wallace, J. M. (2000). Annular modes in the extratropical circulation. Part I: Month-to-month variability. Journal of Climate, 13(5), 1000–1016. https://doi.org/10.1175/1520-0442(2000)013%3C1000:AMITEC%3E2.0.CO;2
Thompson, D. W. J., Wallace, J. M., & Hegerl, G. C. (2000). Annular modes in the extratropical circulation. Part II: Trends. Journal of Climate, 13(5), 1018–1036. https://doi.org/10.1175/1520-0442(2000)013%3C1018:AMITEC%3E2.0.CO;2
Touzeau, A., Landais, A., Stenni, B., Uemura, R., Fukui, K., Fujita, S., et al. (2016). Acquisition of isotopic composition for surface snow in East Antarctica and the links to climatic parameters. The Cryosphere, 10(2), 837–852. https://doi.org/10.5194/tc-10-837-2016
Town, M. S., Warren, S. G., Walden, V. P., & Waddington, E. D. (2008). Effect of atmospheric water vapor on modification of stable isotopes in near-surface snow on ice sheets. Journal of Geophysical Research, 113, D24303. https://doi.org/10.1029/2008JD009852
United Nations Scientific Committee on the Effects of Atomic Radiation (2000). Sources and effects of ionizing radiation. Report to the General Assembly, with annexes. United Nations sales publication no E.77.IX.3(ISBN 92-1-145538-8). New York.
van den Broeke, M. R., & van Lipzig, N. P. M. (2003). Factors controlling the near-surface windfield in Antarctica. Monthly Weather Review, 131(4), 733–743. https://doi.org/10.1175/1520-0493(2003)131%3C0733:FCTNSW%3E2.0.CO2
Wagenbach, D., Legrand, M., Fischer, H., Pichlmayer, F., & Wolff, E. W. (1998). Atmospheric near-surface nitrate at coastal Antarctic sites. Journal of Geophysical Research, 103(D9), 11,007–11,020. https://doi.org/10.1029/97JD03364
Winkler, R., Landais, A., Risi, C., Baroni, M., Ekaykin, A., Jouzel, J., et al. (2013). Interannual variation of water isotopologues at Vostok indicates a contribution from stratospheric water vapor. Proceedings of the National Academy of Sciences of the United States of America, 110(44), 17,674–17,679. https://doi.org/10.1073/pnas.1215209110
Wolff, E. W., Rankin, A. M., & Röthlisberger, R. (2003). An ice core indicator of Antarctic sea ice production? Geophysical Research Letters, 30(22), 2158. https://doi.org/10.1029/2003GL018454
Yang, X., Pyle, J. A., & Cox, R. A. (2008). Sea salt aerosol production and bromine release: Role of snow on sea ice. Geophysical Research Letters, 35, L16815. https://doi.org/10.1029/2008GL034536