HAL Id: hal-01924991
https://hal.archives-ouvertes.fr/hal-01924991
Submitted on 12 Jun 2019
HAL is a multi-disciplinary open access
archive for the deposit and dissemination of
sci-entific research documents, whether they are
pub-lished or not. The documents may come from
teaching and research institutions in France or
abroad, or from public or private research centers.
L’archive ouverte pluridisciplinaire HAL, est
destinée au dépôt et à la diffusion de documents
scientifiques de niveau recherche, publiés ou non,
émanant des établissements d’enseignement et de
recherche français ou étrangers, des laboratoires
publics ou privés.
Hole Fermi surface in Bi2Se3 probed by quantum
oscillations
B.A. Piot, Wilfried Desrat, Duncan Kennedy Maude, M. Orlita, M. Potemski,
Gines Martinez Garcia, Y.S. Hor
To cite this version:
B.A. Piot, Wilfried Desrat, Duncan Kennedy Maude, M. Orlita, M. Potemski, et al.. Hole Fermi
surface in Bi2Se3 probed by quantum oscillations. Physical Review B: Condensed Matter and
Ma-terials Physics (1998-2015), American Physical Society, 2016, 93 (15), pp.155206.
�10.1103/Phys-RevB.93.155206�. �hal-01924991�
This is the accepted manuscript made available via CHORUS. The article has been
published as:
Hole Fermi surface in Bi_{2}Se_{3} probed by quantum
oscillations
B. A. Piot, W. Desrat, D. K. Maude, M. Orlita, M. Potemski, G. Martinez, and Y. S. Hor
Phys. Rev. B 93, 155206 — Published 27 April 2016
The hole Fermi surface in Bi
2Se
3probed by quantum oscillations
B. A. Piot1, W. Desrat 2, D.K. Maude3, M. Orlita1, M. Potemski1, G. Martinez1
1 Laboratoire National des Champs Magn´etiques Intenses, LNCMI-CNRS-UGA-UPS-INSA-EMFL, F-38042 Grenoble, France 2
Universit´e Montpellier 2 and CNRS, Laboratoire Charles Coulomb (L2C), UMR 5221 CNRS-Universit´e de Montpellier, F-34095 Montpellier, F-France and
3
Laboratoire National des Champs Magn´etiques Intenses, LNCMI-CNRS-UGA-UPS-INSA-EMFL, F-31400 Toulouse, France
Y.S. Hor4
4 Department of Physics, Missouri University of Science and Technology, Rolla, MO 65409, USA (Dated: April 6, 2016)
Transport and torque magnetometry measurements are performed at high magnetic fields and low temperatures in a series of p-type (Ca-doped) Bi2Se3 crystals. The angular dependence of the Shubnikov-de Haas and de Haas-van Alphen quantum oscillations enables us to determine the Fermi surface of the bulk valence band states as a function of the carrier density. At low density, the angular dependence exhibits a downturn in the oscillations frequency between 0◦and 90◦, reflecting a bag-shaped hole Fermi surface. The detection of a single frequency for all tilt angles rules out the existence of a Fermi surface with different extremal cross-sections down to 24 meV. There is therefore no signature of a camel-back in the valence band of our bulk samples, in accordance with the direct band gap predicted by GW calculations.
PACS numbers: 71.18.+y,71.20.Nr,72.20.My
I. INTRODUCTION
Bi2Se3 is a narrow gap layered semiconductor which
together with Bi2Te3 have been studied for decades for
their thermo-electric properties.1 The interest in this class of materials has recently surged because of the prediction2and observation3,4of a unique type of charge
carriers existing at their surface, the so-called “helical Dirac fermions”, which behave as massless relativistic particles with a spin locked to their translational momen-tum. Bi2Se3therefore now belongs to the 3D topological
insulators family characterized by a bulk gap coexisting with 2D conducting surface states. As a matter of fact, the existence of gapless states at the boundary of the material is related to a well defined change in the bulk band structure. In Bi2Se3, this originates from a
par-ity inversion of the valence and conduction bands at the Γ point of the Brillouin zone in the presence of a large spin orbit coupling.2,5 The linear-in-momentum
disper-sion relation which characterizes the 2D surface states thus emerges from the general Hamiltonian of massive Dirac fermions,2 theoretically expected to describe the bulk states in Bi2Se3.
Pioneering experimental studies of the bulk conduction band at low energy6have reported an ellipsoidal electron Fermi surface, which was described within a simple model of massive carriers with a parabolic (non-parabolic) dis-persion in the k⊥ (kk) direction, where k⊥ (kk) is the
momentum in the direction perpendicular (parallel) to the c-axis of the crystal. This is accompanied by an increasing anisotropy of the Fermi surface observed as the Fermi level increases in the conduction band. More recent transport,7–9 NMR,9 and magneto-optics10
mea-surements have confirmed the original parameters phe-nomenologically describing the bulk conduction band, and in some cases10 connected them to the 3D Dirac Hamiltonian for massive fermions applied to topological insulators.
However, experimental studies of the valence band bulk Fermi surface are to our knowledge scarce. The principal reason is that as-grown Bi2Se3 is electron-doped due to
the presence of Se vacancies. The discovery of 2D surface states has nevertheless triggered large efforts to reach the topological insulator regime, where the Fermi level lies in the band gap of the bulk band structure. For instance, substituting trace amounts of Ca2+ for Bi3+in as-grown Bi2Se3 can lower the Fermi energy of the native n-type
crystals. Above a certain value of Ca-doping δ, the elec-trical conduction in Bi2−δCaδSe3 is supported by hole
carriers rather than electrons.11,12Further doping brings
the Fermi level deep in the previously inaccessible valence band. Very recently, Shubnikov-de Haas (SdH) measure-ments have been reported13 in p-type Bi2Se3 samples
with hole concentrations estimated between 5.7 × 10¹⁸
cm−3 and 1.6 × 1019 cm−3. A bag-like closed Fermi
sur-face was observed at low concentration, with the sug-gestion of open tubes appearing in the Fermi surface at high carrier density. In spite of these first experimen-tal advances, and several theoretical works,1,2,14,15 the
low-energy details of the valence band are still not un-ambiguously determined. In particular, a local minimum was suggested to form at the Γ point as a consequence of the spin-orbit coupling. While a camel-back structure is observed in the valence band near the surface,12 it is
absent in some bulk measurements.10,16,17 More recent
in-2 teractions reduce the band gap at the Γ point and wash
out the camel-back structure. This issue brings further motivation to experimentally investigate the bulk valence band, in particular close to the Γ point.
In this article, we present a doping dependent study of the bulk valence band Fermi surface in Bi2Se3in a
previ-ously unexplored low energy range. High quality calcium-doped Bi2Se3 crystals are studied by magneto-transport
and torque magnetometry at low temperatures and un-der magnetic fields up to 30 T. A high resolution angular dependence of the quantum oscillations (both Shubnikov-de Haas (SdH) and Shubnikov-de Haas-van Alphen (dHvA)) en-ables us to map out the Fermi surface of the bulk valence band states, in the energy range EF ∼ 20-60 meV. At
low Fermi energies, a downturn is observed in the an-gular dependence of the oscillations frequency between 0◦ and 90◦, demonstrating a bag-shaped closed Fermi
surface. Importantly, a single frequency dominates the FFT spectra regardless of the magnetic field orientation, showing that no camel-back structure is observed for en-ergies down to ∼ 24 meV. The existence of a camel-back structure for lower energies is hardly probable in respect to the experimental E(k) dependence, which points to a direct band gap. The Fermi surface anisotropy in-creases rapidly as the Fermi level goes higher in the va-lence band, and pipe-like structures previously reported at high energy are confirmed and attributed to trigo-nal warping. The apparent hole effective mass, defined in the parabolic band approximation, is obtained by temperature-dependent studies for B k c-axis, and lies in the 0.245 ± 0.015 m0range for EF ∼ 23 − 45 meV. High
magnetic fields measurement in the lowest density sam-ples enable us to approach the quantum limit for holes which is finally discussed.
II. QUANTUM OSCILLATIONS IN P-TYPE
Bi2Se3
A. Experimental details
The Bi2−δCaδSe3samples studied here were grown via
a process of two-step melting described in Ref. 11. By adding Ca, a transition to a p-type behavior is observed for x> 0.012,20 which is the regime our study focuses on. The samples presented here are referred to as B2, B3, B6, E2, and E1, and their main characteristics are summarized in Table I.21Magneto-transport experiments
were conducted on µm-thick slices on which silver paste contacts were deposited in a Hall bar-like or Van der Pauw configuration. Measurements were performed us-ing a standard low frequency lock-in technique in a vari-able temperature insert for temperatures ranging from 1.2 K to 40 K, up to magnetic fields of 30 T produced by a 20 MW resistive magnet. The data were initially symmetrized by changing the polarity of the magnetic field to check that contact misalignment had a negligi-ble impact on the analysis (notably the oscillation
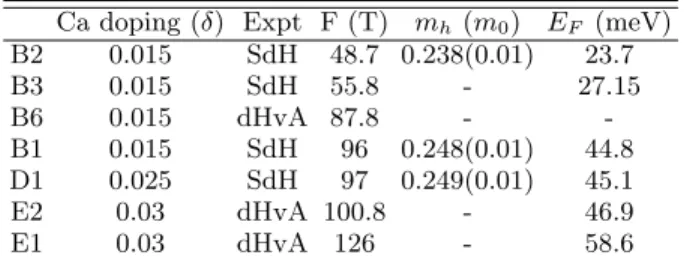
fre-Ca doping (δ) Expt F (T) mh(m0) EF (meV)
B2 0.015 SdH 48.7 0.238(0.01) 23.7 B3 0.015 SdH 55.8 - 27.15 B6 0.015 dHvA 87.8 - -B1 0.015 SdH 96 0.248(0.01) 44.8 D1 0.025 SdH 97 0.249(0.01) 45.1 E2 0.03 dHvA 100.8 - 46.9 E1 0.03 dHvA 126 - 58.6
TABLE I: Parameters of the Bi2Se3samples. Calcium doping level δ defined by Bi2−δCaδSe3, experimental technique used, quantum oscillation main frequency, apparent valence band effective mass (mh) and Fermi energy in the parabolic band approximation.
quency). For dHvA torque measurements, samples of thickness varying between 40 and 230 µm were mounted on a CuBe cantilever which forms the mobile plate of a capacitive torque meter. The torque signal was measured with a lock-in amplifier and a capacitance bridge using conventional phase sensitive detection at 5.3 kHz. The experiment was performed using a 16 T superconducting magnet and a dilution fridge, equipped with an in-situ rotation stage. The torque measurements, which typi-cally probe a larger number of particles, were employed to further confirm the domination of the bulk states in the present study.
B. Magnetic field dependence
Figure 1 shows representative quantum oscillations in the valence band for the two extreme carrier densities studied. In Fig. 1(a), we report on magneto-transport (SdH) data on sample B3, one of our lowest density sam-ples. Superimposed on a large monotonic background, oscillations of the resistivity reflect the oscillatory density of states of the system. The data in the upper left inset are obtained by subtracting a smoothed (moving window average) data curve. The resulting FFT is shown in the bottom right inset. It shows a clear single peak at about 55 T, consistent with the apparent absence of splitting in the data.
dHvA oscillations are shown for a sample with a higher carrier concentration (sample E1) in Fig. 1(b), where the torque signal τ is plotted as a function of the total mag-netic field for a tilt angle θ = 16◦. Small quantum os-cillations in τ , again on a large monotonous background, are clearly visible and reflect the oscillatory magnetiza-tion of the system. The dHvA oscillamagnetiza-tions can be better observed in the oscillatory torque (∆τ ), obtained with the same background removal procedure as for transport. Here also a single frequency is observed, at a higher value consistent with the higher carrier concentration of sample E1. We note that the results obtained with the two dif-ferent experimental techniques for a given carrier density are fully consistent.
3
FIG. 1: (color online) (a) Longitudinal resistance Rxx ver-sus total magnetic field in perpendicular configuration for a low-doped p-type Bi2Se3 sample (B3) at T = 1.2 K. Upper left inset: oscillatory resistance ∆Rxx. Lower right inset: fast Fourier transform of ∆Rxx(1/B). (b) Torque τ and oscilla-tory torque ∆τ (lower right inset) versus total magnetic field for θ = 16◦ in a highly-doped p-type Bi2Se3 sample (E1). (Upper left inset) Fourier transform of τ (1/B cos θ).
C. Temperature dependence
The temperature dependence of the SdH oscillations was measured for samples B1, D1, B2 and B3 between 1.3 K and 40 K for magnetic fields up to 30 T. In Fig. 2, we report typical results obtained on samples B1 and B2 up to 11 T, for temperatures between 1.3 K and 25 K. In the upper left inset, we plot the temperature depen-dence of the oscillation amplitude at the fixed magnetic field B = 9.6 T. The same type of data are reported in the lower-left inset for a lower concentration sample (B2) at a similar magnetic field (B = 10.6 T). The amplitude of the oscillations has not fully saturated at T = 1.3 K, suggesting a higher hole effective mass compared to the well-documented n-type samples6,9 in qualitative agree-ment with recent magneto-optics studies.10The tempera-ture damping of the oscillations can be well-described by
FIG. 2: (color online) Oscillatory magnetoresistance ∆Rxx versus total magnetic field parallel to the c-axis for different temperatures (1.4-17.5 K) in sample B1. Upper left inset: temperature dependence of ∆Rxx at a resistance extremum at B = 9.6 T. Lower left inset: temperature dependence of ∆Rxx at the resistance extremum at B = 10.6 T for sample B2.
the standard Lifshitz-Kosevich formalism22, valid in this case of 3D quantum oscillations of moderate amplitude. We extract the energy gap ∆, from which the apparent ef-fective mass of holes is defined, mh=(~eB)/∆ for a given
magnetic field B. The values reported in Table I corre-spond to an average value on the lowest magnetic fields data sets exploitable on wide enough temperature range (typically 8-10 T). The mass was found to be almost constant over the energy range studied, with a value of 0.245 ± 0.015 m0. This value is consistent with the values
obtained in a higher (but overlapping) energy range.13 A non-trivial field dependence was observed as the mag-netic field was increased,23but is beyond the scope of the
present paper where we aim at characterizing the (field-independent) hole Fermi surface. From the frequency F of the quantum oscillations discussed in the previous section, one can deduce the extremal Fermi surface cross-section in the momentum space, CS = πk2
F (where kF
is the Fermi wave vector), given by CS = 2πeF/~. In the case of an energy-independent effective mass in the B k c-axis configuration, the Fermi energy can be writ-ten EF = (~2CS)/(2πmh). Using this method, we have
determined the Fermi energies reported in Table I, which define the energy range (EF ∼ 20 to 60 meV) probed by
our experiment.
III. HOLE FERMI SURFACE
A. Doping and angular dependences
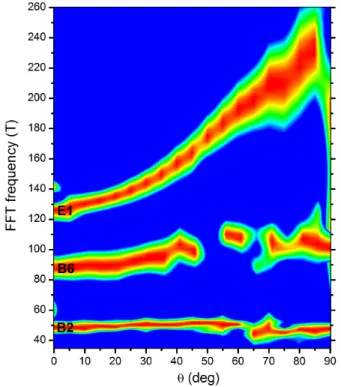
In Fig. 3, we report the angular dependence of the FFT of the quantum oscillations in a color map for three samples with different hole concentrations.
4
FIG. 3: (color online) Color plot : Normalized amplitude of the quantum oscillations 1/B Fourier transform as a function of the frequency and the tilt angle θ, for different samples. At each angle, the FFT signal is normalized to its maximal value (red color). The blue color corresponds to an intensity ≤ 70% of the maximum value.
The displayed color map is a linear extrapolation of an-gular dependent data taken with a 5◦step, where θ is the angle between the sample c-axis and the magnetic field. The FFT signals have been normalized to their maxi-mum value for each angle to focus only on the angular dependence.24 The frequency of the quantum oscillation
is directly related to the cross-section of the Fermi sur-face in k-space. As the sample is rotated in the magnetic field, the angular dependence of this cross-section can be traced and related to the Fermi surface’s geometry.
The overall observed non-monotonous behaviour of the frequency as a function of the tilt angle θ is character-istic of an anisotropic Fermi surface. At low energies (EF < 30 meV) the angular dependence is rather mild,
suggesting an almost isotropic Fermi surface. Anisotropy progressively develops with increasing Fermi energy and, for a frequency of 120 T at θ = 0◦, the θ = 90◦frequency approximatively doubles. It should be noted that a cos θ behavior, usually associated with a 2D system, was not observed in any sample even up to very high magnetic fields. This confirms that bulk states dominate both the transport and magnetization properties in samples of rel-atively large thicknesses. It is worth stressing that, as the system becomes anisotropic at high doping level, a com-plete angular dependence (0◦− 90◦at least) is absolutely
required to probe the dimensionality of the system (see
the example of graphite, a very anisotropic 3D system showing a cos θ behavior up to ∼ 70◦ , in Ref. 25).
At variance with previous results obtained on n-type Bi2Se3 in the low energy region of the conduction band
(EF < 30 meV), the cross section cannot be reproduced
accurately by assuming a purely ellipsoidal Fermi sur-face. A perhaps even more striking difference is the oc-currence of a downturn in the angular dependence above a density-dependent angle (e.g. θ ∼ 70◦ for sample B6). This demonstrates a “bag-shape” Fermi surface, where the cross section increases until it reaches the bag’s di-agonal axis from where it starts to decrease with further increasing the angle. A closer look at the low density data (sample B2) shows the downturn is also present on the apparently flat angular dependence (see section III B for a better representation). The intensity of the FFT signal (which can not be assessed in Fig. 3 because of the normalization) can to some extent also be informa-tive. The raw FFT intensity reflects a severe drop in the oscillation amplitude where the downturn in frequency appears, for example around θ = 60◦ for sample B2 and B3. The FFT signal then clearly reappears from θ = 75◦ to θ = 90◦.26 This drop in the amplitude may be
corre-lated to the downturn in the angular dependence. The FS strong curvature change in this region probably leads to the loss of the phase coherence of the oscillations. We note that the downturn appears at higher angle for higher density. Finally, our data in the high energy limit (sam-ple E1) are in good quantitative agreement with the pre-viously reported SdH measurements in high hole density samples. In particular, oscillations are lost for specific θ ranges (see e.g. the sudden drop in frequency from θ = 90◦), corresponding to open orbits in the momen-tum space. We attribute these open orbits to the pipes emerging in the Fermi surface at high carrier density in the presence of trigonal warping.27
B. Theoretical model and discussion
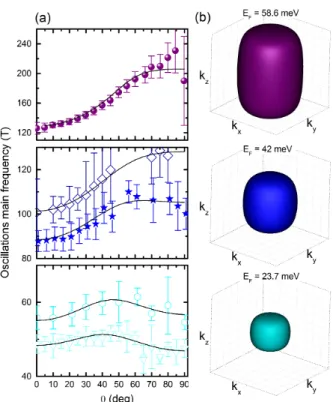
In Fig. 4(a), we report the angular dependence of the quantum oscillation main frequency (FFT maximum) for different hole doping levels. These are the same data as the ones in Fig. 3 with additional samples at intermedi-ate carrier concentrations. For each sample we computed the extremal cross-section of the Fermi surface in k-space from the F (θ) dependence. By assuming that the Fermi surface is closed and has rotational symmetry around the c-axis, the constant k⊥− kz energy surface, where kz is
parallel to the trigonal axis of the Brillouin zone (c-axis) and k⊥ = (k2x+ky2)1/2is in the plane perpendicular to kz,
was derived (not shown).28The θ angular dependence of
the Fermi radius was then fitted by solving an analytical E(k) dependence for each experimental Fermi energy re-ported in Table I. The empirical dispersion relation up to the k4order can be written as:29
5
FIG. 4: (color online) (left panels) Quantum oscillation fre-quency as a function of the tilt angle θ for different carrier con-centrations in the valence band. The error bar is defined to be the FFT width at 90% of the maximum signal. From bottom to top, sample B2 (SdH), B3 (SdH), B6 (dHvA), E2(dHvA) and E1(dHvA). Theoretical fits obtained by the analytical model of Eq.2 (see text) (solid lines). (Right panels) Fermi surfaces computed at EF = 23.7, 42, and 58.6 meV.
E(k) = C1k2⊥+ C2kz2+ C3k2⊥k 2
z+ C4k⊥4 + C5k4z
+C6kx(kx2− 3ky2) + C7kzky(k2y− 3k2x)
(1)
From symmetry considerations, E(k) = E(−k), which sets C6=0. Neglecting non-parabolicity effects at low
density leads to C4 = 0 and C5 = 0. The last term
accounts for the trigonal warping of the Fermi surface, which we neglect in our first approach. The simplified expression we used can therefore be written as:
E(k) = C1k⊥2 + C2kz2+ C3k⊥2kz2 (2)
where the numerical values of the coefficients C1, C2
and C3 are listed in the supplemental material, section
III. The theoretical F (θ) dependencies are plotted as solid lines on top of the experimental points in Fig. 4(a) and three computed Fermi surfaces are shown in Fig. 4(b). At low energy (sample B2), the downturn of the oscillation frequency is well reproduced, and clearly re-sults from the bag-shape nature of the Fermi surface. In this “squashed” ellipsoid the in-plane Fermi wave-vector kF is longer than along the c-axis, leading to a negative
anisotropy factor.30 As the density increases, the shift of the downturn to higher angles is due to the elongation of the Fermi surface along the vertical axis. The anisotropy changes its sign, becomes positive, and grows continu-ously with EF up to 1.4. It is illustrated by the oblong
Fermi surface of sample E2 at EF = 58.6 meV.
We now focus on the low energy limit valence band structure. In the presence of a strong spin-orbit coupling, the band inversion is expected to give rise to a camel-back structure, characterized by a local minimum at k = 0. This is reported in Figs. 5(a) and (b), where the dotted curves are the valence bands along k⊥ and kz obtained
for the 4 × 4 Hamiltonian of Zhang et al.2and its original
parameters. The camel-back is prominent with a band maximum occurring at finite kx≈ 0.07˚A−1 and a kx= 0
depth varying in theoretical works from about 80 meV2
to 140 meV.12
FIG. 5: (color online)(a) and (b) Valence band along kx,yand kz respectively. Experimental data (dots), parabolic disper-sion (solid lines) and camel-back model (dotted lines).
If the Fermi energy lies in the camel-back region, there should be no carriers around k⊥= 0 and the Fermi
sur-face should exhibit a “donut-like” shape. This should give two frequencies corresponding the the outer (maxi-mal) and inner (mini(maxi-mal) orbits, as well as a single fre-quency of a much smaller value around θ = 90◦. Our ob-servation of a single frequency around θ = 0◦ exhibiting moderate changes with the tilt angle suggests that there is no “camel-back” structure deeper than the lowest en-ergy investigated (∼ 23.7 meV). Let us now consider the case where the residual “camel back ” depth is lower than ∼ 23 meV . For our lowest Fermi energy, one would ex-pect a single oscillation frequency at low angles, splitting into two frequencies above a certain angle. The low angle frequency would correspond to an orbit along the hori-zontal cross section of a “dumbbell-like” Fermi surface, and the two frequencies at high angles would correspond to the two extremal transversal section of the dumbbell. The size of the frequency splitting at θ = 90◦ is in this case related to the depth of the “camel-back” structure. At variance with these expectations, our measurements reveals that a single oscillation frequency persists up to θ = 90◦. This shows that no camel back structure can be observed at all within our experimental resolution (our
6 FFT full-width-half-maximum at θ = 90◦is ∆F ∼ 13T).
The absence of the camel back structure can more generally be seen in figure 5(a), where the experimental points EF vs k⊥ are plotted, showing that camel-back
structure is experimentally absent. The k2⊥ approxima-tion used in Eq. 2 is justified by the good parabolic fit (red solid line) and the almost energy-independent mass measured experimentally with the temperature de-pendent studies mh = 0.24m0. In Fig.5(b), we plot the
experimental dispersion along kz obtained from our
sim-ulations. Importantly, the kzdispersion is far from being
parabolic, E(kz) showing a slower increase, in agreement
with the observation made in previous ARPES measure-ments focusing on the Γ − Z dispersion in the Brillouin zone.31 In contrast to the k
⊥ dispersion, higher order
terms (appearing in Eq. 1) are actually required. These conclusions are similar to the conduction band results obtained by K¨ohler et al.29, where the k4
⊥and k4z
param-eters were respectively C4= 0 and C5 6= 0, with C56= 0
and energy-dependent. We nevertheless did not consider this term in the data analysis as it improved the F (θ) curves plotted in Fig. 4(a) only slightly.
Our main observation that no camel-back structure is formed in the Bi2Se3valence band is in qualitative
agree-ment with other experiagree-mental work probing the bulk band structure of this compound.10,32This can be related
to the recent conclusion of GW numerical computations that the band gap of Bi2Se3is direct and reduced by the
electron-electron interaction.18,19
IV. HOLE TRANSPORT TOWARDS THE
QUANTUM LIMIT
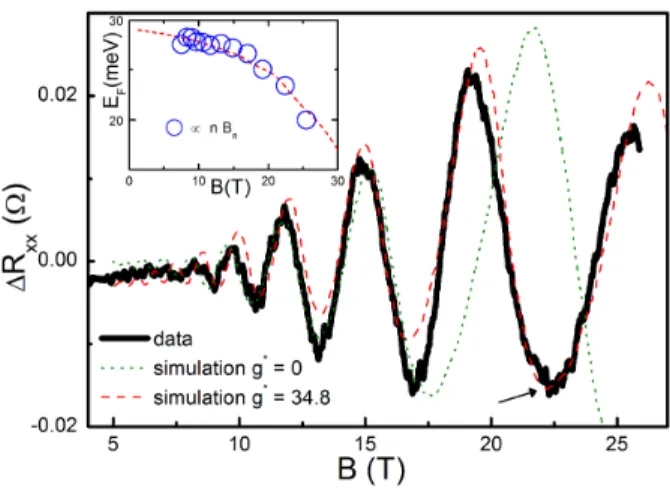
For the lowest density samples (B2 and B3), magneto-transport experiments have been extended to high mag-netic fields up to 30 T. Typical results are reported in Fig. 6 for sample B3. Simulations of the magnetoresis-tance were performed based on the simple phenomeno-logical approach developed for the conduction band,6,9in which one considers a 3D electron gas with a large (spin-orbit-enhanced) spin gap g∗ef fµBB, where g∗ is the
effec-tive hole g-factor. As can be seen in Fig.6 the measured (background-removed) oscillations exhibit a minimum at B ∼ 22.5 T, instead of the maximum expected from the g∗ = 0 (no spin-splitting) simulation based on the low field oscillation frequency (F = 55.8 T). One could ten-tatively attribute this additional minimum to a spin-split feature only visible in the lowest Landau level/highest magnetic fields. The temperature dependence however shows that the energy gaps associated with the consecu-tive minima follow a continuous trend21 and have
there-fore most likely the same origin. This suggests that Lan-dau levels of different orbital and spin quantum numbers nearly coincide in energy, with consequently no visible spin splitting in the quantum oscillations. A similar sce-nario is observed in n-type Bi2Se3 where the spin gap
is about twice the value of the cyclotron gap.6,9 In such
FIG. 6: (color online) Oscillatory magnetoresistance ∆Rxx versus total magnetic field at T = 1.2 K (solid line). Simula-tions for the g∗= 0 (dotted line) and g∗= 34.8 cases (dashed line). The arrow emphasizes the B = 22.5 T minimum. In-set: quantity proportional to the nBnvalue (blue circle), and simulated Fermi energy as a function of the magnetic field for g∗= 34.8 (dashed line) (see text)
cases the quantum limit is repelled to higher magnetic fields due to a large field-dependent spin splitting shift-ing down the Landau levels energies.
In the present case, when using the effective hole mass mh= 0.24m0determined in section II C, the best
simula-tion is obtained for a g-factor of g∗∼ 35 , for which spin-up and spin-down subbranches of the N and N + 4 Lan-dau level coincide. As can be seen in Fig.6, the agreement with the data is not perfect (small dephasing can be seen at low magnetic fields) suggesting that some more com-plex field dependencies of the band parameters should be considered for a better description. The high value of the effective hole g-factor is nevertheless confirmed by simply analyzing the magnetoresistance peaks positions. The so-called “1/B phase plots” show a severe deviation from linearity in high magnetic fields, which can be seen in the inset of Fig.6 where we focus on the product nBn
where n is an integer and Bn the magnetic field value
corresponding to the nth SdH extremum. SdH
oscilla-tions extrema occur when the ratio between the Fermi energy and the cyclotron gap (∝ B) equals n/2, and thus the product nBn is proportional to the Fermi
en-ergy value. The y-axis value of the blue circles in the inset of Fig.6 is proportional to the measured nBn value
and show that the Fermi energy is reduced in high mag-netic fields. This deviation is consistent with the Fermi energy drop expected in the presence of a high Zeeman energy, which is simulated by our model (dashed line). These observations stress, again, how crucial the contri-bution of the Zeeman energy is when conducting a phase oscillation analysis in such materials, in particular when searching for the (phase) signature of 2D surface carriers. Our results suggest that the effective g-factors could be similar in the bulk conduction and valence bands, which
7 should be confirmed by a more direct measurement in
p-type samples.
In conclusion, we have reported an energy-dependent study of the Bi2Se3 valence band based on quantum
os-cillations measurements in high magnetic fields and low temperatures. At low energies, a downturn observed in the oscillation frequency angular dependence reveals a bag-shaped closed hole Fermi surface. The absence of
a spin-orbit-coupling induced “camel back” structure in the dispersion relation is further demonstrated. As the Fermi energy increases, anisotropy rapidly develops in the hole Fermi surface.
We aknowledge support from EC-EuroMagNetII-228043. The material synthesis work was supported by the National Science Foundation (NSF) under grant number DMR-1255607.
1
S. K. Mishra, S. Satpathy, and O. Jepsen, Journal of Physics: Condensed Matter 9, 461 (1997).
2 H. Zhang, C.-X. Liu, X.-L. Qi, X. Dai, Z. Fang, and S.-C. Zhang, Nat Phys 5, 438 (2009), ISSN 1745-2473.
3
Y. Xia, D. Qian, D. Hsieh, L. Wray, A. Pal, H. Lin, A. Ban-sil, D. Grauer, Y. S. Hor, R. J. Cava, et al., Nat Phys 5, 398 (2009), ISSN 1745-2473.
4
Y. L. Chen, J. G. Analytis, J.-H. Chu, Z. K. Liu, S.-K. Mo, X. L. Qi, H. J. Zhang, D. H. Lu, X. Dai, Z. Fang, et al., Science 325, 178 (2009).
5
L. Fu and C. L. Kane, Phys. Rev. B 76, 045302 (2007). 6 H. K¨ohler, Phys. stat.sol. (b) 58, 91 (1973).
7 K. Eto, Z. Ren, A. A. Taskin, K. Segawa, and Y. Ando, Phys. Rev. B 81, 195309 (2010), URL http://link.aps. org/doi/10.1103/PhysRevB.81.195309.
8 B. Fauqu´e, N. P. Butch, P. Syers, J. Paglione, S. Wied-mann, A. Collaudin, B. Grena, U. Zeitler, and K. Behnia, Phys. Rev. B 87, 035133 (2013), URL http://link.aps. org/doi/10.1103/PhysRevB.87.035133.
9
S. Mukhopadhyay, S. Kr¨amer, H. Mayaffre, H. F. Legg, M. Orlita, C. Berthier, M. Horvati´c, G. Martinez, M. Potemski, B. A. Piot, et al., Phys. Rev. B 91, 081105 (2015), URL http://link.aps.org/doi/10.1103/ PhysRevB.91.081105.
10 M. Orlita, B. A. Piot, G. Martinez, N. K. S. Kumar, C. Faugeras, M. Potemski, C. Michel, E. M. Hankiewicz, T. Brauner, i. c. v. Draˇsar, et al., Phys. Rev. Lett. 114, 186401 (2015), URL http://link.aps.org/doi/10.1103/ PhysRevLett.114.186401.
11
Y. S. Hor, A. Richardella, P. Roushan, Y. Xia, J. G. Check-elsky, A. Yazdani, M. Z. Hasan, N. P. Ong, and R. J. Cava, Phys. Rev. B 79, 195208 (2009).
12
D. Hsieh, Y. Xia, D. Qian, L. Wray, J. H. Dil, F. Meier, J. Osterwalder, L. Patthey, J. G. Checkelsky, N. P. Ong, et al., Nature 460, 1101 (2009), ISSN 0028-0836.
13
Y.-B. Gao, B. He, D. Parker, I. Androulakis, and J. P. Heremans, Phys. Rev. B 90, 125204 (2014), URL http: //link.aps.org/doi/10.1103/PhysRevB.90.125204. 14 P. Larson, V. A. Greanya, W. C. Tonjes, R. Liu, S. D.
Ma-hanti, and C. G. Olson, Phys. Rev. B 65, 085108 (2002), URL http://link.aps.org/doi/10.1103/PhysRevB.65. 085108.
15
D. Parker and D. J. Singh, Phys. Rev. X 1,
021005 (2011), URL http://link.aps.org/doi/10.1103/ PhysRevX.1.021005.
16
K. W. Post, B. C. Chapler, L. He, X. Kou, K. L. Wang, and D. N. Basov, Phys. Rev. B 88, 075121 (2013), URL http: //link.aps.org/doi/10.1103/PhysRevB.88.075121. 17
L. J. Sandilands, A. A. Reijnders, M. Kriener, K. Segawa, S. Sasaki, Y. Ando, and K. S. Burch, Phys. Rev. B 90, 094503 (2014), URL http://link.aps.org/doi/10.1103/ PhysRevB.90.094503.
18
O. V. Yazyev, E. Kioupakis, J. E. Moore, and S. G. Louie, Phys. Rev. B 85, 161101 (2012).
19 I. Aguilera, C. Friedrich, G. Bihlmayer, and S. Bl¨ugel, Phys. Rev. B 88, 045206 (2013), URL http://link.aps. org/doi/10.1103/PhysRevB.88.045206.
20 Z. Wang, T. Lin, P. Wei, X. Liu, R. Dumas, K. Liu, and J. Shi, Applied Physics Letters 97, 042112 (2010). 21
A complete description of the transport properties is pre-sented in the supplemental material, section I.
22
I. Lifshitz and A. Kosevich, Zh. Eksp. Teor . Fiz. 29, 730 (1955), [Sov. Phys. JETP 2, 636 (1956)].
23 See the supplemental material, section I.B. 24
Details on the FFT procedure can be found in the supple-mental material, section II.A.
25 J. M. Schneider, B. A. Piot, I. Sheikin, and D. K. Maude, Phys. Rev. Lett. 108, 117401 (2012), URL http://link. aps.org/doi/10.1103/PhysRevLett.108.117401. 26 See the supplemental material, section II.B. for more
de-tails. 27
See the supplemental material, section II.C. for more de-tails.
28 F. M. Mueller, Phys. Rev. 148, 636 (1966), URL http: //link.aps.org/doi/10.1103/PhysRev.148.636. 29
H. K¨ohler and H. Fischer, Phys. Stat. Sol. (b) pp. 349–357 (1975).
30
The evolution of the anisotropy as a function of the Fermi energy is reported in the supplemental material, section III.
31
V. A. Greanya, W. C. Tonjes, R. Liu, C. G. Olson, D.-Y. Chung, and M. G. Kanatzidis, Journal of Applied Physics 92, 6658 (2002), URL http://scitation.aip.org/ content/aip/journal/jap/92/11/10.1063/1.1517748. 32
I. A. Nechaev, R. C. Hatch, M. Bianchi, D. Guan, C. Friedrich, I. Aguilera, J. L. Mi, B. B. Iversen, S. Bl¨ugel, P. Hofmann, et al., Phys. Rev. B 87, 121111 (2013), URL http://link.aps.org/doi/10.1103/PhysRevB.87. 121111.