HAL Id: hal-01203480
https://hal.sorbonne-universite.fr/hal-01203480
Submitted on 23 Sep 2015
HAL is a multi-disciplinary open access
archive for the deposit and dissemination of
sci-entific research documents, whether they are
pub-lished or not. The documents may come from
teaching and research institutions in France or
abroad, or from public or private research centers.
L’archive ouverte pluridisciplinaire HAL, est
destinée au dépôt et à la diffusion de documents
scientifiques de niveau recherche, publiés ou non,
émanant des établissements d’enseignement et de
recherche français ou étrangers, des laboratoires
publics ou privés.
shell-selective recognition properties
S. Gam-Derrouich, C. Bourdillon, Daney de Marcillac Willy, Laurent Coolen,
Agnès Maître, C. Mangeney, Catherine Schwob
To cite this version:
S. Gam-Derrouich, C. Bourdillon, Daney de Marcillac Willy, Laurent Coolen, Agnès Maître, et al..
Quantum dot-imprinted polymers with size and shell-selective recognition properties. Chemical
Com-munications, Royal Society of Chemistry, 2015, 51, pp.14933-14936. �10.1039/C5CC05203C�.
�hal-01203480�
Journal Name
COMMUNICATION
a.Sorbonne Universités, UPMC Univ Paris 06, UMR 7588, Institut de NanoSciences de Paris (INSP), F‐75005, Paris, France ; CNRS, UMR 7588, Institut de NanoSciences de Paris (INSP), F‐75005, Paris, France. b.Univ Paris Diderot, Sorbonne Paris Cité, ITODYS, UMR 7086 CNRS, 15 rue J‐A de Baïf, 75205 Paris Cedex 13, France.Address here. Electronic Supplementary Information (ESI) available: Preparation of bulk QD@IPs. Functionalization and characterization of QDNH2, fluorescence spectra of QD@IPs, NIP films and QDsize. TEM images of QDsize and QDs. See DOI: 10.1039/x0xx00000x Received 00th January 20xx, Accepted 00th January 20xx DOI: 10.1039/x0xx00000x www.rsc.org/Quantum dots‐imprinted polymers with size and shell‐selective
recognition properties
S. Gam‐Derouich
a*, C. Bourdillon
a, W. Daney De Marcillac
a, L. Coolen
a, A. Maître
a, C. Mangeney
b*
and C. Schwob
a*
The emergence of nanotechnology has stimulated a great deal of research to detect engineered nanoparticles spread out in the environment. We address this issue here by designing quantum‐ dots imprinted polymers for the speciation of nanoparticles based on their size, shape and surface chemistry.
The development of appropriate tools for the detection of manufactured nanoparticles disseminated in the environment has become an important societal challenge driven by the ubiquity of nanoparticles in everyday products and innovative technologies. If a large number of methods have been reported for the sensing of small molecules or macromolecules, the implementation of sensitive and selective methods for the detection of nanoparticles is still in its infancy. Current analytical techniques rely on electron microscopy, dynamic light scattering, 1 coulter counters, 2 centrifuge particle size analysis3 or electrochemical detection,4 which mainly differentiate nanoparticles on the basis of their size and shape. However, similar nanoparticles exhibiting different coatings are generally not distinguishable using these techniques. Moreover, these analytical methods are expensive and for most of them unsuitable for field analysis.
To afford a real speciation of nanoparticles and differentiate nanoparticles with various size, shape and surface chemistry, recent works reported the use of two‐dimensional or surface‐imprinted polymers.5‐7 The imprinting concept consists in creating cavities of roughly the same size and shape as that of the template on the surface or in the bulk of a chemical matrix.8‐15 These cavities formed in the polymer are complementary, both sterically and chemically to the template. It is inspired by the “lock & key” principle used by enzymes for substrate recognition. For nanoparticles, this
involves the formation of a polymer matrix where nanoparticles are imprinted, followed by their removal to form cavities, which match their size, shape and chemical functionalities. The matrix is then able to selectively reuptake the removed nanoparticles. For example, the group of Lieberzeit used sedimentation surface imprinting in combination with mass‐sensitive measurements on quartz crystal microbalance to detect Ag nanoparticles.5 In another example, the group of Mandler used the Langmuir‐Blodgett technique to transfer gold nanoparticles concomitantly to polyaniline or cellulose acetate monolayers onto a conducting indium‐doped tin oxide support.6‐7 The gold nanoparticles were then dissolved by electrochemical oxidation, leaving nanocavities embedded in the polymer film, which fit the size and shape of the etched nanoparticles. This strategy afforded ultra‐thin layers (1 to 5 nm) of nanoparticle‐imprinted polymers for size and shell‐selective recognition of nanoparticles. In their study, the authors observed that the shell and size exclusion properties of these nanoparticle‐ imprinted polymers improve with the number of layers, that is, the depth of the cavities. Therefore, bulk imprinting of nanoparticles would be expected to further improve their selective recognition properties. Nevertheless, to the best of our knowledge, the concept of nanoparticle‐imprinted polymers has been confined to surface‐imprinting and has never been extended to bulk‐imprinting so far. We address this issue in the present work by elaborating bulk quantum‐dot imprinted polymers and evaluating their size and shell‐ selective recognition properties. Colloidal quantum dots (QDs) were chosen here to provide a simple proof‐of‐concept of bulk nanoparticle‐imprinting strategy because their intense and stable photoluminescence16,17 allows a clear demonstration of the QDs uptake but the method could be extended to non‐ fluorescent nanoparticles. Moreover, it is worth mentioning that these QDs have stimulated both tremendous research efforts these past years for applications in biology and medicine18 and a great deal of concern about their potential hazards due to their heavy‐metal content.19 The selective recognition of QDs is therefore important from clinical and
COMMUNICATION
Journal Name
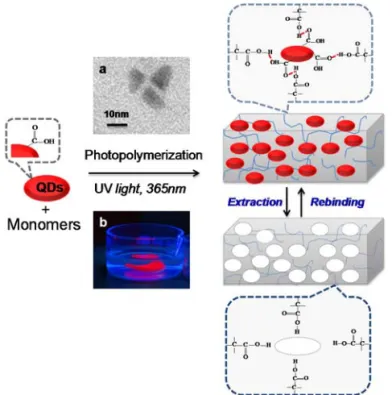
health viewpoints. Carboxyl‐functionalized QDs were chosen as the template in order to favour strong hydrogen bonds between the imprinted polymer matrix and the QD templates. The QD templates used in this work are commercially‐available colloidal carboxyl‐functionalized CdTeSe/ZnS quantum dots with a fluorescence peak maximum at 702 nm and width at half maximum of 60 nm. They display an elongated shape with an average length L of ca. 10 nm and a small axis d of ca. 5 nm (see TEM image in Fig. 1a).
Fig. 1. Schematic illustration of the elaboration of bulk QDs‐imprinted
polymers QD@IPs. (a) TEM image of the QDs tem‐plates and (b) photography under UV light (at 254 nm) of bulk as‐synthesized QD@IPs immersed in distilled water.
The bulk QDs‐imprinted polymers (QD@IPs) were prepared by photopolymerization of a prepolymer mixture composed of methacrylic acid (MAA) as the functional monomer, ethylene glycol dimethacrylate (EGDMA) as the cross‐linker and azobis‐ isobutyronitril (AIBN) as a photoinitiator, in the presence of QDs (see illustration in Fig. 1). The QDs were then removed from the polymer matrix by immersing the QD@IPs in aqueous acetic acid, breaking the interactions between the target QDs and the imprinted cavity. A reference non‐imprinted polymer sample (NIP) was prepared using the same procedure, but without addition of the QD templates (see details of the experiments in the supporting information).
As‐synthesized macrogels of QD@IPs display a homogeneous and intense photoluminescence under UV light (at 254 nm) testifying to the incorporation of QDs within the whole nanocomposite gel (see Fig. 1b). After incubation in acetic acid for 5 hours, the luminescence of the gel was observed to decrease starkly, demonstrating the efficient release of the QDs from the polymer matrix. [R2‐1] To characterize the structural parameters of QD@IPs and
estimate the porosity of the polymer matrix after extraction of the QDs, the equilibrium degree of swelling of QD@IPs and NIP was measured (see details in supporting information). From these experiments, the mesh size ()11, corresponding to the size of the nanopores inside the polymer matrix, could be deduced. A value of ca. 71 Å was estimated for QD@IPs and 48 Å for NIP. As the small axis of the QDs template (d ≈ 50 Å) is inferior to the mesh size of QD@IPs, their diffusion in the polymer network is possible, enabling the QDs to move through the free spaces between the polymer chains.
In order to perform reproducible optical characterizations, we prepared layers of QD@IPs and NIP on 2x2 cm² PMMA plates. For this purpose, a 30 µL droplet of the prepolymerization solution was fully spread on the PMMA plate and let to polymerize. By weighing the sample before and after QD@IP formation, we estimated the QD@IP layer weight to 3.5 mg, so that ca. 5,22 nmol of QDs per gram of polymer have been incorporated in the matrix. The luminescence spectra were then recorded on several portions of the obtained samples. The spectra were identical in peak position and width for different portions of a given sample (with ±15% intensity variations indicating inhomogeneities of the polymer film thickness). To reduce the uncertainty due to these variations, all spectra displayed in the following are the result of the average of seven measurements on different areas of the samples. Fig. 2 shows representative photoluminescence spectra of a QD@IPs film, before and after removal of the QDs templates. It should be noted that the spectra were normalized by the fluorescence intensity maximum value before extraction of the QDs templates. The luminescence spectrum of the NIP matrix was also recorded as a reference.
Fig. 2. Photoluminescence spectra of QD@IPs before (full line) and after
(dashed line) extraction of the QDs in acetic acid and the reference NIP (dash‐dotted line).
Its signal is very weak in the 600‐800 nm domain with a small peak appearing below 600 nm (the blue‐side tail of this peak is cut by a 520 nm high‐pass optical filter). For the QD@IPs spectrum before QDs removal, the peak at 689 nm corresponds to the fluorescence of the QDs within the polymer matrix (and). Interestingly, this band is blue‐shifted compared to the fluorescence of free QDs, which display a λmax = 702 nm
(see Fig. S1), underlying the presence of chemical interactions between the polymer matrix and the nanoemitters. After the acetic acid treatment, the QD@IPs spectrum (dotted line) is reduced by 90 %, showing that almost all of the QDs are extracted using this soft chemical procedure.
The recognition properties of QD@IPs were investigated by measuring the uptake of QDs in water over a range of concentrations from 8.10‐8 to 6.10‐6 mol.L‐1 (see Fig. 3). After uptake of the QDs and gentle washing with water, the fluorescence intensity of the main emission band at 689 nm was recorded and plotted as a function of QDs concentration. All the spectra were normalized by the fluorescence intensity maximum value corresponding to the QD@IP before extraction of the QDs templates. One observes a progressive increase of the fluorescence intensity at 689 nm with rising concentration of QDs, indicating the efficient uptake of QDs by the imprinted polymer film. It is worth noting that the same sample was used for the measurement at five concentrations, with QDs extraction in acetic acid between each measurement: it is remarkable that almost all of the QDs are eliminated by immersion in acetic acid, even after the fifth QDs uptake‐extraction cycles (see Fig. S2). This shows the robustness of the sample and holds promising prospects for reproducible QD@IPs applications.
Fig. 3. Photoluminescence spectra showing the uptake of QDs by QD@IPs
over a range of concentrations from (a) 8.10‐8; (b) 1.10‐7; (c) 4.10‐7; (d) 1.10‐6;
(e) 6.10‐6 mol.L‐1. The dashed line corresponds to QD@IPs after extraction of
the QDs templates. In inset are shown the corresponding images under UV light of QD@IPs and the plots of the fluorescence intensity maxima versus [QDs] for QD@IPs and NIP.
A plateau value was reached at ca. 10‐6 M (see insert in Fig. 3) indicating a saturation of all the recognition sites. The height of this plateau (1 in normalized intensity) is almost the same as the amplitude of the peak recorded on the as‐synthesized QD@IPs (see Fig. 2), indicating that all the QDs sites which were created during the QD@IPs synthesis are now occupied again after QDs uptake. In contrast, the fluorescence intensity
detected on the NIP films after QDs uptake remains very low whatever the QDs concentration (see Fig. S3). Moreover, the QDs emission band appears at the same wavelength as the one observed for free QDs (max = 702 nm) confirming the poor affinity of the non‐imprinted polymer matrix towards the QDs.
The selectivity of QD@IPs was investigated by evaluating their ability to discriminate between different populations of QDs. The first population, labelled QDsize was made of similar commercial carboxyl‐functionalized CdTeSe/ZnS QDs differing in size compared to the initial template QDs (see Fig. S5): they display an average length L of ca. 18 nm and a small axis d of
ca. 7 nm, leading to a red‐shifted emission wavelength at 780
nm. The other sample, labelled QDNH2, consisted of the same QDs as the initial template, functionalized with amino end groups (with a fluorescence peak maximum at 702 nm; see details of functionalization and characterization of QDNH2 in the supporting information). QD@IPs were first synthesized using the initial QDs. QDsize and QDNH2 were then used separately as analytes during uptake by the QD@IPs. Fig. 4 shows three independent reuptake experiments using the same QD@IPs after incubation with the various types of QDs. The selectivity appears to be remarkable as there is a large difference between the reuptake of the template QDs and the other nanoparticles, QDsize and QDNH2. Indeed, the intensity of the fluorescence emission band is around 6 times lower for the uptake of QDsize and QDNH2 than for the initial QDs, and of the same order of magnitude as for the non‐selective QD incorporation by the NIP. Moreover, when the QD@IPs were incubated in an aqueous mixture of QDsize and the original QDs templates, 2 M/2 M (see Fig. 4a), the fluorescence spectrum retains the main characteristic of the QDs analytes, with only a small shoulder at 780 nm due to the closely related QDsize. In comparison, the luminescence spectrum of the QDs+QDsize solution shows two peaks of close amplitudes confirming that the two QDs populations emit with similar efficiencies (See Fig. S3).
COMMUNICATION
Journal Name
Fig. 4. Fluorescence spectra of QD@IPs after incubation with (a) QDsize alone
(dashed line) at 1 M or a mixture of QDs and QDsize (full line) at 2 M/2 M.
The dash‐dotted line correspond to the fluorescence of QD@IPs after extraction of the templates in aqueous acetic acid; (b) QDNH2 (dashed line) or
QDs templates (full line) at 1M.
These results highlight the capacity of QD@IPs to discriminate between various kinds of QDs, even in a mixture of closely related QDs. This high selectivity is presumably due to a tight entrapment of the QDs within the polymer matrix during the synthesis of QD@IPs, resulting in cavities retaining the shape and surface chemistry memory of the template QDs. These nanocavities could therefore not accommodate particles with different sizes and presumably did not interact strongly with particles exhibiting a different surface chemistry, which therefore were washed away.
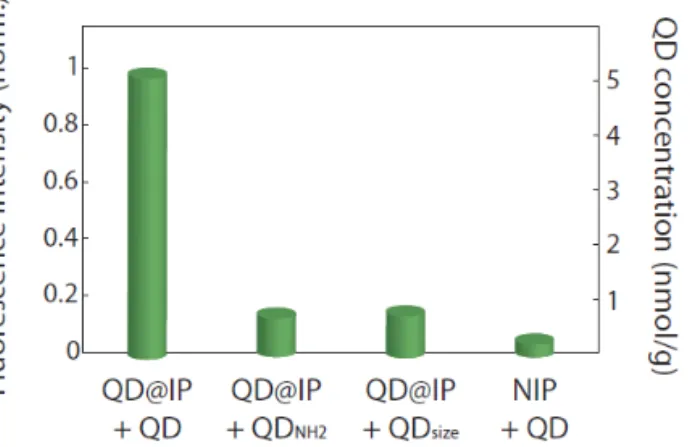
Figure 5 summarizes these results and compares the re‐ uptake of the various kinds of QDs by the QD@IPs and the NIP reference. The fluorescence intensities (left axis) were converted to a concentration of QDs incorporated in the polymer mass (right axis, in nmol/g), knowing that the initial sample (QDs concentration of 5.22.10‐9 mol/g) shows a peak amplitude normalized to 1 (Fig. 2). From this plot, it is clear that the QDs templates are specifically and selectively recognized by the imprinted polymer nanocomposites.
Fig. 5. Efficiencies of the QDs uptake, in normalized fluorescence
intensity (left axis) and in QDs concentration inside the polymer (right axis, nmol.g‐1), after immersion in a 1µM solution of QDs, QD
size and
QDNH2, for the QD@IPs and the NIP.
In summary, bulk quantum‐dots imprinted polymers were de‐signed by imprinting QDs functionalized by carboxylic acid groups in a poly(MAA‐co‐EGDMA) matrix and removing them using a soft acetic acid treatment. The recognition ability of QD@IPs was demonstrated by photoluminescence spec‐ troscopy after exposing it to the original QDs. The QD@IPs was shown to efficiently uptake the QDs, which remain in the nanocavities after the QD@IPs has been washed. This observation evidences the existence of attractive interactions between the target QDs and the matrix, due presumably to
hydrogen bonding. The selectivity properties of the QD@IPs were demonstrated using two different populations of QDs varying in size and shell chemistry. These closely related QDs were almost not uptaken by the QD@IPs. These results emphasize the importance of the template structure for the recognition of the imprinted nanoparticles by the QD@IPs, with excellent size and shell‐exclusion recognition properties.
This work was supported by French state funds managed by the ANR within the Investissements d'Avenir programme under reference ANR‐11‐IDEX‐0004‐02, and more specifically within the framework of the Cluster of Excellence MATISSE and by the Direction Générale des Armées (ANR‐DGA “Calypso” and part of the financial support of Céline Bourdillon’s PhD. ANR (Agence Nationale de la Recherche) and CGI (Commissariat à l’Investissement d’Avenir) are also gratefully acknowledged for their financial support of this work through Labex SEAM (Science and Engineering for Advanced Materials and devices) ANR 11 LABX 086, ANR 11 IDEX 05 02.
Notes and references
1 E. Eiser, Multi Length‐Scale Characterisation, (Eds.:D. W. Bruce, D. O’Hare, R. I. Walton), John Wiley & Sons, Ltd, Chichester, 2014, 233–282.
2 R. R. Henriquez, T. Ito, L. Sun and R. M. Crooks, Analyst, 2004, 129, 478 –482. 3 J. M. Slocik, M. O. Stone and R. R. Naik, Small, 2005, 1, 1048– 1052. 4 (a) Y.‐G. Zhou, N. V. Rees and R. G. Compton, Angew. Chem. Int. Ed., 2011, 50, 4219–4221; (b) X. Y. Xiao and A. J. Bard, J. Am. Chem. Soc., 2007, 129, 9610‐9612.
5 P. A. Lieberzeit, C. Jungmann and L. Schranzhofer, Procedia
Eng., 2014, 87, 236‐239.
6 S. Kraus‐Ophir, J. Witt, G. Wittstock and D. Mandler, Angew.
Chem. Int. Ed., 2014, 53, 294‐298.
7 N. Bruchiel‐Spanier and D. Mandler, ChemElectroChem, 2015.
8 K. Haupt and K. Mosbach, Chem. Rev., 2000, 100, 2495‐2504. 9 O. Y. F. Henry, D. C. Cullen and S. A. Piletsky, Anal. Bioanal.
Chem., 2005, 382, 947‐956.
10 J. Wackerlig and P. A. Lieberzeit, Sens. Actuators B, 2015,
207, 144–157.
11 N. Griffete, H. Frederich, A. Maître, S. Ravaine, M.M. Chehimi and C. Mangeney, Langmuir, 2012, 28 , 1005‐1012. 12 N. Griffete, H. Frederich, A. Maitre, C. Sch, S Ravaine,
B.Carbonnier, MM. Chehimi and C. Mangeney, J. Colloid Interface Sci, 2011, 364, 18.
13 R. Ahmad, N. Félidj, L. Boubekeur‐Lecaque, S. Lau‐Truong, S. Gam‐Derouich, P. Decorse, A. Lamouri and C. Mangeney,
Chem. Commun., 2015, 51, 9678‐9681.
14 N. Maouche, M. Guergouri, S. Gam‐Derouich, M. Jouini, B. Nessark and M.M. Chehimi, J. Electroanal. Chem., 2012, 685, 21‐27.
15 Z. Adali‐Kaya, B. Tse Sum Bui, A. Falcimaigne‐Cordin and K. Haupt, Angew. Chem. Int. Ed., 2015, 54, 5192‐5195.
16 Y. Zhou, Z. Qu, Y. Zeng, T. Zhou and G. Shi, Biosens.
Bioelectron., 2014, 52, 317‐323.
17 F. Wei, Y. Wu, G. Xu, Y. Gao, J. Yang, L. Liu, P. Zhou and Q. Hu, Analyst, 2014, 139 , 5785‐5792.
18 I. L. Medintz, H. T. Uyeda, E. R. Goldman and H. Mattoussi,
Nat. Mater., 2005, 4, 435‐446.