HAL Id: hal-02067954
https://hal.archives-ouvertes.fr/hal-02067954
Submitted on 14 Mar 2019
HAL is a multi-disciplinary open access
archive for the deposit and dissemination of
sci-entific research documents, whether they are
pub-lished or not. The documents may come from
teaching and research institutions in France or
abroad, or from public or private research centers.
L’archive ouverte pluridisciplinaire HAL, est
destinée au dépôt et à la diffusion de documents
scientifiques de niveau recherche, publiés ou non,
émanant des établissements d’enseignement et de
recherche français ou étrangers, des laboratoires
publics ou privés.
Olfactive robot for gas discrimination over several
months using a new optoelectronic nose
Pierre Maho, Carlos Dolcinotti, Thierry Livache, Cyril Herrier, Anton
Andreev, Pierre Comon, Simon Barthelme
To cite this version:
Pierre Maho, Carlos Dolcinotti, Thierry Livache, Cyril Herrier, Anton Andreev, et al.. Olfactive
robot for gas discrimination over several months using a new optoelectronic nose. ISOEN 2019
- 18th International Symposium on Olfaction and Electronic Nose, May 2019, Fukuoka, Japan.
�10.1109/ISOEN.2019.8823405�. �hal-02067954�
Olfactive robot for gas discrimination over several
months using a new optoelectronic nose
Pierre Maho
1, Carlos Leonardo Dolcinotti
1, Thierry Livache
2, Cyril Herrier
2,
Anton Andreev
1, Pierre Comon
1, and Simon Barthelmé
*,11
CNRS, GIPSA-Lab, Univ. Grenoble Alpes, F-38000 Grenoble, France
2Aryballe Technologies, 38000 Grenoble, France
Abstract—A new optoelectronic nose has recently been de-veloped using, for the first time, Surface Plasmon Resonance Imaging. Initial studies indicate that the instrument is very promising, and can detect and recognise a large variety of volatile organic compounds (VOCs) even with very limited sampling time. In this paper, we investigate its use as a continuous monitoring system under real-life conditions, recognising VOCs over several months. To this end, we present a robot-based platform which allows fast, realistic and repeatable measurements of several VOCs. We have generated a substantial data set over several months and under different environmental conditions. Results show that the device can be used to recognise VOCs with high reliability, even when training and testing sessions are months apart. The results are quite encouraging for further studies.
Index Terms—olfactive robot, gas discrimination, drift, open sampling, fast sampling
I. INTRODUCTION
A new electronic nose (eNose) featuring low specificity and a fast response has recently been developed [1]. The technology of this promising tool is based on the use of peptides as sensing materials coupled with Surface Plasmon Resonance imaging (SPRi) as the transduction method. With this technique, up to hundreds of chemical sensors could be used on a single chip, overcoming one of the main weak-nesses of established eNoses. The instrument has already been successfully evaluated in quite controlled environments [1]. However, it must be still usable in non-lab conditions to fully fulfill the expectations of an eNose.
From this viewpoint, mobile robot olfaction is an interesting domain of application. Initiated almost 30 years ago, [2], robot olfaction aims at equipping a robot with chemical sensors, to enable olfactory measurements over a whole area. Among other issues, research in this field has examined real-time monitoring [3], gas distribution mapping [4] and source localization [5]. Robot olfaction has indisputably had a great impact for getting the eNose out of the lab, making it a good field to test this new tool.
To this end, we have designed a robot-based system which provides fast, realistic and repeatable measurements. We have acquired a significant data set over 5 months and under various environmental conditions, in which 3 volatile organic compounds (VOCs) must be detected and discriminated. After introducing a processing pipeline to extract information from the raw recordings, we have assessed the classification per-formance obtained by the system. Results, both considering
This work was supported by the FUI-WISE AAP21 minalogic project, BPI. *Corresponding author:[email protected]
each data set individually and the whole dataset after drift correction, indicate excellent discrimination performance, even in this unfavourable scenario.
II. EXPERIMENTAL SETUP
A. Electronic nose
The eNose used here is based on the technology described in [1], [6] and is provided by Aryballe Technologies. A chemical sensor is a molecule which is fixed over the golden surface of a prism. When a VOC is brought above the surface by an airflow, it interacts with the molecule through a reversible binding reaction. This interaction is measured using SPRi. Briefly, a light is sent, reflected by the surface and caught by a simple camera. When interaction occurs with the molecule, this changes the refraction index leading to a change in reflectivity.
Our eNose is equipped with 26 different molecules, each of them repeated 2 or 3 times on the surface, leading to 63 chemical sensors, an uncommon number since the usual one in the literature is closer to the dozen [7].
B. Open sampling system
The open sampling system consists of a line follower robot, a flat surface where VOCs are placed and the previously introduced eNose. The ground is a 1m × 1m × 2.5mm polycrystal plate which is 1.5cm lifted. 4 small cups, of 2.5cm diameter, are designed with a 3D-printer and are slid below the plate in order to deposit the VOC in liquid phase. Then, a 60cm × 60cm square path is drawn on the plate near the VOC locations. Finally, the eNose is mounted on the mobile robot and equipped with a 3D-printed funnel in order to increase the suction area. The platform is presented in figure 1. Despite its simplicity, it allows a fast VOC sampling, as shown in figure 2, as well as realistic and repeatable measurements.
Several sources of unpredictable variability are expected such as: the environmental conditions (temperature, humid-ity) which are not controlled, the VOC diffusion, the VOC concentrations which are neither controlled nor measured, the change of the reference gas, the absence of plateau, etc. C. Data sets
For this study, we used citral (152.24 g/mol), β-pinene (136.23 g/mol) and geranyl acetate (196.29 g/mol) as pure VOCs and a volume of around 250µL of their liquid solutions is put in 3 cups. A fourth cup is left empty as a control. Concerning some of the other settings, the eNose frequency
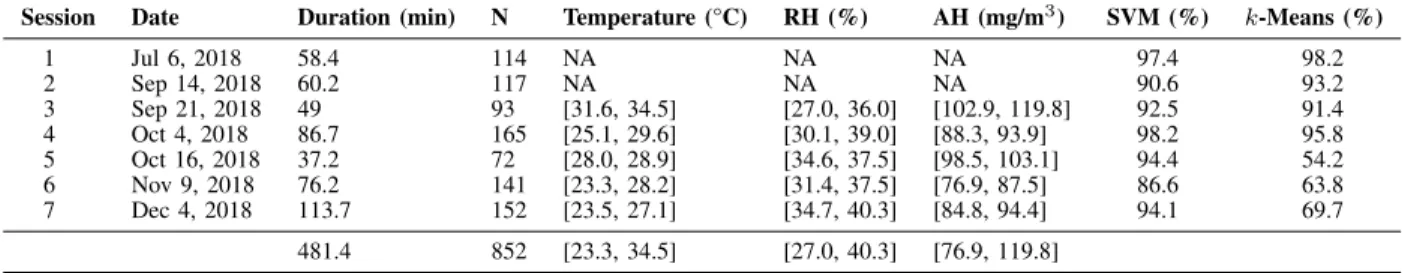
Session Date Duration (min) N Temperature (°C) RH (%) AH (mg/m3) SVM (%) k-Means (%) 1 Jul 6, 2018 58.4 114 NA NA NA 97.4 98.2 2 Sep 14, 2018 60.2 117 NA NA NA 90.6 93.2 3 Sep 21, 2018 49 93 [31.6, 34.5] [27.0, 36.0] [102.9, 119.8] 92.5 91.4 4 Oct 4, 2018 86.7 165 [25.1, 29.6] [30.1, 39.0] [88.3, 93.9] 98.2 95.8 5 Oct 16, 2018 37.2 72 [28.0, 28.9] [34.6, 37.5] [98.5, 103.1] 94.4 54.2 6 Nov 9, 2018 76.2 141 [23.3, 28.2] [31.4, 37.5] [76.9, 87.5] 86.6 63.8 7 Dec 4, 2018 113.7 152 [23.5, 27.1] [34.7, 40.3] [84.8, 94.4] 94.1 69.7 481.4 852 [23.3, 34.5] [27.0, 40.3] [76.9, 119.8]
Table I: Information about the data sets studied in this paper. NA values are due to the absence of the sensors at the recording date. RH and AH respectively stand for Relative Humidity and Absolute Humidity. See the main text for the classification results.
Citral β-Pinene Geranyl Acetate Control Robot sampling 3-phase manual sampling
0 20 40 60 0 1 2 3 0.0 0.1 t (s) Re flectivit y (%) 0 1 2 0 25 50 75 t (min) Re flectivit y (%)
Fig. 1: The open sampling system. A video showing the robot in motion is available here: https://barthesi.gricad-pages.univ-grenoble-alpes.fr/wise/.
Fig. 2: comparison between a classical 3-phase sampling and sampling using our setup. Each colored line corresponds to the output of one chemical sensor. In this example, we used citral as the injected VOC.
Fig. 3: A raw recording (blue) and the short term drift estimation (red) for one chemical sensor. The first value has been subtracted.
sampling is 5Hz, the robot speed is set between 2 and 3 cm/s and the pump flow is 45mL/min.
Over a period of 5 months, we have generated 7 data sets in order to assess both the ability of the eNose to discriminate over one data set, and its ability to generalize over other data sets across time. The cups are refilled before each session.
All the information concerning these data sets is gathered in Table I (the associated classification results are detailed later in the paper).
III. DATA PROCESSING
A. Intra dataset
This section presents and summarizes all the processing steps that take place between the raw recording and the extracted signatures. In this section we consider only one data set (ie one line of Table I).
1) Short term drift correction: Figure 3 shows a classical raw recording for one chemical sensor, demonstrating a short term sensor drift. This drift is quite common when using chemical sensors and can be due to the aforementioned sources of variability. In the usual sampling methodology, a baseline measure before the VOC onset easily solves this issue but this is no longer the case in our continuous setting.
To remove this drift, we propose to first estimate the trend using quantile filtering. This filter is straightforward but quite robust: for a given window, the central point is replaced by the value greater than or equal to p% of the values in the window (here, p = 25%), thus avoiding spikes. This estimation (cf fig. 3) is then subtracted from the raw recording.
2) Segmentation: as in [3], a segmentation step has to be performed in order to extract the regions of interest (ROI), ie the spikes, from the signal.
To this end, we take the signal averaged over the chemical sensors to reduce the noise and a 2-step procedure is then applied. First, we detect all maxima present in a given range (here, ±10s) and greater than a given threshold (here, 8σn
with σn the standard deviation of the noise) using a sliding
window. Second, we build a ROI by extending the area around the maxima until a given threshold is reached (here, 5σn). This
heuristic limits the number of false positive and has proved to be efficient and robust over all the data sets.
3) Feature extraction: a common practice is to extract as discriminant feature the steady-state value describing the equilibrium phase of the reaction between the chemical sensors and the VOC. It is clear from Figure 2 that we never reach steady-state. In such situations, one may try to work only with the transient part of the measurement [3], [8]. In this study, we integrate responses over the whole ROI.
At this step, every ROI is thus summarized by a vector of measurements, or "signature", ∈ R63 (column “N” in Table I
indicates the number of these signatures per data set). 4) Normalization: the extracted feature is influenced by both the duration of the ROI and the VOC concentration. As we are interested in qualitative results, these 2 parameters act as a nuisance on the signature. To get rid of them, we normalize each signature by dividing it by its L2-norm. It is interesting to note that this normalization implies a linear relationship between the measurement and the concentration. 5) Dimensionality reduction: as mentioned in the introduc-tion, one of the strengths of the eNose used is the number of chemical sensors, which is much greater than in current technology. To avoid the effects of the curse of dimension-ality, we perform a simple dimensionality reduction based on Principal Component Analysis (PCA). In each dataset, the first
k components (here, k = 5) are used as our new representation space for projecting the data.
B. Inter datasets
Even if the first challenge concerns the ability of such a framework to perform gas discrimination during one session, a second harder challenge is to go further by checking if this setup could also be used over several months after initial training.
On this point, it is well known in the community that chemi-cal sensors always suffer from long term drift [9], as opposed to the aforementioned short term drift. This drift decreases considerably the generalization capacity of the classifier which has been learned during the first session.
To compensate for it, the literature has been (and still is) prolific. For the sake of intelligibility, we only use the well-established drift correction technique based on component correction (CC), namely the Principal Component Analysis CC [9]. To perform the dimensionality reduction step, the PCA is calculated by taking only the first session. The first k components (here, k = 5) of this PCA are used for projecting data from the other sessions.
IV. RESULTS
A. Intra-dataset
To perform gas discrimination, we use 2 classifiers: a supervised one (linear Support Vector Machine), and an un-supervised one (k-Means). For the SVM classifier, we report 5-fold cross validated performance. Note that for k-Means, 100 random starts are used and the best one is chosen. All the results are reported in Table I. They indicate a really good discrimination between the 3 VOCs for all the data sets, considered individually. The few low results observed for k-Means are explained by the presence of occasional outliers, which can form clusters by themselves.
These results validate the described processing pipeline and demonstrate both the feasibility of this continuous monitoring framework and the good selectivity of the eNose used. We add that no signal has been detected at the location of the empty cup, showing that the material used doesn’t affect the eNose. B. Inter-datasets
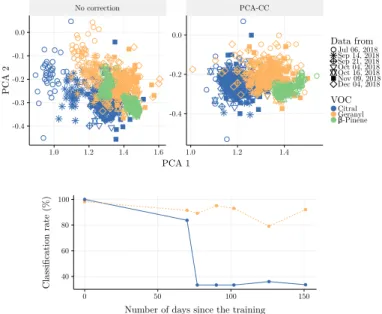
As shown on Figure 4, an important drift occurred between the first session and the later ones, clearly perceptible in the 2-dimensional space of the PCA. To quantitatively assess it, we use a linear SVM classifier, trained on the first session and tested successively on the others. The results agree with the visual observation and the drift clearly causes a decrease in classification performance if no correction is applied.
As mentioned before, the PCA-CC method has been used to correct that drift. It requires tuning 2 crucial parameters: the calibrant used, which has to be representative of the whole set of VOCs, and the number of components to be removed. After a grid search taking averaged classification rate as criterion, calibrating using citral and removing of the first component present the best results, as reported in Figure 4.
Despite the heterogeneous environmental conditions, to cite only a few, between the data sets, the results are quite encouraging even with a simple correction method. This paves the way to further studies, which are discussed next.
No correction PCA-CC 1.0 1.2 1.4 1.6 1.0 1.2 1.4 -0.4 -0.2 0.0 -0.4 -0.3 -0.2 -0.1 0.0 PCA 1 PCA 2 Data from Jul 06, 2018 Sep 14, 2018 Sep 21, 2018 Oct 04, 2018 Oct 16, 2018 Nov 09, 2018 Dec 04, 2018 VOC Citral Geranyl β-Pinene 40 60 80 100 0 50 100 150
Number of days since the training
Classi
fication rate (%)
Fig. 4: Top: the 2 first PC components of the first session. Other sessions are projected in this new space. Bottom: evolution of the generalization over the time (solid: no correction, dashed: PCA-CC). Citral and first component were used for PCA-CC.
V. CONCLUSION AND PROSPECTS
In this paper, we have presented a new open sampling system, allowing a fast, realistic and repeatable VOC mea-surement. We have also described a processing pipeline to deal with the data generated in such a setting. On this point, it is noteworthy that all the described processes can be, and actually are, implemented in real-time, allowing the real-time detection and identification of the 3 studied VOCs. Finally, the eNose used, recently developed, shows quite promising results for gas discrimination in this unfavourable scenario and under drift condition.
Further studies will enhance the processing pipeline by in-cluding the use of other features extracted from the dynamics, for instance. The acquisition of larger data sets, meaning ones that features more VOCs, also over several months, are also planned to make the gas discrimination task even harder.
REFERENCES
[1] S. Brenet et al., “Highly-Selective Optoelectronic Nose Based on Surface Plasmon Resonance Imaging for Sensing Volatile Organic Compounds,” Analytical Chemistry, 2018.
[2] M. Siegel, “Olfaction Metal Oxide Semiconductor Gas Sensors and Neural Networks,” 1990.
[3] M. Trincavelli et al., “Odour classification system for continuous moni-toring applications,” Sensors and Actuators B: Chemical, 2009. [4] V. Hernandez Bennetts et al., “Combining Non Selective Gas Sensors
on a Mobile Robot for Identification and Mapping of Multiple Chemical Compounds,” Sensors, 2014.
[5] P. P. Neumann et al., “Gas source localization with a micro-drone using bio-inspired and particle filter-based algorithms,” Advanced Robotics, 2013.
[6] P. Maho et al., “Non-linear source separation under the Langmuir model for chemical sensors,” in 10th IEEE Workshop on Sensor Array and Multichannel Signal Processing (SAM 2018). IEEE, 2018.
[7] K. C. Persaud et al., Eds., Neuromorphic Olfaction, ser. Frontiers in Neuroengineering. CRC Press/Taylor & Francis, 2013.
[8] C. Distante et al., “On the study of feature extraction methods for an electronic nose,” Sensors and Actuators B: Chemical, no. 2, 2002. [9] T. Artursson et al., “Drift correction for gas sensors using multivariate