CLIMATE CONTROLS ON CORAL GROWTH IN THE CARIBBEAN By
Sara A. Bosshart
B.A., Northwestern University, 2009 M.Sc., University of Edinburgh, 2010
Submitted in partial fulfillment of the requirements for the degree of Master of Science
at the
MASSACHUSSETTS INSTITUTE OF TECHNOLOGY
ARCHNES
and the -SAC
WOODS HOLE OCEANOGRAPHIC INSTITUTION Y
February 2013
APR
@ 2013 Sara Bosshart p
All rights reserved.
The author hereby grants to MIT and WHOI permission to reproduce and to distribute publicly paper and electronic copies of this thesis document in whole or in part in any
I
edium now known or hereafter created.Author ,
Joint
Programn Oceanography/Marine Geology and Geophysics Massachusetts Institute of Technology and Woods Hole Oceanographic institution November 2, 2012Certified by
Anne Cohen Associate Scientist with Tenure, Department of Geology and Geophysics, WHOI Thesis Co-Supervisor
Certified by
Delia Oppo Senior Scientist, Department of Geology and Geophysics, WHOI Thesis Co-Supervisor
Accepted by
OUTLINE
Abstract
5
Acknowledgements
6
1. Introduction
7
1.1. Importance of Coral reefs 7
1.2. Decline of Caribbean Reefs from 1970-2000 8
1.3 This Study 10
2.
Historical Review & Background
11
2.1 Oceanography and Climate of the Caribbean Basin 11
2.1.1 Ocean Currents 11
2.1.2 Modes of Climate Variability 13
2.2 Coral Growth Records 18
2.2.1 Coral Growth 18
2.2.2 Long-term Records of Coral Growth 21
(a) Global Coral Growth 21
(b) Caribbean Coral Growth 23
3. Methods
27
3.1 Coral collection and preparation 27
3.2 Regional Coral Chronologies 29
3.2.1 Construction of the Chronologies 29
(a) East Caribbean 30
3.2.2. Importance of multiple records 36
3.3 Environmental Records 39
3.4 Climate Models 40
3.5 Matlab Composite Analyses 41
4. Results & Discussion
42
Part L A Study of Caribbean Climatology using SODA Reanalysis
42
Seasonal Trends in the Caribbean Basin 42
Influence of the AMO and PDO on the Caribbean 48
Decadal Trends in the Caribbean Basin 51
Part IL Climate Controls on Coral Growth in the Caribbean
54
Caribbean Coral growth 54
Coral Growth Rates and Temperature 56
Western Caribbean Coral Growth & the Atlantic Multidecadal Oscillation 60
Eastern Caribbean Coral Growth & the Pacific Decadal Oscillation 68
Conclusions 75
5. References
77
Abstract
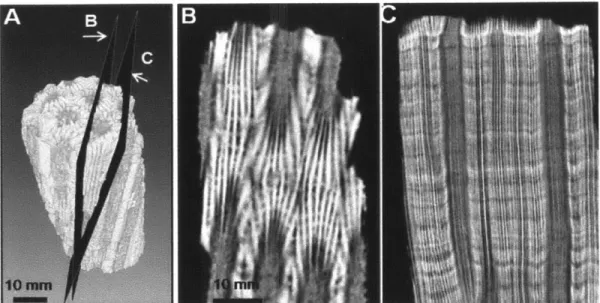
Accurate predictions of Caribbean coral reef responses to global climate change are currently limited by a lack of knowledge of the dominant environmental controls on coral growth. Corals exhibit significant responses to environmental variability occurring on multi-annual to decadal timescales, which are significantly longer than the duration of typical laboratory and field-based experiments. Skeletal growth records, which provide annually-resolved histories spanning several centuries, enable links to be established between coral growth and both long term trends and low-frequency oscillations in environmental conditions. We used 3-D CT scan and imaging techniques to quantify the growth of 3 massive corals (Siderastrea siderea)
from the US Virgin Islands (USVI) over the period 1950-2009 and compared these
growth rates to other records collected from the USVI, Puerto Rico, the Yucatan, Belize and the Bahamas. While coral growth rates were inversely correlated to sea surface temperature (SST) in the Western Caribbean basin (Yucatan, Belize, Bahamas), we found no significant relationship between SST and coral growth in the Eastern basin (USVI, Puerto Rico). Instead, we found a significant inverse relationship between coral growth in the Western Caribbean and changes in the Atlantic Multidecadal Oscillation and a significant positive relationship between coral growth in the Eastern Caribbean Region and shifts in the Pacific Decadal Oscillation. Using data from the Simple Ocean Data Assimilation (SODA) we compared the wind field anomalies during periods of positive coral growth in both regions with the wind field anomalies during phases of these climactic modes that are conducive to coral growth. We find that both the AMO and the PDO play a significant role in shifting the mean wind patters in these Caribbean regions, with the PDO primarily affecting wind patters in the Eastern Basin and the AMO affecting wind patterns in the Western basin. We suggest that the altered wind patterns associated with these modes may induce upwelling favorable conditions in their respective regions of influence, increasing the availability of nutrients for coral growth.
Acknowledgements
I'd like to thank my advisors, Anne Cohen and Delia Oppo for their support, guidance and inspiration over the past two years. I have learned so much from both of you and will always look back on my time in the Cohen lab with fond memories. Thank you for encouraging me to figure out what I'm passionate about. Thank you also to Kris Karnauskus for teaching me everything I know about Matlab, for helpful advice and stimulating discussions. Thanks to Hyodae Seo for not only agreeing to be on my thesis committee but for going above and beyond in your comments and suggestions. I thoroughly enjoyed working with you and only wish we could have worked together longer!
Thanks to all the scientists who have taught me in my classes, in particular Young Oh who made PO accessible to me and was always willing to help, Fiamma Straneo and Sarah Das who's class on climate change molded the way I think about the issue and inspired me to take action, Alison Shaw and Mark Behn for making me a more confident public speaker and to Lauren Mullineaux and Sam Laney for a wonderful excursion into biological oceanography. Thanks to Ed O'Brien who was an amazing SCUBA instructor and taught me how to use tools underwater. To Liviu Giossan, Camillo Ponton and Valier Galy for help on what was at one stage my second generals project and to Rob Sohn for helpful discussions on statistics. Thanks to Pat Lohmann and Neal Cantin who helped to collect my cores and were great field buddies in the USVI.
I'd also like to thank everyone in the geology department who has helped me with a range of challenges including Bill Thompson, Kathryn Rose, Kelly Servant, Libby Pike, Julie Arruda and Darlene Ketten. Thank you also to everyone in APO!
Thank you to everyone in the Cohen lab - Liz, Alice, Hannah, Katie, Tom - I've had a great time getting to know you and bouncing ideas off of you, I will miss you all! Thank you to the wonderful friends I've made in the Joint Program and in the EAPS department at MIT - thanks for all the great times, for the support and for the occasional Matlab help! Jon, thanks for helping me keep everything in perspective and for providing me with a wonderful escape from real life. Bridget, thank you for being an amazing friend and for always being there when I needed you. Rene, I wouldn't be where I am today with out you - thank you for always being supportive, for your help, for your company, for your encouragement. Phil, thanks for creating a graphic specially for this thesis!
Funding for this research was provided by the National Science Foundation, the MIT Student Assistance Fund and the Coastal Oceans Institute fund.
1. Introduction
1.1 Importance of Coral Reefs
Figure 1. Map of the location of tropical coral reefs. [adapted from Bryant et al. (1998)]
Coral reefs occupy less than 0.0025% of the Earth's marine environment yet they are home to 25% of all marine fish species (Burke et al., 1998). Overall, coral reefs
support more species per unit area than any other marine environment: an
estimated 4,000 species of fish and 800 species of hard corals alone (Reaka-Kudla, 1997). The biodiversity of reefs is also key to the discovery and development of new drugs. Already medicines for cancer, arthritis, bacterial infections and viruses are
being developed from compounds discovered in coral reef animals (Bruckner, 2002; Tacio, 2008). Globally, coral reefs are worth an estimated US$375 billion, providing economic and environmental services, both directly and indirectly, to an estimated 1/10th of the world's human population.
The services coral reefs offer range from direct provisioning services such as
food and raw materials, to regulating services such as protection from storm surges and sea level rise, to indirect cultural services such as opportunities for tourism and
recreation (TEEB, 2009). Protecting reefs in the Caribbean is particularly important as many of the island nations rely on tourism as their sole source of income and are thus at major economic risk if their reefs collapse (Bryant et al., 1998). A 2006 evaluation of the coral reefs of Trinidad & Tobago and St. Lucia estimated that these ecosystems generate US$94 and US$44 million respectively from tourism and fishing. This amounts to 11% and 15% of these islands' yearly gross-domestic product (GDP). Another recent study estimated that the total economic value of reef-related tourism in the entire Caribbean basin in 2000 amounted to US$4,700 million. Projections assuming no reef degradation estimate that this value would increase to US$13,000 million by 2015, whereas degradation of reef communities would lead to an annual loss of up to US$600 million dollars a year (WRI, 2004).
In spite of the clear value of coral reefs, both ecologically and economically, coral reefs, particularly in the Caribbean, have been suffering from a number of different stressors and are one of the ecosystems at most immediate risk from anthropogenic carbon emissions and climate change.
1.2 Decline of Caribbean Reefs from 1970-2000
The health of Caribbean coral reefs has declined precipitously over the past several decades owing to a multitude of stressors, both natural and anthropogenic (figure 2). In a 2003 study, Gardner et al. conducted a meta-analysis of patterns in Caribbean coral cover and reported that coral reefs have suffered an unprecedented 80% decline in live coral cover over the past two decades. Likewise, further studies from specific reef sites across the Caribbean have indicated a concurrent deterioration in the complexity of reef architecture (Gardner et al. 2003; Hughes 1994; Alvarez-Filip et al. 2011; Buddemeier et al. 2011). Anthropogenic stressors contributing to the decline in coral heath include direct agents such as development, tourism, overfishing and pollution as well as indirect agents associated with global climate change such as increased fluxes of African dust (Shinn et al., 2000) and
rising sea surface temperatures (SST). In the Caribbean, SSTs have risen steadily for
the past century (Hoegh-Guldberg, 1999) and according to a modeling study by
50- Donner et al. (2007), 40 - thermal stress associated with o 30 this SST ( ~increase was
8
20 the highest ever recorded 10-between 1984 0 and 2005. This 1980 1985 1990 1995 2000 basin-wideYear
increase in SSTFigure 2. Percent coral cover in the Caribbean [adaptedfrom Gardner et al., has resulted in
2003]
an increase in
the frequency and severity of mass coral bleaching events and coral disease as well as an increase in the frequency and intensity of hurricane activity (Hughes et al. 2003; Hoegh-Guldberg et al. 2007; Burke & Maidens 2004).
On annual time scales, thermally induced bleaching and disease have been recognized as the major factors responsible for the large decline in live Caribbean coral cover (Bruckner & Hill 2009; Miller et al. 2009) whereas the decline in architectural complexity has largely been associated with an increase in hurricane frequency (Alvarez-Filip et al. 2011). On longer, decadal to centennial time scales, the decline in coral growth has been directly associated with the increasing trend in SST (Saenger et al. 2009; Vasquez-Bedoya et al., 2012). Because, however, each of these drivers varies in scale, both temporally and spatially, there remains much uncertainty as to which are most responsible for the observed decline in coral
health over the 20 year period between 1980-2000 (Hughes & Connell 1999; Maina
et al. 2011).
1.3 This Study
This study focuses on the long-term effects of climate variability on coral skeletal growth for an extended period from 1950-2010. As coral growth rates are tightly linked to the physical properties of the marine environment (Grottoli, 2001), these background conditions play an important role in the ability of coral species to withstand extreme, episodic events such as bleaching and hurricane activity. To gain a new perspective on the relationship between coral growth and large-scale physical parameters, I conducted two separate but overlapping projects which were designed to address this issue from different angles. The first project involved an in-depth study of the physical oceanography of the Caribbean basin, combining both previously published work with my own analysis of the physical parameters of the Caribbean basin using data from the Simple Ocean Data Assimilation (SODA) v2.2.4. The second project involved analyzing coral growth rates from a suite of sites across the Caribbean basin and Bermuda and comparing these growth rates to available climate records. A final synthesis of the two projects looks at the relationship between the generated growth rate records, Caribbean physical oceanography and large-scale modes of climate variability to determine how these modes might have influenced Caribbean coral growth in the past and to infer how corals might respond in the face of future climate change.
2. Historical Review & Background
2.1 Oceanography and Climate of the Caribbean Basin
2.1.1 Ocean Currents
In the ocean, there are two main processes that control current flow and direction (1) wind stress and (2) changes in water mass temperature and salinity (Stommel, 1957). Because the Caribbean basin lacks extreme variations in temperature and a predominance of evaporation over precipitation, there is insufficient thermohaline convection to drive the currents. Instead, Caribbean currents are driven primarily by the wind, which is dominated by the Northeast trades. Both winds and water flow are seasonal and are strongest in the spring months (Gordon, 1967).
The Caribbean basin is a region of complex bathymetry, comprised of a number of deeper basins punctuated by shallow island passageways (figure 3).
Although, the
mean surface
current in the
Caribbean is hard
to define due to its incredibly variable nature, it is mainly dominated by the Caribbean current in the southern part of the basin,
which is fed by
ocean transport Figure 3. Map depicting the bathymetry of the Caribbean Basin, through the major including the major basins and island passageways.
between the windward island passages (Grenada, St. Vincent, St. Lucia), the leeward island passages (Dominica, Guadeloupe, Antigua, Anegada) and the greater Antilles passages (Mona, Windward) with 10, 8 and 10 Sv of water entering through these
Figure 4. Map of the major Caribbean currents.
passages, respectively (Johns et al., 2002). North of the Yucatan channel, the
dominant current becomes the Yucatan current, then the Loop current in the Gulf of Mexico and finally, the Florida current as it exits the Caribbean and enters the
Atlantic (Alvera-Azcirate et al., 2009). These Western Boundary surface currents are the strongest in the Caribbean with speeds of greater than 0.8 m/s (Centurioni & Niiler, 2003). Surface currents in the Eastern Caribbean and the Eastern Yucatan basin are dominated primarily by eddy motions. East of the Antilles islands, the flow is mostly Northward in direction and thought to be mainly wind driven (Lee et al., 1996), this current is referred to as the Antilles Current (figure 4).
The deep circulation of the Caribbean is highly influenced by the deep ocean passageways, the deepest of which are the An egada Passage between the British Virgin Islands and Anguilla and the Windward Passage between Cuba and Hispaniola with depths of 1900 and 1700m, respectively. Approximately 0.2 Sv of water enters these passages, ventilating the Venezuelan, Columbian, Cayman and Yucatan basins. East of the Antilles islands, a deep western boundary current comprises part of the North Atlantic thermohaline circulation (Lee et al., 1996). The deep central Caribbean circulation is characterized by a cyclonic gyre that transports approximately 15 Sv of water (Joyce et al., 2001; Roemmich, 1981).
2.1.2 Modes of Climate Variability
Climate modes are variations in the climate system with identifiable characteristics, regional patterns and often oscillatory behavior. The most identifiable mode of climate variability is the seasonal cycle, but other modes which are quasi-periodic and less predictable also affect regional climate (Kaplan, 2011). Climate modes are all inherently linked through atmospheric teleconnections and their influence on specific regional climates is often complex as the relative contribution of individual modes can change with time (figure 5). The climate of the Caribbean basin is primarily influenced by 4 different modes of climate variability: the Atlantic Multidecadal Oscillation, the North Atlantic Oscillation, the El Nino-Southern Oscillation and the Pacific Decadal Oscillation. Each of these modes operates on different time scales and influence the climate through interactions between the troposphere, stratosphere, the ocean, adjacent land masses, the pole-equatorial gradient and remote forcing from the Pacific (Marshall et al., 2001).
The North Atlantic Oscillation (NAO) is 6ei of the dominant modes of climate variability in the Atlantic and is most pronouficed during Northern Hemisphere winter. It reflects a gradient in sea level pressure (SLP) between the Atlantic subtropical high and the polar low and can be calculated as either the SLP difference between Reykjavik, Iceland and Lisbon, Portigal, using station data, or as the
6 NAO
4
0
-V
3
-2
ifI-4
1
li ~AMO
E
E
-6 ~~
0O
0 CCU
3-
-
-2
M
2- ENSO
-C-3 M - 2)-2 -PDO
-3
-0
-1
-2
1900
1920
1940
1960
1980
2000
Year
Figure 5. A time series of the different modes of climate variability affecting the Caribbean basin.
Thin colored lines represent the annual variation, thick colored lines represent a 10-year Gaussian filter.
principle empirical orthogonal function of surface pressure in the North Atlantic
(Hurrell and Deser, 2009). The NAO oscillates between a positive and negative phase every couple of years. When the NAO is in its positive phase the pressure
gradient induces stronger westerly winpIs across the mid-latitudes, bringing colder
and drier conditions over the NW Atlantic and Mediterranean regions and warmer and wetter conditions in the eastern United States, northern Europe and parts of Scandinavia (Visbeck et al., 2001). In the negative phase the storm track is weaker and more eastward in direction, resulting in weiter winters in Southern Europe and the Mediterranean and a colder Northern Europe.
The Atlantic Multidecadal Oscillation (AMO) is the leading mode of Atlantic SST variability on decadal time scales. It is calculated by averaging SSTs in the Atlantic Ocean and removing the long-term trend to minimize the influence of greenhouse gas induced global warming (Treiberth and Shea, 2005). The AMO oscillates between periods of anomalously warn SST and periods of anomalously cool SST with a periodicity of about 50-90 years (Enfield et al., 2001). It is thought that variations in the AMO may be linked to changes in Atlantic meridional overturning circulation. The AMO has a large influence on Northern Hemisphere climate and is correlated to air temperature and rainfall over much of the Northern Hemisphere (Sutton and Hodson, 2005). Atlantic hurricanes (Goldenberg et al.,
2001) and Sahel droughts (Zhang and Delworth, 2006) are also thought to be linked
to AMO variability.
Pacific modes of climate variability, such as the El Nino-Southern Oscillation (ENSO) and the Pacific Decadal Oscillation (PDO), also influence Caribbean climate through atmospheric teleconnections (Taylor et al., 2002). ENSO is a strongly coupled mode of tropical ocean-atmospheric variability. The Southern-Oscillation is an inter-annual fluctuation of atmospheric pressure over the tropical Indo-Pacific region and is typically defined as the different in sea level pressure between Tahiti and Darwin, Australia. Negative values of the Southern Oscillation Index, when SLP is high in the Western Pacific, correspond to El Nino episodes which are periods of anomalously high SSTs in the Central and Eastei-n Pacific. Conversely, positive SOI values correspond to low SLP in the Western pacific and La Nifia events when SSTs in the central and Eastern Pacific are anomalously cool (Trenberth et al., 2007). During an El Nifno event, there is a weakening of the Easterly trade winds which
would normally keep warmer water in the west of the Pacific basin. Instead, anomalously warm temperatures occur eastward causing the thermocline to deepen and impeding upwelling in the Eastern Pacific. Instead, the weakened easterly wind and the relaxed thermocline impede upwelling in the Eastern Pacific, causing the anomalously warm temperatures to extend eastward. La Nifia is characterized by increased trade winds, a deeper therrnocline, increased upwelling in the eastern Pacific and a more westerly warm pool. ENSO occurs with a periodicity of approximately 2-7 years and is thought to be largely driven by feedback mechanisms involving changes in sea surface temperature gradients and sea level pressure across the pacific (Bjerknes, 1969).
The Pacific decadal oscillation (PDO) is a long-lived El Nifno-like pattern of climate variability in the Pacific and has links to ENSO but operates on longer 20-30 year time scales (Mantua and Hare, 2002). It is defined as the leading empirical orthogonal function of Pacific sea surface temperature north of 20*N (Schneider & Cornuelle, 2005). The PDO is thought to be forced by several different mechanisms including (1) remote forcing by ENSO (Newman et al., 2003), (2) atmospheric forcing associated with fluctuations in the position and strength of the Aleutian low, (3) ocean circulation anomalies in the Kuroshio-Oyashio Extension region (Schneider & Cornuelle, 2005).
Modes of climate variability influence Caribbean climate either directly through changes in SST (Enfield, 1996, Enfield and Alfaro, 1999, Spence, 2004) and/or indirectly through atmospheric teleconnections. One of the primary controls on Caribbean climate is the Caribbean Low Level Jet (CLLJ) which has a strong influence on Caribbean precipitation. The CLLJ, defined as the maximum easterly zonal wind at 925 hPA, is a dominant feature of Caribbean summer climate and is associated with precipitation anomalies and tropical cyclogenisis (Wang, 2007). The CLLJ varies sub-annually with two maxima, one occurring in the summer and one occurring in the winter and two minima, one in the fall and one in the spring. The summer maxima is associated with maximum SLP and a minimum of rainfall and
cyclogenisis. Variations in the CLLJ are influenced by Caribbean SLP which is in turn influenced by variations in the North Atlantic Subtropical High (Wang, 2007).
The CLLJ can be alternately forced by either the AMO or ENSO and varies synchronously with the NAO. There is a strong relationship between the NAO and the CLLJ since a strong North Atlantic subtroyical high is associated with both a positive NAO and an intensification of the CLLJ. When the CLLJ is forced by the AMO there is a uniform intensification of wind across the jet. A positive AMO increases Caribbean convection and promotes the foriation of easterly tropical waves (atmospheric troughs of low pressure) which bring increased rainfall over much of the Caribbean during the early rainy season (May-July; Taylor et al., 2002). ENSO affects the CLLJ through its influence on the North Atlantic Subtropical High which is opposite during the summer and winter months. This means that during the winter, warm SST anomalies in the Pacific (ie. El Nino) correspond to a weakened CLLJ, conversely, during the summer, El Ninfo years correspond to a strengthened CLLJ (Wang, 2007). The opposite is true for La Nifia years. ENSO predominantly influences the Caribbean's late rainy season (August-October), with El Nifho years resulting in a milder late season and La Nifia resulting in a wetter late season (Taylor et al., 2002).
Caribbean SST, rainfall and wind strength are all tightly linked to variability in the climate modes which have an impact on local air-sea feedback. Marshall et al. (2001) propose that tropical Atlantic variability is jointly forced by changes in the NAO and ENSO and their influence on SST and wind strength anomalies. The NAO remotely forces tropical SSTs, as does ENSO, possibly through a reduction in surface latent heat flux associated with a reduction in trade wind strength (Klein et al., 1999). The joint influence of these two modes can act to warm tropical SSTs and lower sea level pressure resulting in a weakenifig of the northeast trade winds and a strengthening of the southeast trades (Marshall et al., 2001).
2.2 Coral Growth Records
2.2.1 Coral Growth
Tropical reef-building corals grow their calcium carbonate skeletons in annual bands of alternating high and low density layers. Knutson et al. (1972) first recognized the potential use of these bands for the recovery of information on coral growth histories and proxy reconstructions of environmental records. Three growth parameters can be assessed from coral skeletons, namely annual extension rate, average annual density and coral calcification rate, which is a product of the annual average density and the annual extension rate. Although, Dodge and Brass (1984) suggest that all three parameters are necessary to obtain a coherent understanding of the link between coral growth and environmental parameters, several recent studies have shown that coral extension rates alone can reflect the coral's response to environmental stress (Cantin et al., 2010; Copper et al. 2008; De'Ath et al., 2009).
Three main growth processes occur during skeletal formation: (1) the addition of new skeleton at the outer surface of the coral colony (2) the thickening of the existing skeleton, which occurs throughout the depth of the tissue layer, and (3) the periodic and rapid uplift of the lower margin of the tissue layer associated with the formation of new skeleton (Barnes and Lough, 1993). The interplay between these three processes governs the formation of either a high density band or a low density band. While it is still unclear exactly when corals secrete their high and low density bands, Highsmith (1979) suggests that for three different species of massive coral in the Pacific (Favia palli da, Goniastrea retiformis, Porites lutea) and in the Caribbean (Montastrea annularis, Montastrea cavernosa, Porites astreoides), high density bands are formed during periods of seasonally higher SST and less light availability, whereas low density bands are formed during periods of seasonally lower SST and higher light availability. In the Caribbean, this implies that high density bands for M. annularis and M. faveolata are typically formed during the months of July and September when SSTs are highest (Carricart-Ganivet et al., 2001;
Cruz- Pifi6n et al., 2003). Other factors such as coral reproductive cycles, nutrient availability, turbidity, sedimentation and wind stress have also been invoked as contributing factors to density band formation, and as a result, overall annual coral skeletal extension (Barnes and Lough, 1993).
Hudson (1981) describes three major factors governing growth of Montastrea annularis in Florida, namely, water depth, turbidity and temperature. Several studies have since confirmed the relationiship between linear extension and water depth, with corals generally growing faster in shallow reef environments than in off shore reef environments (Cruz-Pifi6n et al., 2003; Dodge & Brass 1984; Carricart-Ganivet & Merino 2001).
Previous studies have also suggested that there is a fundamental dependency of coral growth rates on temperature (Marshall & Clode, 2004; Coles, 1978, Jokiel and Coles, 1977; Clausen and Roth, 1975). The three inter-related growth parameters, namely calcification, skeletal extension and density, are all thought to be controlled by two main factors: (1) the energy available for active deposition of calcium carbonate and (2) the means by which the calcium carbonate is used to construct the skeleton. Different growth strategies are linked to the latter factor, with corals choosing to invest their calcium carbonate either in linear extension or in skeletal density (Carricart-Ganivet 2004; Carricart-Ganivet 2007). Growth strategies have been shown to vary across a variety of species in different Caribbean locations in response to SST (Elizalde-Rendon et al., 2010, Carricart-Ganivet 2004,2007; Davalos-Delhullu et al., 2008). In individual coral colonies calcification rate is generally linked to skeletal growth, so that these two parameters vary synchronously with changes in temperature. This means that an assessment of coral skeletal extension rate alone can often give valuable information on the environment in which corals have grown.
Studies in the field show that both light ahd temperature exert an important effect on skeletal growth but are unable to distiiguish between the effects of these two environmental parameters (Yap and Gomez, 1984). Both short-term laboratory
studies measuring 4 5
Ca incorporation (Clausen and Roth, 1975; Marshall and Clode, 2004) and long-term laboratory studies measuring changes in skeletal weight (Coles and Jokiel, 1978; Jokiel and Coles, 1977) have demonstrated that coral growth peaks within a narrow range of optimal temperatures. For some species of corals in the tropical Pacific, this occurs at seawater temperatures between 25-27*C. Mashall & Clode (2004), however, suggest that this temperature range may vary with latitude and mean annual sea surface temperature. Several studies support this interpretation. An investigation of the growth of Pocillopora damicornis from two disparate regions in the Pacific revealed growth peaks at two distinct temperatures: 27*C for corals from Kaneohe Bay, Hawaii where temperatures range from 23-27C and 31*C for corals from Enewetok Atoll, Western Pacific, where mean SSTs are 2-3*C higher (Coles et al., 1976; Clausen & Roth, 1975).
Reef ecosystem studies have shown that coral skeletal growth is an essential factor in the resilience of a reef to environmental stressors (Hoegh-Guldberg et al., 2007) where "resilience" is defined as the rate at which an ecosystem returns to a given state after a perturbation or disturbance (e.g. bleaching) (Hughes et al., 2003). In fact, Roff & Mumby, (2012) attribute the recent decline in Caribbean coral resilience in part to the loss of fast growing coral in this region. They hypothesize that high individual coral growth rates not only have the potential to increase a population's recovery rate, but that they provide a competitive advantage over algal growth. One of the concerns associated with the Caribbean-wide decrease in coral cover is that the Caribbean may be nearing a "tipping point" where a phase shift would occur from the current, coral-dominated state to an algal dominated state. Once this phase shift has occurred, a new equilibrium would be established with its own resilience and stability making it increasingly hard for the ecosystem to return to a coral dominated state (Mumby et al., 2007; Hoegh-Guldberg et al., 2007). Coral growth rates play an important role in this balance, raising the threshold for a shift between these two phases (Hoegh-Guldberg et al., 2007).
2.2.2. Long-term records of coral growth
(a) Global growth records
On long (>25 year) time scales, temperature has been shown to have an important influence on coral growth in multiple different species located in numerous tropical coral reef locations across the globe. The direct response of the different growth parameters (linear extension, density and calcification), however, varies from place to place. Until relatively recently, the consensus was that coral growth rates would respond positively to rising SST (Lough and Coboer, 2011) and indeed, the majority of studies report coral growth varying directly with SST in Porites spp., Diploria spp., M. annularis and Pavona spp. (Dodge, 1981; IuNidson, 1981; Hudson and Robbin,
1981; Dodge and Lang, 1983; Glynn and Wellington, 1983; Hudon, 1985; Dunbar et al., 1994; Lough and Barnes, 1997; Nie et al., 1997; Ramsay and Cohen, 1997; Lough and Barnes, 2000; Bessat and Buigues, 2001). This picture has been complicated by a number of studies that have found either a prolonged inverse relationship between temperature and coral growth or a recent shift towards declining coral growth associated with rising SSTs (Dodge and Vaisnys, 1975; Castillo et al., 2011; Saenger et al., 2009; Cantin et al., 2010; Vasquez-l5edoya et al., 2012).
For the most part, corals in the Pacific have exhibited long-lasting positive relationships with SST (table 1). Two studies from the Galapagos found linear extension rates of Pavona sp. to be positively corirelated to SST with corals growing most during periods of El Nifio warming (Glynn
and
Wellington, 1983; Dunbar et al., 1994). At Enewetok atoll and in Moorea, French Polynesia extention rates of Porites spp. were also positively correlated with SST aiid air temperature, respectively. In contrast, Manzello et al. (2010) found that linear extension rates of Pocillopora damicornis on the Pacific side of Panama have decreased in concert with rising SSTs since the 1970s.Table 1. Global coral growth rate sand their relationship to sea surface temperature
Location Species Growth parameter Time period Relationship to SST Reference
Galapagos Pavona spp. linear extension 1585-1953 positive Dunbar et al. 1994, Glynn and Wellington, 1983
Enewetok Atoll Porites lutea linear extension 1872-1983 positive Lough and Cooper, 2011 Moorea, French Pavona spp. calcification, density 1958-1990 positive Bessat and Buigues, 2001 Polynesia
Panama (Pacific side) Pocillopora danicornis linear extension 1970, 2006 Growth decreasing Manzello et al., 2010 South China Sea Porites lutea linear extension 1961-1993 positive Nie et al., 1997 Phuket, Thailand Porites lutea linear extension 1984-1986, 2003- inverse Tanzil et al., 2009
2005
Great Barrier Reef Porites calcification, extension 1906-1982 positive Lough and Barnes, 1997 Great Barrier Reef Porites calcification, extension 1880-1929, 1930- positive Lough and Barnes, 2000
1979
Great Barrier Reef Porites calcification 1988-2003 inverse Cooper et al., 2008 Great Barrier Reef Porites calcification 1990-2009 inverse De'ath et al., 2009 Red Sea Diploria heliopora extension 1930-2008 inverse Cantin et al., 2010
Table 2. Caribbean coral growth rate sand their relationship to sea surface temperature
Location Species Growth parameter Time period Relationship to SST Reference
East Flower Garden Montastrea Annularis growth 1950-1979 positive Dodge and Lang, 1983 Banks Florida Keys Belize Belize Yucatan Bahamas Panama (Caribbean side) Panama (Caribbean side) Bermuda
Visques, Puerto Rico
Montastreafaveolata Siderastrea siderea Siderastrea siderea Siderastrea siderea Siderastrea siderea Siderastrea siderea Acropora palmata Diploria spp. Montastrea Annularis growth linear extension linear extension linear extension linear extension linear extension growth growth growth 1937-1996 1930-2000 1936-2001 1860-2008 1857-1991 1880-1990 1971-1973, 2002-2004 1946-1970 suggested inverse inverse inverse inverse inverse no relationship suggested inverse inverse positive Helmle et al., 2011
Castillo et al., 2011, Castillo et al., 2012 Saenger et al., 2009 Vasquez-Bedoya et al., 2012 Saenger et al., 2009 Guzman et al., 2008 Bak et al., 2009
Dodge and Vaisnys, 1975 Dodge (1981)
In the South China Sea, linear extension i-ates of 5 samples of Porites lutea collected from the Xisha Islands and Southern Hainan Island were positively correlated to SST from 1961-1993 (Nie et al., 1997). Growth rates of Porites lutea, however, collected from 8 different sites in Phuket, Southern Thailand during 2 distinct time periods (1984-1986 and 2003-2005) have declined while temperatures have risen. The authors suggest that corals in this area have been exposed to temperatures beyond their thermal maximum resulting in the observed inverse relationship between SST and coral growth (Tanzil et al., 2009).
Numerous studies have looked at long-term coral growth rates of Porites spp. from the Great Barrier Reef (GBR). Early studies examining growth rates of numerous coral colonies across the GBR,
yi-e-1980
find consistent positive relationships between coral growth and SST. Moire recent studies, however, show a different trend. Cooper et al. (2008) found a 21% decrease in coral calcification rates from 1988-2003 in two different Porites populations located 450km apart on the northern GBR. Another recent study by De'ath et al. (2009) examining the growth rates of 328 colonies of Porites spp. from 69 reefs across the GBR found similar decreases in calcification and extension since 1990. Both stdies attribute this decline to a combination of rising SSTs (and associated thermal stress) and declining saturation states of seawater aragonite.Growth rates in the Red Sea have also shown unprecedented declines in recent years (Cantin et al., 2010). Growth of the dominant massive species Diploria heliopora was shown to be inversely correlated to summer SST over the 70 year time period from 1930-2008. Cantin et al. (2010) attribute the inverse relationship between coral growth and temperature to a decrease in the photosynthetic capacity of symbiotic zooxanthellae with increasing temperatures but do not account for the consistency of the inverse relationship between coral growth rate and temperature over the entirety of the record.
(b) Caribbean growth records
Coral growth rates in the Caribbean are much more spatially variable than other tropical basins with an emerging geographical trend in the relationship between coral growth and SST (table 1). As I will show, coral sites located along the Caribbean current all seem to have an inverse relationship with SST, whereas corals located elsewhere in the Caribbean and Gulf of Mexico appear to have the predicted positive relationship between coral growth and SST.
In the Gulf of Mexico, Dodge and Lang (1983) found a positive correlation between the growth of 12 specimens of Montastrea annularis (data originally from Hudson and Robbin, 1981) and SST in reefs on the East Flower Gardens Bank (Northwest Gulf of Mexico) for the period 1950-1979. The same corals were then reanalyzed by Slowey and Crowley (1995), who used a 9-point Gaussian filter, to reveal a decline in coral growth rates in the late 1950's coincident with a major shift towards colder winters.
Helmle et al. (2011) reported a small, but significant increase in the growth of 7 specimens of M. faveolata from the Florida Keys over the period 1937-1996. Although there is not a significant relationship between coral growth and SST, SSTs in this area decreased during this period, suggesting that, were growth rates and SST correlated, there would be an inverse relationship between coral growth and SST. The data may instead suggest that growth rates of M. faveolata from the Florida Keys are not driven primarily by temperature variations.
Numerous coral growth studies have been conducted in the Western Caribbean, most of which find that coral growth rates are decreasing in concert with rising SSTs over the past several decades (Guzman et al. 2008, Manzelo et al., 2010, Castillo et al., 2011, Castillo et al., 2012, Vasquez-Bedoya et al., 2012). In Belize, fore-reef colonies of Siderastrea siderea showed a significant decrease in linear extension from 1930-2000, whereas linear extension in colonies on the near shore and back reef showed almost no change (Castillo et al., 2011, Castillo et al., 2012).
The authors, therefore, suggest that fore-reef colonies are likely to be most susceptible to the changing environment.
In the Yucatan, Vasquez-Bedoya et al., (in press) found a significant, inverse relationship between coral growth rates and SST, and between annual linear extension and the Atlantic Multidecadal Oscillation (AMO) - the leading mode of SST variability in the North Atlantic - for the period 1860-2008. This relationship is consistent with the findings of Saenger et al. (2009) who reported a significant, inverse relationship between coral growth rates of Siderastrea siderea and SST for single corals from Belize and the Bahamas over the entire length of overlap with the instrumental record (1936-2001 and 1857-1991, respectively).
Using corals from the eastern coast of Panama, Guzman et al. (2008) constructed a master chronology of coral growth using 77 cores of Siderastrea sidera and found that coral growth declined over the period 1880-1990. They found no relationship, however, between coral growth and SST, but instead attributed this decline in coral growth to an increase in runoff and sedimentation associated with the construction of the Panama Canal. Likewise, Bak et al. (2009) found that growth of Acropora palmata decreased by 7% in the winter and 11% in the summer
between the periods 1971-1973 and 2002-2004.
Dodge and Vaisnys (1975) found a consistent inverse relationship between coral growth rates in Bermuda and air temperature using an index constructed with 27 specimens of Diploria spp.. They attributed this inverse relationship to a positive relationship between coral growth rates and nutrients (and an inverse relationship between nutrients and temperature).
Studies from the Eastern Caribbean, near the Antilles region, suggest that, unlike in the region of the Caribbean current, the relationship between coral growth rates and SST is predominantly positive. Using a combination of multiple corals of M. annularis from the island of Visques, Puerto Rico, Dodge (1981) found a positive correlation between coral linear extension and water temperature over the 20 year
It is clear from the discrepancy between these growth rate studies and their relationship to SST, especially in the Caribbean, that there remains a gap in our scientific understanding of the dominant environmental controls on coral growth. This study aims to elucidate our understanding of the relationship between environmental parameters and coral growth by providing perspective on the potential role of large-scale modes of climate variability on annual skeletal extension rates.
3. Methods
3.1 Coral collection and preparation
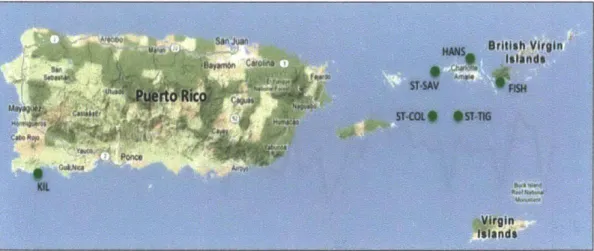
Figure 6. Map showing coral reef locations where
ass
samples werecollected (see table 1 for site references). Red (green) dots were used to construct the West (East) Caribbean
25Ncompilation record.
20N
1001W 9w 901w erw 6o 75W 70-W 651W 60-w S5 w
Coral cores were collected in October, 2009 from live colonies of the dominant
massive coral Siderastrea siderea from two sites in northern St Thomas, near Hans
Lolik island (18*24.265 N, 64054.311 W; 18024.179 N, 64054.201 W) and from FishBay, St. John (figure 6). Additional coral records from Belize, the Yucatan, Bahamas
and Puerto Rico were compiled from existing literature (figure 6; table 2).
In the lab, cores were scanned to reveal annual density bands, using a
Siemens Zoom Computer Assisted Tomography (CAT) scanner at the Woods Hole
Oceanographic Institution using CT-scan methods outlined in Cantin et al. (2010).
3-D computerized imaging techniques (OSIRIX) were used to accurately identify the
axis of maximum vertical growth and to slice the 3D image to an optimal thickness
revealing the annual high and low density band couplets.
CT-scanning is
advantageous as it allows for unlimited attempts to determine the axis with the
Figure 7. Quantification of annual coral growth by 3D CT scanning. (A) 3D CT scan reconstruction of the skeleton. (B) A slice cut subparallel to the upward growth axis (C) A slice cut parallel to the upward growth axis, reveals clear annual growth bands. [adaptedfrom Cantin et al., 2010]
clearest bands. Figure 7(b), depicts an off-axis slice, and figure 7(c) depicts a slice on axis with the clear banding pattern.
On the 2-D slice, density profiles were constructed down the entire length of each core. The distance between successive high-density bands was used to calculate the annual upward extension of each coral. Although some cores extended back to the 18th and 17th century, we chose to focus on the period 1950-2009 to
allow for the maximum overlap between cores.
In order to do a quantitative comparison of calcification rate and linear extension over a short portion of our cores, I calculated calcification rates in the following way. Average annual skeletal densities (in grams per cubic millimeter) were quantified from the CT images of each core by converting grayscale values to apparent absolute density using hydroxyapatite standards of known density (Cantin et al. 2010 SOM). Average annual calcification was then calculated as the product of annual linear extension and annual density.
Table 2. Locations and references for individual coral samples.
Site Locatio ID GPS Coordinates Year Species Reference
# n Hans 11 18024.265 N, 64054.311 W Hans 12 18024.179 N, 64054.201 W FISH 18-18.957 N, 64046.156 W ST- 18011.140 N, COL 6504.606 W ST-TIG 18011.330 N, 64057.395 W ST- 18020.438 N, SAV 6504.923 W KIL 17055.800 N, 67000.000 W BAH 25050.400 N, 78037.200 W YUC 20034. 450 N, 87007. 050 W BEL 17030.000 N, 87045.600W 2009 Siderastrea 2009 2009 2008 2008 2009 2004 1991 2009 2001 siderea Siderasirea siderea Siderastrea siderea Siderastrea siderea Siderastrea siderea Siderastrea siderea Montastrea faveolata Siderastrea siderea Siderastrea siderea Siderastrea siderea This paper This paper This paper Tyler Smith Tyler Smith Tyler Smith Kilbourne et al., 2008 Saenger et al., 2009 Vasquez-Bedoya et al., 2012 Saenger et al., 2009
3.2 Regional Coral Chronologies
3.2.1 Construction of the Chronologies
Master index chronologies were constructed for (1) the entire Caribbean and Bermuda, (2) the Western Caribbean and (3) the Eastern Caribbean in order to expose the common trend in coral growth in each of these areas. To construct the index chronologies, raw growth data for each colony were converted to standard anomalies by subtracting yearly growth increments by the overall time series average and dividing by the standard deviation calculated over the same period
(Dodge and Lang, 1983; Fritts, 1976).
Standard anomaly = extention rate - mean
standard deviation
Because each individual record varied in length it was necessary to choose a mean
1 USVI 1 1 USVI USVI USVI USVI USVI Puerto Rico Bahama s Yucatan Belize
that covered either the entirety of the individual records (EM) as in Dodge and Lange (1983), in which case the mean was different for each record, or a mean that was common to all records (Entire Caribbean Chronology: 1985-1991, Western
Caribbean: 1950-1991, Eastern Caribbean: 1985-2004) with the largest period of
overlap. Both methods were employed to calculate separate East and West growth chronologies and an entire Caribbean chronology. In each case, it was found that there was not a statistically significant difference between the two methods (figure 8). As a result, in order to be consistent we chose to use only the chronologies calculated using the mean calculated over the overlap period for all subsequent analyses.
"
B
A
UR
2=
0.99534
R2
=
0.94677
Ls 2 -15 -1 -' 5 0C 5 I (IFigure 8. Correlations between the two compilation constructions using either the mean and
standard deviation over the entire length of the individual records or over the period of greatest overlap between records for (A) the Western Caribbean and (B) the Eastern Caribbean.
(a) East Caribbean
The East Caribbean chronology was calculated using 5 different corals collected
from the Eastern Caribbean islands of Puerto Rico and the United States Virgin
Figure 9. Location of core sites in the Eastern Caribbean. HANS is the only location located on the
Northern site of the island.
Islands (USVI) (figures 9,11). The majority of these cores were collected from the southern sides of the islands with the exception of the Hans-Lolik cores (Hans 11, Hans 12), which were collected on the northern side of St. Thomas, USVI.
To construct the master chronology for the East Caribbean, the annual
growth rate anomalies calculated for corals from individual site locations were averaged first; this included Hans 12 and Hans 11 to form a Hans average
compilation (figure 10) and the corals collected from south of St Thomas (ST-SAV, ST-COL,ST-TIG) to form a ST-average compilation. All annual growth rate anomalies
from individual corals (FISH, KIL) and coral site compilations (ST-average) collected from the southern sides of the islands were then averaged to form the East
Caribbean compilation (figure 11). The Hans coral compilation was kept separate as it showed different trends from the corals on the southern side of the island (figures 10,11; table 3) leading us to believe that these corals were exposed to a different environmental regime. For the most part, all corals collected on the southern side of
4
C 2
E
0
C0
cu
-2
L_0
0
-4 - Hans 11 Hans12 Compilation
1950
1960
1970
1980
1990
2000
2010
Year
Figure 10. Plot of the individual coral records from the Hans-Lolik site in the USVI (thin colored
lines) and the average of these sites (thick black line).
Table 3. Correlation coefficients between coral time series from the Eastern Caribbean over the
period of greatest overlap between individual records and between the coral time series and the East Caribbean master chronology index over the period 1985-2004.
Coral ID H11 H12 FISH KIL COL SAV TIG
H11 -H12 0.11 -FISH 0.0628 -0.36 -KIL 5.30E-08 -0.128 0.052 -COL 0.02144 -0.3 0.2385 0.045 -SAV -0.282 -0.4 0.259 0.243 0.1375 -TIG 0.1 -0.14 0.198 0.140 0.088 0.0828 -East Caribbean
Index N/A N/A 0.572 0.685 0.677 0.339 0.02258
2 -0 2 -2 4 CU CU
E
E
0 20O c -2 C CC
0 4- 0c 0) -2 0) 2 O 0 -2 -KIL - ST-TIG FISH ST-Average ST-COL . Compilation ST-SAV -4- I 1950 1960 1970 1980 1990 2000 2010Year
Figure 11. Coral records used to construct the Eastern Caribbean growth chronology. A
Puerto Rico coral growth from Kilbourne et al., 2010 (KIL), B USVI coral growth from Fish Bay
(FISH), C Thin lines represent individual coral growth records from College Shoals (ST-COL),
Savana (ST-SAV) and Tiger Bay (ST-TIG), the thick green line shows the average coral growth for these records collected from St. Thomas (ST-Average) D Thin colored lines represent the individual coral growth records listed in A-C, the thick black line represents the East Caribbean growth compilation.
(b) West Caribbean
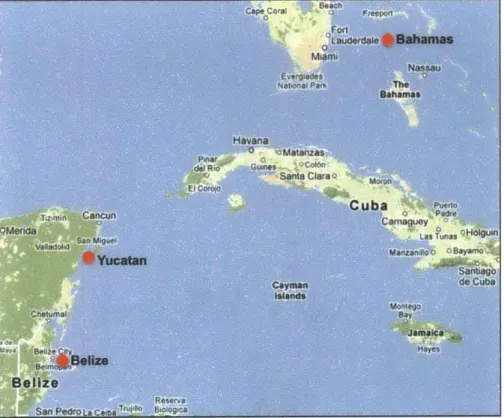
cepcoa - ,,pnFigure 12. Site
Fot locations for
oaecorals collected
in Belize, the Yucatan and the
nash Bahamas.
Havana-dotoI~ Ri GU* CBayen
Ao G SantaClar
E ICorolo
Tfomih B as tu am uey
Los Tunas
growthcateale weetecvrgdfrtercrsfo
h
uaaBlz
SaSantiago
Caymn do Cuba
e Bei z i Qae - T,:
The West Caribbean chronology was calculated using 5 different corals collected
from the Bahamas, the Yucatan and Belize (figure 12). The 3 cores from the Yucatan
were first averaged to construct a chronology from the Yucatan (YUC). Annual
growth rate anomalies were then averaged for the records from the Yucatan, Belize and Bahamas (figure 13). The 5 cores were sufficiently long to allow for an overlap
of 40 years between cores. Although these corals come from very different geographical regions, spanning roughly 1000km, the correlations between cores are remarkably similar, especially in comparison to the correlations between cores located in much closer proximity in the Eastern Caribbean (Tables 3,4). Although the correlations are lower between records from the Yucatan peninsula and the
Bahamas, the removal of the Bahamas record in the final chronology does not significantly affect the chronology (Comp 6; figure 14, table 5).
1 \V
VV
0B
-0 -- 2 -1E
E
o
0
C
-2
Co
0 CU 00 -1 -YUC BAH BEL - Compilation -2 1950 1960 1970 1980 1990 2000 2010Year
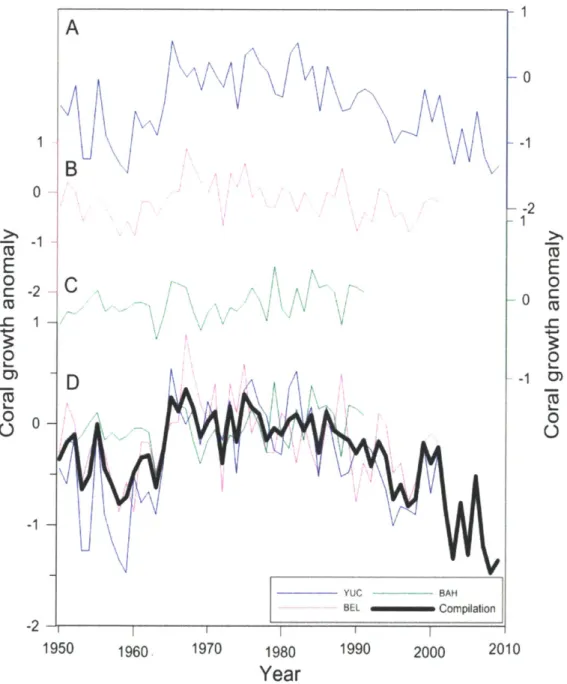
Figure 13. Coral records used to construct the Western Caribbean growth chronology. A
Yucatan coral growth (YUC), B Belize coral growth (BEL), C Bahamas coral growth (BAH), D Thin colored lines represent the individual coral growth records listed in A-C, the thick black line represents the growth compilation.
Table 4. Correlation coefficients between coral time series from the Western Caribbean over the
period of greatest overlap between individual records and between the coral time series and the West Caribbean master chronology index over the period 1950-1991.
Coral ID YUC BEL BAH
YUC
-BEL 0.513
-BAH 0.3 0.0256
-West Caribbean Index 0.915 0.632 0.32
Standard error for each growth chronology was calculated based on the standard deviation of the site averaged growth chronologies.
standard deviation Standard error =
# of records
It is important to note that the error associated with the individual records, which is based on the standard error between separate tracks used to calculate the final extension rates for the individual records, was not included in the error calculations associated with the master chronologies. As a result, the errors displayed are slightly smaller than the actual error associated with each chronology.
A seven-year moving average was used as a smoothing filtering technique to reduce the variance at high frequencies (Chatfield, 1996; Dodge and Lang, 1983;
Fritts, 1976).
3.2.2. Importance of multiple records
Future studies examining the relationship between coral growth and environmental parameters should systematically collect sufficient cores for statistical analyses. For tree-ring analyses, the International Tree-Ring data bank requires that data be
replicated in a minimum of 10 different trees and recommends that at least two cores are taken per tree (Fritts, 1976). Larger sample sizes not only decrease the standard error associated with the master chronology but mitigate the effects of human error such as missing annual growth bands, counting sub-annual stress bands, etc. Likewise, averaged growth chronologies consisting of multiple individual coral records provide the best record of large-scale environmental processes because the growth variation that is associated with these processes, which are common to all growth records, is emphasized when averages are made. Furthermore, the effects of non-climactic factors (such as species differences, age, reproduction, etc) which differ among individual corals and from site to site are minimized by the averaging process (Fritts, 1976).
The current study was limited by the number of available cores and the variability in the temporal scales of each of the individual cores. As such, the constructed index chronologies tend to be most highly correlated to a particular record; the Western Caribbean index is most highly correlated to the records from the Yucatan (r=0.915) and Belize (0.632), and the Eastern Caribbean index is most highly correlated to the record from Puerto Rico (r=0.685) and two of the records from the USVI (FISH: r= 0.572, COL: r=0.677).
Several master chronologies were constructed omitting certain records as a test of the influence on any particular record on the final chronology (figure 14). It is important to note that the amplitude of the coral growth anomaly does vary slightly depending on the records used to construct the master chronologies for the East and West Caribbean, and occasionally significantly depending on the inclusion or omission or certain single records. In the Eastern Caribbean, the omission of either FISH or KIL makes a significant difference to the record pre-1970. Both of these records were included for the final compilation.
E
0
\
00
-2 Compi Comp4 Comp2 Comp5 - Comp3 Comp64-B
M 2
-E
-C0
I f \U Cop---2opo
Comp2 Comp4'7
IComp2
Comp5-4
-
Comp3 -- Comp61950
1960
1970
1980
1990
2000
2010
Year
Figure 14. (A) Compilations constructed for the Western Caribbean (A) and the Eastern Caribbean (B) with the omission of certain individual records (see table 5(A), (B), respectively).
Table 5. Compilations constructed excluding individual records for (A) the Western Caribbean compilation and (B) the Eastern Caribbean compilation. Blank spaces represent the records which were omitted for each compilation.
(A) JAR A MAR A MAR B BEL BAH
Compi
Comp3 Comp4 Comp5 Comp6
(B) FISH KIL COL SAV TIG
Comp 1 Comp 3 Comp 4 Comp 5 Comp 6 3.3 Environmental Records
SST records for the period 1900-2009 were obtained from the 20x2* gridded
National Oceanic and Atmospheric Administration (NOAA) Extended Reconstructed Sea surface Temperature (ERSST) version 3b climatology which is based on observations from the International Comprehensive Ocean-Atmosphere Data Set (ICOADS) (NOAA/OAR/ESRL PSD, Boulder, Colorado, USA). Regional SST boxes were
obtained by averaging SSTs over set geographical regions, eg. Caribbean box (16-25N, 86-59W). Chlorophyll-a data were obtained from the SeaWIFS website
3.4 Climate Models
To study the relationship between coral growth and wide-scale oceanographic parameters such as current direction, wind strength, temperature, salinity and sea level pressure, I made use of data available from the Simple Ocean Data Assimilation (SODA) Reanalysis (Carton and Giese, 1999). A reanalysis climate model is one which is highly constrained by data assimilation and historical observations. The observations that constrain the model can be both comprehensive for example, those variables measured by satellite, as well as relatively sparse, for example measurements of sea level pressure. The reanalysis model, essentially interpolates between observations in a physically consistent way resulting in a gridded and complete dataset. It is important to keep in mind, however, that the spatial consistency and quality of the data has change over time, with the most comprehensive data available after the advent of the satellite era (ie. post 1980). Pre-1980, the data is mostly from a network of in-situ measurements. Although reanalysis data are considered to be more accurate than pure model output data, they should nevertheless not be considered to be true observations.
The latest version of the SODA Reanalysis (v2.2.4) was just released and includes monthly gridded data from 1871-2008. The model has an average spatial resolution of 0.25' x 0.40 with 40 depth levels. The output is produced by an ocean general circulation model (OGCM) which is constrained by observations with corrections occurring approximately every 10 days. The surface forcing includes winds from the NCEP/NCAR reanalysis which are bias corrected by comparison with COADS winds and the evaporation/precipitation is obtained from the Xie-Arkin climatology. Assimilated observations include almost all available hydrographic profile data, as well as ocean station data, moored temperature and salinity time series, surface temperature and salinity observations of various types, and nighttime infrared satellite SST data. The output is in monthly-averaged form,