Publisher’s version / Version de l'éditeur:
Canadian Geotechnical Journal, 14, 3, pp. 281-287, 1977-08
READ THESE TERMS AND CONDITIONS CAREFULLY BEFORE USING THIS WEBSITE. https://nrc-publications.canada.ca/eng/copyright
Vous avez des questions? Nous pouvons vous aider. Pour communiquer directement avec un auteur, consultez la
première page de la revue dans laquelle son article a été publié afin de trouver ses coordonnées. Si vous n’arrivez pas à les repérer, communiquez avec nous à [email protected].
Questions? Contact the NRC Publications Archive team at
[email protected]. If you wish to email the authors directly, please see the first page of the publication for their contact information.
NRC Publications Archive
Archives des publications du CNRC
This publication could be one of several versions: author’s original, accepted manuscript or the publisher’s version. / La version de cette publication peut être l’une des suivantes : la version prépublication de l’auteur, la version acceptée du manuscrit ou la version de l’éditeur.
Access and use of this website and the material on it are subject to the Terms and Conditions set forth at
Analysis of snow avalanche terrain
Schaerer, P. A.
https://publications-cnrc.canada.ca/fra/droits
L’accès à ce site Web et l’utilisation de son contenu sont assujettis aux conditions présentées dans le site LISEZ CES CONDITIONS ATTENTIVEMENT AVANT D’UTILISER CE SITE WEB.
NRC Publications Record / Notice d'Archives des publications de CNRC:
https://nrc-publications.canada.ca/eng/view/object/?id=d6f355ff-dee5-4b0f-9833-bcd13a37da03 https://publications-cnrc.canada.ca/fra/voir/objet/?id=d6f355ff-dee5-4b0f-9833-bcd13a37da03National Research Council Canada
Conseil national de recherches Canada
ANALYSIS OF SNOW AVALANCHE TERRAIN
by Peter phaerer
Reprinted from
Canadian Geotechnical Journal Vol. XIV, No. 3, August 1977, p. 281-287.
DBR Paper No. 72 1
Division of Building Research
ANALYZED
r
Canadian
Geotechnical
canadienne de
Revue
Journal
geotechnique
Published by Publi6e par
THE NATIONAL RESEARCH COUNCIL OF CANADA LE CONSEIL NATIONAL DE RECHERCHES DU CANADA Volume 14 Number 3 August 1977 Volume 14 numCro 3 aoQt 1977
Analysis of snow avalanche terrain1
P. A. SCHAERER
Geotechnical Section, Division of Building Research, National Research Council of Canada, 3904 W . 4th Awe., Vancouver, B.C., Canada V6R IP5
Received October 12, 1976 Accepted March 16, 1977
A multiple regression analysis has been performed of the average annual number of avalanches and terrain factors. Observations were made at 36paths at Rogers Pass overa period of 9 years. The average slope inclination measured from the starting point to the beginning of the run-out zone and exposure to wind proved to be the most significant variables. Slope angle at the starting point, variations over the track, and roughness of the ground suMace were of secondary sig- nificance and their influence varied strongly from site to site. The analysis confirmed that avalanches need either a steep slope or a snow drift to start and a mimimum inclination of track to maintain their motion.
On aeffectue une analyse par regression multiple du nombre annuel moyen d'avalanches et des facteurs du terrain. Pendant une ptriode de 9 ans on a egalement fait des observations sur 36 parcours suivis par des avalanches. I1 s'est avere que les variables les plus significatives etaient I'inclinaison moyenne du talus rnesuree de son point de depart jusqu'au commencement de la zone de reception de I'avalanche et l'exposition au vent. L'angle du talus au point de depart, les variations sur la longueur du couloir et la rugositk de la surface du sol etaient d'importance secondaire et leur influence variait beaucoup d'un site a I'autre. L'analyse a confirme que les avalanches ont besoin d'une pente abrupte ou d'un amoncellement de neige pour partir et d'une inclinaison minimum du couloir pour maintenir le mouvement.
Can. Geotech. J . , 14,281 (1977)
I
I Introduction
I
When the hazard of avalanches is assessed for a specific site, estimates must be madei
about frequency of occurrence and size. Re-I liable information can usually be obtained only by observations made over many years, but the time to do this is often not available. One must draw conclusions from an analysis of terrain, weather, tree growth, and debris in the run-out zone. Terrain and weather are factors that influence the formation of avalanches; 'Prepared for presentation at the 29th Canadian Geotechnical Conference, Vancouver, B.C. October 1976.
trees, or lack of them, and debris are indica- tions of actual occurrences.
The Division of Building Research of the National Research Council of Canada has been studying avalanches for the past 10 years at Rogers Pass, British Columbia, a favourable area for observation because it has numerous, closely spaced avalanche paths with run-out zones easily accessible from a major highway. The topography is typical of that of most avalanche areas west of the Rocky Mountains. Avalanche paths are rugged and steep, with differences in elevation of 500-1000 m be- tween starting zones and the valley floor. The same type of avalanche terrain is encountered
282 CAN. GEOTECH. J . VOL. 14. 1977 in many areas where roads, railways, buildings,
or utility lines are built and maintained. One of the continuing research projects at Rogers Pass has been the observation of the number of avalanche occurrences and the amount -of snow contained in each along an 18-mile stretch of the Trans-Canada Highway. A multiple regression analysis has been carried out of the dependence of the number of ob- served avalanches on various terrain factors. The results are now reported. The relation be- tween avalanche mass and terrain has been re- ported in an earlier paper (Schaerer 1975).
Start of Avalanches
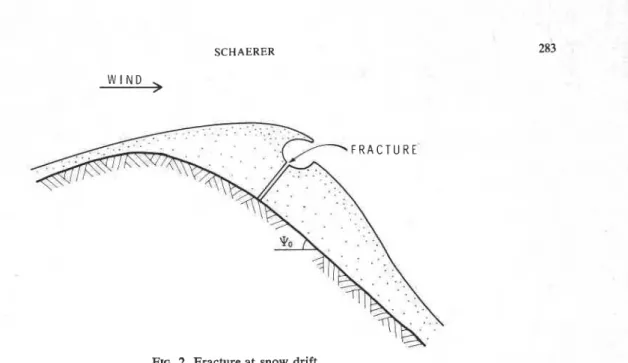
Avalanches occur when the stress imposed on snow on a slope exceeds the strength of the snow. High stresses develop either at steep local slopes or at sites where there are accu- mulations of deep snow. Steep local slopes can be found in rolling terrain, at outcrops of bed- rock, and as high cliffs (Fig. 1). Accumula- tions of deep snow with high stresses form on the lee side of ridges exposed to the wind (Fig. 2). A steep slope or a snowdrift area, or both, can be identified as the fracture location for all avalanche paths. Some paths are V-shaped, i.e. deep gullies, with several branches from which other avalanches start independently. In any analysis of terrain, each gully branch must be considered as a separate avalanche path.
When snow fails in shear, it must overcome the static and kinetic friction at the bed surface and then accelerate in order to develop into an avalanche. Little is known about the friction of snow sliding on snow, but some experiments have shown that the angle of friction is be- tween 17' and 35' (Roch 1965).
The equation of motion after an avalanche has overcome initial friction can be written as (Fig. 1 )
[I] M du/dt
=
M g sin $-
SRwhere M = mass of snow, u = speed of the avalanche, g
=
acceleration due to gravity,$
=
slope angle, and SR = sum of the resist- ance forces. The resistance forces having the strongest influence are dependent on the speed u. Because resistance is rather small in the initial stage, the snow accelerates rapidly until it reaches a terminal velocity at which the re- sistance forces are in balance with the drivingFIG. 1. Start on a steep slope.
force M g sin $. The terminal velocity is usually reached after a distance of 30-100 m, and motion is maintained as long as the track has
a
minimum incline.In summary, avalanches depend on two im- portant characteristics of terrain:
1. a fracture point that is either a steep slope or a snow drift area;
2. a slope below the fracture point that has sufficient incline and is smooth enough for snow to accelerate and maintain speed.
Observations of Avalanches
The average number of avalanche occur- rences per year, Fa, observed in a 9-year period, 1966-1 975, has been introduced as the dependent variable in a regression analysis. Normally, the avalanches were recorded during frequent patrols of the highway, but at times of high avalanche activity such as during a snowstorm observations were made every 2 h. The paths under observation produced be- tween 0.25 and 20 avalanches per average year.
Classification of the size of avalanches is a controversial topic. For Division of Building Research studies they are classed as slough, small, medium, large, or major according
to
the mass of snow in relation to the surface of the accumulation area (Schaerer 1975). The present analysis included all classes greater
SCHAERER
~
W I N DFIG. 2. Fracture at snow drift.
than slough. Such avalanches would be large There is some variation in the climate of the enough to bury a person and move more than two sides of the pass. Snowfall on the east side 100 m. A comparative analysis was made for is about 80% of that at an equal elevation on medium, large, and major avalanches only
-
the west side. The avalanche starting zones on all could be hazardous to traffic on a road-
the east are higher, however, and because of but the result was not significantly different. an increase in snowfall with elevation they re- ceive the same average amount of snow as the Observations of Terrain zones on the west side. With respect to theTerminology formation of avalanches, all avaIanche paths
An avalanche path is the specific area in can be considered to be exposed to the same which a snow mass moves, and is generally climate and any variation in the number of divided into the starting zone at the top, the avalanches would be mainly a function of ter- run-out zone at the bottom where the moving rain.
snow stops, and the track that connects the
starting zone with the run-out zone. Avalanches Method of Observation
remove snow from the starting zone and pick The terrain variables suspected of influenc- up additional snow in the track; the starting ing the formation of avalanches are listed in zone and the track together are the accumula- Table 1 . Their values were determined from tion area. The term fracture point, as used in f o ~ ~ g r a ~ h i c a l maps, air photos, and observa- this paper, refers to the specific point in the tions in the field, the latter with respect to the starting zone at which an avalanche starts by exact location of the avalanche starting Zones failure of the snow. and their exposure to wind. Special topograph- ical maps, scales 1 :5000 and 1 :2500, with
Paths Selected for Analysis contour intervals of 7.6 m (25 ft) and 5
m,
A total of 36 avalanche paths with well- respectively, were made of the avalanche paths. defined, unbroken starting zones and run-out he standard maps of scale 1 :50 000 proved zones that could be observed from the highway to have insufficient accuracy.
under any weather conditions were selected.
The principal analysis contained only paths Terrain Variables
that were not regularly controlled by artillery, Some of the independent variables of Table which is one of the methods applied to protect 1 should be explained.
the highway at Rogers Pass. The influence of Incline at the Fracture Point ( q o )
-
The artillery on frequency of avalanches is a sep- incline refers to the steep slope where av-CAN. GEOTECH. J. VOL. 14, 1977
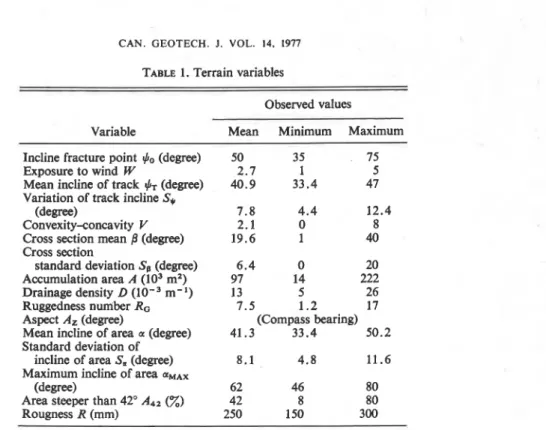
TABLE 1. Terrain variables
Observed values
Variable Mean Minimum Maximum Incline fracture point $o (degree)
Exposure to wind W
Mean incline of track $T (degree)
Variation of track incline Sy (degree)
Convexity<oncavity V Cross section mean (degree) Cross section
standard deviation So (degree) Accumulation area A (lo3 m2) Drainage density D m-I)
Ruggedness number R, Aspect A, (degree)
Mean incline of area a (degree) Standard deviation of
incline of area S. (degree) Maximum incline of area U M A X
(degree)
Area steeper than 42" ,442 (%)
Rougness R (mm) 50 35 75 2 . 7 1 5 40.9 33.4 47 7 . 8 4 . 4 12.4 2.1 0 8 19.6 1 40 6 . 4 0 20 97 14 222 13 5 26 7.5 1 . 2 17 (Compass bearing) 41.3 33.4 50.2 8.1 4 . 8 11.6 62 46 80 42 8 80 250 150 300
a difference of elevation of 20 m, correspond- ing to the accuracy of the topographical maps. Determining this important slope angle from maps proved to be unreliable, and in future studies the incline of terrain should be observed at the site.
Exposure to Wind (W)
-
This variable is an index of the magnitude of snow drifting that can be expected in the avalanche starting zone. Because no method could be found to express the action of wind quantitatively, nominal val- ues were assigned according to the following definitions.W
= 1 : starting zone completely sheltered from wind by surrounding dense forestW
=
2: starting zone sheltered by an open forest or facing the direc- tion of the prevailing wind W=
3: starting zone an open slope withrolls or other irregularities where local drifts can form
W = 4: starting zone on the lee side of a sharp ridge
, W = 5: starting zone on the lee side of a
wide, rounded ridge or open area where large amounts of snow can be moved by wind.
The analysis yielded better correlation when the wind exposure number was squared.
Mean Incline of the Track (qT)
-
This re- fers to the average incline of the avalanche flow path from the fracture point to the top of the run-out zone. There was no significant variation in the frequency of avalanches for mean in- clines steeper than 42' and qT was assumed to be 42' for all steeper slopes.Variation of the Track Incline (S$)
-
Vari- ation was expressed as the standard deviation of the incline of the avalanche flow path from the fracture point to the top of the run-out zone.Convexity-concavity ( V)
-
This variable is the number of 'breaks' where the slope angle in the flow path of the avalanches changed by at least 5'.Cross Section Mean and Standard Deviation
(p,
Sg)-
These variables indicate whether an avalanche flows in a channel or on an open slope and refers to the slope angles in cross sections perpendicular to the direction of the avalanches.Drainage Density (D)
-
D = L / A , where L is the sum of the lengths of individual av- alanche tracks and A is the accumulation area (Doornkamp and King 1971 ).
Ruggedness (RG)
-
RG = DH, where H is the difference in elevation between the top and bottom of the accumulation area (Doorn- kamp and King 197 1 ).
SCHAERER 285
Mean, Standard Deviation, and Maximum Incline of Area (a, Sa, cqIax)
-
These vari-ables refer to all slopes in the accumulation area, not to the profile between the fracture point and the run-out zone only. The slope angles were measured at 30 to 120 locations selected at random in the accumulation area.
Area Steeper than 42' (Ad2)
-
This is the ratio between the surface area with slope in- cline greater than 42' and the total accumula- tion area. The angle of 42' was chosen be- cause it is the maximum angle of repose of loose soil in the starting zones; furthermore, avalanches appeared to run at a maximum fre- quency on this and greater inclines.Roughness (R)
-
Roughness of the ground is expressed by the water equivalent of the snow required to cover rocks, shrubs, and ledges before avalanches will run (Schaerer 1975).The density of the forest would be an addi- tional factor, but it was not considered because the avalanche starting zones were not tree covered.
Results Univariate Analysis
A univariate analysis was conducted to de- termine which terrain factors were most highly correlated with frequency of avalanche occur- rence. In addition to the simple independent variables described, certain combinations in the form of cross products, justified on physical grounds, were included in the study. The fol- lowing variables were found to correlate sig- nificantly with avalanche frequency at the 99% level:
Correlation
Variable coeficient
Product of fracture point incline and wind exposure 0.73
Roughness (R) -0.68
Wind exposure, squared (W2) 0.67 Fracture point incline ( ~ l ~ ) 0.67 Wind exposure (W) 0.67 Mean incline of track qT 0.66 Multivariate Analysis
After identifying the most significant terrain factors in terms of simple regressions, a multi- linear regression analysis with backward elim- ination was performed on the entire set of vari-
ables to determine whether a particular com- bination of terrain factors would result in a higher correlation of avalanche frequency. The following best regression resulted from the suc- cessive removal of insignificant terms.
with a multiple correlation coefficient of 0.82. Fa is the expected average number of avalanche occurrences per year.
Partial F-values for the $T and W2 factors were 22.0 and 24.8, respectively, indicating a highly significant contribution from each term. Residual errors appeared to be random and unbiased, indicating that this simple two-term model can be used to describe frequency of avalanches as a function of terrain for the par- ticular set of avalanche paths used in the study.
Discussion
The regression analysis confirmed that av- alanches are influenced by conditions at the fracture point represented by variables W, $0, and R, and conditons in the track below, vari- ables $T and R. At the fracture point drifting of snow proved to be more significant than slope incline and roughness.
Incline of Track
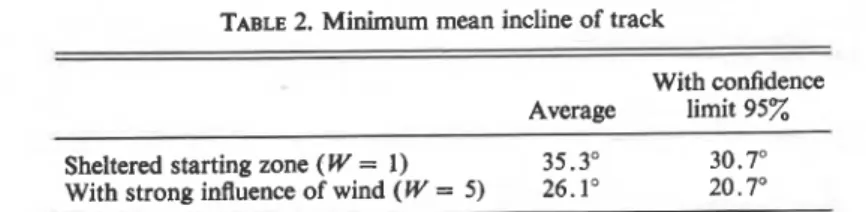
The minimum mean incline necessary for avalanches to maintain momentum can be de- termined from [2] by setting F, = 0 (Table 2). Calculated minimum values agree with general experience; avaIanches appear to occur on average slopes steeper than 25
',
but occasion- ally slide on slopes with less incline (Mellor 1968). When the track is steeper than 42' any increase in incline has little influence on fre- quency of avalanches. They would probably run whenever the weather was favourable for their release.Incline at Fracture Point
It was not possible to draw conclusions about the minimum incline of the starting slope because no observations were made in the low range of inclines and other variables proved to be dominant. The slope angles of Table 2, however, are in the range of the angles of fric- tion observed to be necessary for the initiation of avalanches. They couM also be applied to the incline at the starting point.
CAN. GEOTECH. J. VOL. 14, 1977 TABLE 2. Minimum mean incline o f track
With confidence Average limit 95X
Sheltered starting zone ( W = 1) 35.3" 30.7"
With strong influence of wind ( W = 5) 26. lo 20.7"
quency distribution of the incline of slope at the fracture point of slab avalanches in the U.S.A., Japan, and Switzerland (Perla 1975; Perla and Martinelli 1976) and in Bulgaria and the U.S.S.R. (Peev 1959). The majority of avalanches were observed to start on slopes between 30' and 40" with a peak at 36O, and a few avalanches on slopes steeper than 50'. There is no logical reason for a decrease in fre- quency on steep slopes, except that avalanche frequency increases with slope incline until the average size of each avalanche is too small to be observed. Perla (1975) noticed a shift of the peak of frequency distribution to between 40" and 50' when small slab avalanches were included. Terrain steeper than 60' is usually avalanche-free. This angle is greater than the angle of repose of new snow. It sloughs off as soon as it is deposited.
The significance of avalanches that start on inclines in the range of 40-60° should not be underrated. Even small avalanches can grow into large ones by setting into motion unstable snow in the track below. The chance of this happening would be determined by the incline of the track, which again points to the high sig-
nificance of the variable
qT.
Roughness
Ground surface, often considered to be an important factor in the formation of avalanches (Peev 1959), was found to have little signif- icance in the multivariate analysis. The reason is that the snow at Rogers Pass is between 2 and 5 m deep, covers irregularities of the ground surface, and provides a smooth bed except at the beginning of the winter. Rough- ness would probably be more significant in areas with little snowfall.
Channel Effect
In an earlier study with less data the signif- icance of the track cross section was found to
be second only to the mean incline of the
track (Schaerer 1972). In the present study, however, it was of no consequence. The ex-
planation lies in a correlation between chan- nel variables and exposure to wind, suggesting a stronger influence of wind for channelled paths than open slopes.
Aspecf
Aspect had
no
influence on the averagefre-
quency of avalanches. Fourteen paths under
investigation faced northwest to northeast,
seven paths faced east, and eighteen paths
faced south. No difference in the variation of
the number of avalanches was noted.
Influence of Artillery Control
It is the objective of artillery fire to bring down avalanches frequently, under controlled conditions. To determine the influence of artil-
lery fire on
number
of avaIanches, a predictionwas made, using
[Z],
for frequency of av-alanches
at
15 paths at Rogers Pass regularlycontrolled by artillery. The average number
of
avalanches predicted was 9.2, whereas the
average number of avalanches observed was
17.6. This leads to the conclusion that artillery
produced, on the average, 1.9 times more av- alanches than could be expected to run nat- urally. No comparison was made of the size of the avalanches.
Acknowledgements
The author wishes to thank A. A. Salway
for the regression analysis and for his valuable comments. Thanks are due also to the staff of Parks Canada, Department of Indian and Northern Affairs, at Rogers Pass for assistance to the projects of the National Research Coun- cil of Canada.
This paper is a contribution from the Divi- sion of Building Research, National Research Council of Canada, and is published with the approval of the Director of the Divison.
DOORNKAMP, J . C. and KING, C. A. M. 1971. Numerical analysis in geomorphology. An introduction. E. Arnold (Publishers) Ltd., London.
SCHAERER 287
Regions Research and Engineering Laboratory, Hanover, NH. Monograph 111-A3.
PEEV, C. D. 1959. Der Einfluss von Hangneigung und Exposition auf die Lawinenbildung. Geographische Be- richte, Heft 12, pp. 138-150.
PERLA, R. I. 1975. Stress and fracture of snow slabs. Inter- national Association of Hydrological Sciences: Sym- posium of Grindelwald IAHS-AISH Publication No.
114, pp. 208-221.
PERLA, R. I. and MARTINELLI, M., JR. 1976. Avalanche handbook. Agriculture Handbook 489, United States Government Printing Office, Washington, DC.
ROCH, A. 1965. An approach to the mechanism of av- alanche release. Alpine Journal, 70, No. 310.
SCHAERER, P. A. 1972. Terrain and vegetation of snow avalanche sites at Rogers Pass. In Mountain geomor- phology. British Columbia Geographical Series No. 14,
pp. 215-222.