HAL Id: hal-00925602
https://hal.archives-ouvertes.fr/hal-00925602
Submitted on 8 Jan 2014
HAL is a multi-disciplinary open access
archive for the deposit and dissemination of
sci-entific research documents, whether they are
pub-lished or not. The documents may come from
teaching and research institutions in France or
abroad, or from public or private research centers.
L’archive ouverte pluridisciplinaire HAL, est
destinée au dépôt et à la diffusion de documents
scientifiques de niveau recherche, publiés ou non,
émanant des établissements d’enseignement et de
recherche français ou étrangers, des laboratoires
publics ou privés.
Pore network study of bubble growth by vaporisation in
a porous medium heated laterally
Clément Louriou, Marc Prat
To cite this version:
Clément Louriou, Marc Prat. Pore network study of bubble growth by vaporisation in a porous
medium heated laterally. International Journal of Thermal Sciences, Elsevier, 2012, vol. 52, pp. 8-21.
�10.1016/j.ijthermalsci.2011.09.008�. �hal-00925602�
O
pen
A
rchive
T
OULOUSE
A
rchive
O
uverte (
OATAO
)
OATAO is an open access repository that collects the work of Toulouse researchers and
makes it freely available over the web where possible.
This is an author-deposited version published in :
http://oatao.univ-toulouse.fr/
Eprints ID : 10487
To link to this article : doi:10.1016/j.ijthermalsci.2011.09.008
URL :
http://dx.doi.org/10.1016/j.ijthermalsci.2011.09.008
To cite this version : Louriou, Clément and Prat, Marc Experimental
and numerical pore network study of bubble growth by vaporisation in
a porous medium heated laterally. (2012) International Journal of
Thermal Sciences, vol. 52 . pp. 8-21. ISSN 1290-0729
Any correspondance concerning this service should be sent to the repository
Pore network study of bubble growth by vaporisation in a porous medium
heated laterally
C. Louriou
a,b, M. Prat
a,b,*aUniversité de Toulouse, INPT, UPS, IMFT, Avenue Camille Soula, F 31400, France bCNRS, IMFT, F 31400, France
Keywords: Porous media Vaporisation Pore network model Heat transfer
a b s t r a c t
We present experimental and numerical investigations of vapour phase growth in a two-dimensional model porous medium heated laterally. Visualization experiments reveal the existence of a heat pipe effect within the porous medium when a sufficiently high temperature gradient develops along the porous medium. The bubble growth is characterized by a pattern transition between an invasion percolation (IP) pattern in a first phase of the growth and an invasion percolation in a destabilizing gradient (IPDG) at later times. It is shown that this transition corresponds at the pore scale to a transition between an invasion scenario where only one pore is invaded at each step of the invasion and a multiple pore invasion scenario. The IPDG pattern is characterized by the development of a thin vapour finger, which can explain premature vapour breakthroughs. This type of vapour finger cannot be simulated accurately using traditional models based on the continuum approach to porous media.
1. Introduction
Fluid flow with phase change heat transfer in porous media occurs in many engineering applications such as in drying
processes, e.g.[1], heat pipes[2,3], enhanced boiling heat transfer
[4], flows in geothermal systems[5], and severe nuclear reactor
accident scenarios[6], to name only a few.
As other transport processes in porous media, the modelling of these situations is usually performed within the traditional
framework of the continuum approach to porous media, e.g.[7].
Although useful as effective models, the weakness of such models is that they often lack an understanding of the phenomena at the pore or pore network scale. Also, these models are implicitly based on the existence of a separation of scale between the pore size and the porous domain size, a condition that is not well satisfied in some systems, such a for example the porous coatings often used for heat
transfer enhancement,[4]. Also, under certain circumstances, the
distribution of the fluids in the pore space resulting from the two-phase flow is fractal and therefore not compatible with a condition of length scale separation. The continuum approach is also unable to reproduce the transient flow pattern, in relatively small porous media, when small-scale instabilities induced by capillarity lead to the formation of elongated fingers of length comparable to or
exceeding the length of the medium, e.g.[8]. Owing to the
limita-tions of the traditional approaches, many recent works have used
instead pore network models (PNM). As sketched inFig. 1, a pore
network model is based on the representation of pore space in terms of a network of pores (or sites) connected by throats (or bonds). The “pores” roughly correspond to the larger voids whereas the throats connecting the pores correspond to the constrictions of the pore space. This approach to understanding flow and transport in porous media is distinct from other methods. No macroscopic constitutive relationship is assumed a priori and it can be used even in the absence of length scale separation. However, the relevant transport equations are not solved directly in the pore space and this permits considering systems containing a relatively large number of pores, a distinguishing advantage compared to the direct simulations based on lattice Boltzmann methods or NaviereStokes equations.
Initially mostly developed in relation with oil recovery related
problems, e.g.[9], pore scale models have been successfully applied
to many other domains. To mention just two examples, they have been very helpful to significantly improve our understanding of
drying phenomena, e.g.[1,10,11] and references therein, and of
water invasion in the porous layers of PEM fuel cells[12,13].
Owing the interest of PNM, situations of heat transfer driven
vaporisation in capillary structures were also studied[14e17]. The
study presented in[14]focuses on the growth of a single vapour
bubble in a porous medium. The works reported in[15e17]were
developed in relation with the study of vaporization processes in
* Corresponding author. CNRS, IMFT, F 31400, France. E-mail address:prat@imft.fr(M. Prat).
the thin porous wick of loop heat pipe evaporators and focus on the study of the vaporization front inside the wick. Although of more general interest, the present study is also motivated by the study of loop heat pipes. As discussed later in the article, it is expected that the results presented here can help explain in part problems
encountered in the operation of loop heat pipes, e.g. [18]. In
contrast with[14]where the gas cluster submitted to a heat flux
was far from the lateral boundaries of the porous medium, nucle-ation and bubble growth occur near a wall of the porous domain in our study. This wall corresponds to the interface between the
casing and the porous wick described in[15,16]. Hence, in contrast
with[14], the porous medium is heated up by the side in our study
and not uniformly in the bulk. The pressurization of the growing vapour cluster induced by the vaporization process was neglected in[15,16]where it was assumed that the vapour cluster was con-nected to lateral vapour grooves. One of the main aspects of the present study is a full consideration of the effect of the vapour bubble pressurization.
To this end, we present an experimental and numerical study of bubble growth from a heated wall limiting a porous domain with emphasis on the pore network level. The problem investigated is
sketched inFig. 2. The porous medium is fully saturated by a volatile
liquid initially. Initially, the temperature and the pressure are uniform throughout the system and with a temperature below the saturation temperature. At t ¼ 0, the porous domain is heated on one
side (top side inFig. 2). The heated side, as well as the two lateral
sides, are sealed, i.e. they represent impervious surfaces. The fluids can escape from the outlet, which forms the side opposite to the heated side. The objective is to study in the porous domain both the pressure and temperature fields together with the phase
distribu-tion during the vapour bubble growth. As in[14], “bubble” refers to
a singly connected vapour region in the pore space with irregular, in general, geometry, and is also referred to as “cluster” or “pocket”.
The paper is organized as follows. First, the experimental set-up is presented; then, the experimental results. Subsequently, the pore
network model is described. The comparison between the experi-mental and numerical results is performed in the last section. 2. Experimental set-up
Fig. 3shows a 3D view and an exploded image of the experi-mental device. The porous medium is a 25 ! 25 square pore network of interconnected rectangular channels machined in a 1.5 mm thick aluminium plate. Aluminium has a high thermal
conductivity (
l
sz 200 W m"1K"1), which favours the penetrationof heat into the porous medium, and is soft enough to be machined with the drilling machine available in our laboratory. The heat pore network is generated numerically and then machined in the aluminium plate thanks to a digitally controlled drilling machine. Except for the uncertainties due to the machining process, the machined pore network is supposedly identical to the pore
network used in the numerical simulations (see Section 4). The
distance between two pores (lattice spacing) is 2 mm and the depth of the channels is uniform and equal to 1 mm. The disordered nature of the porous medium appears in the width of the throats,
which is randomly distributed in the range [400
m
m; 900m
m]according to a discrete uniform probability law with a 10
m
m step.Note however that the machining is far from perfect and that the
uncertainty in the width is estimated to be close to #25
m
m, thusgreater than the increment of 10
m
m between two successive sizesin the width distribution law. This does not lead, however, to a major problem in the comparison with the simulation as
dis-cussed in Section5. Throats narrower than 400
m
m, whichcorre-spond to aspect ratio greater than 2.5, are difficult to machine. Thus
a 400
m
m wide channel appears as a lower bound for our drillingmachine for aluminium. To avoid undesirable gravity effects, the channel size must be lower than the capillary length. This sets the upper bound of about 1 mm.
The difficulty associated with the machining of aluminium sets the maximum network size of 25 ! 25 pores that can be reasonably considered with our device. Larger networks imply larger machining times and associated risks of drilling tool failures. As
shown inFig. 4, the channel bottom (and walls) resulting from
machining are rough. The grooves due to the machining can have a strong influence on evaporation processes (especially for the situations where the evaporation rate is relatively low) due to the
possible presence of liquid films in the grooves, e.g.[19,20]and
references therein. As discussed in part in Section 3, it seems,
however, that the effect of liquid films can be neglected in the present study. As discussed in the appendix, gas trapped in those grooves may also influence the nucleation temperature. The network porosity is 0.52.
As can be seen fromFig. 3, the aluminium network is embedded
in a machined Teflon block. This material is chosen for its very low
thermal conductivity (
l
z 0.25 W m"1K"1), so as to limit parasiticheat losses, and its resistance over the range of temperatures [293 Ke373 K] of interest for the present study. The network is sealed on top using a transparent RTV silicone rubber, chosen
Site (pore)
Bond (throat)
Fig. 1. Modelling of pore space by a network of pores (sites) and throats (bonds).
because of its thermal characteristics close to Teflon. A transparent
Plexiglas cover plate (
l
z 0.18 W m"1K"1) is set on top of thissystem and fixed with nine equally spaced and controlled clamping screws. The Plexiglas plate has a low thermal conductivity, confers rigidity to the system and imposes a good contact between the RTV layer and the network.
The in-plane effective thermal conductivity of the network has been evaluated numerically from numerical computations of the conductive heat transfer using the pore network model presented below (considering only conduction heat transfer and assuming
the network liquid saturated,
l
l¼ 0.6 W m"1K"1). As mentionedbefore the thickness of the aluminium plate is 1.5 mm (the network is machined in the top 1 mm thick layer, the remaining 0.5 mm thick layer on the bottom forms a plain underlying layer). This leads to an in-plane effective thermal conductivity of
74 W m"1K"1, thus more than two orders of magnitude greater
than in the adjacent Teflon and RTV/Plexiglas layers. This ensures that the applied heat load is primarily directed into the capillary structure. Insulation foams are set around the system to further limit parasitic heat losses except on the Plexiglas plate so as not to prevent the visualization.
A Watlow Firerod cartridge heater is used to apply the power. It is placed in an aluminium block in order to direct the heat into the
network (seeFig. 3).
A pressure transducer Keller serie 41X, connected to the
network in the middle of the first row of pores (Fig. 3), is used to
measure the vapour pressure. Four type K thermocouples are
inserted as shown in Fig. 3 to measure the temperature in the
network The evolution of the vapour cluster in the network is recorded with A Nikon D300 camera set above the system. Pure
ethanol is used as working fluid (saturation temperature at the
atmospheric pressure z78$C).
The experimental procedure is as follows. The pore network is saturated with ethanol using a vacuum pump to extract the majority of trapped gas. The device is placed horizontally and is connected to the pressure transducer and thermocouples. The power is applied at the cartridge heater and the data acquisition procedure is launched thanks to a PC connected to the camera, pressure transducer and thermocouples. The experiments are performed with a heat load of 10 W applied directly at the cartridge
heater of 10 cm2 external surface, which therefore leads to an
imposed heat flux of 1 W/cm2. Images of the phase distribution are
taken every 20 s.
The experiment is run for two values of the external
tempera-ture Text: 23$C and 70$C. The first value corresponds to the
labo-ratory room temperature. The second temperature is obtained by placing the system inside an enclosure of temperature controlled by circulating heated water in a pipe wrapped up around the enclosure lateral wall.
With the external temperature of 23 $C, the measured
maximum temperature difference between the heated side of the network and the network outlet can be as high as 30 K whereas this difference drops to 5 K with the higher external temperature, see
Table 1. As confirmed by the simulations (see Section5), this is due to the effect of parasitic heat losses. The greater the difference between the saturation temperature and the external temperature, the greater the heat losses from the faces of network (especially the top plate surface). In what follows, the case with the greater
temperature difference (the lower temperature difference,
respectively), thus corresponding to Text¼ 23$C (resp. 70$C), is
referred to as the high temperature gradient case (the low temperature gradient case, respectively).
3. Experimental results
The invasion patterns at different stages of the vapour invasion
for the two temperature gradients are shown inFig. 5. The patterns
are quite similar over the two lower thirds of network. Interest-ingly, the upper third in contact with the heated side is quite
different. As depicted inFig. 6, which shows a detailed view of the
phase distribution at breakthrough (i.e. when the vapour reaches
Fig. 3. 3D view and exploded view of the experimental device.
Fig. 4. Microscopy view of a throat bottom. Machining grooves are clearly visible.
Table 1
Experimental vapour growth time and temperature difference across the network. Elapsed time between
nucleation and breakthrough (sec)
Temperature difference across the network at breakthrough (K)
Exp (non insulated) w500 w30
Exp (insulated) w100 w5
Sim. (Text¼ 310 K) 86 3.1
the outlet), this region is completely dry at breakthrough for the high temperature gradient whereas several disconnected liquid clusters and disconnected individual liquid throats are still present for the low temperature gradient.
Before attempting an explanation for this difference, it is inter-esting to look at the evolution of temperatures and vapour pres-sure. The evolution of the temperatures in the network for the low
temperature gradient case is shown inFig. 7. From the heated side
temperature evolution, it can be seen that the vapour becomes
discernable in the network (bubble growth incipience inFig. 7) for
a temperature of about 71$C, thus lower than expected since the
saturation temperature of ethanol at the atmospheric pressure is
78$C. As discussed in the appendix, this can be explained by the
presence of a small amount of non condensable gas (NCG), the air trapped in the roughness of the machining grooves and stripes (seeFig. 4).
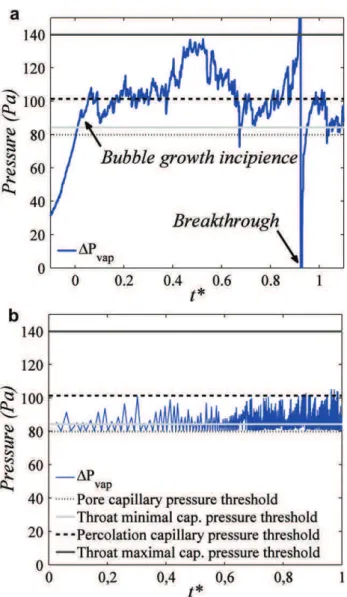
The evolution of the vapour pressure, or more exactly the
pressure difference
D
Pvap ¼ Pvap" Patmwhere Pvap and Patmarethe pressure measured in the vapour pocket and the atmospheric
(room) pressure respectively, is depicted inFig. 8a (high
tempera-ture gradient). The percolation capillary pressure threshold (this threshold corresponds to the pressure difference needed between the liquid and the gas phase to reach breakthrough in a purely quasi-static vapour invasion process) corresponds here to a throat
of width l ¼ 0.650 mm. According to Eq.(5)below, this gives for
ethanol Pc z 101 Pa (for which the surface tension
s
z 20 ! 10"3 N/m), whereas the range of capillary pressure thresholds is [84 Pa (l ¼ 0.9 mm)e140 Pa (l ¼ 0.4 mm)] As can beseen from Fig. 8a, the pressure in the vapour fluctuates in this
range, which indicates that there is no significant overpressure in the growing vapour cluster.
The vapour density of ethanol at the atmospheric pressure and
close to the saturation temperature is about 1.5 kg/m3whereas the
liquid ethanol density is about 650 kg/m3. Thus, to form a given
volume V of vapour, only a liquid volume Vl¼ Vx1.5/650, hence
about 400 times smaller, needs to be vaporized. This indicates that the volume of liquid needed for producing the volume of vapour in the network at breakthrough is on the order of a few throat
Fig. 5. Phase distributions at various stages of invasion (vapour in light grey, liquid in black, the small squares corresponds to the solid phase): a) High temperature gradient (exp.), b) low temperature gradient (exp.), c) numerical simulations.
volumes only. The conclusion is that the volume of liquid displaced and leaving the porous medium through the outlet is about 400 times greater than the volume vaporized during the vapour cluster growth. Thus this growth process is characterized by a significant liquid flow.
The liquid flow rate Q can be roughly estimated from the images of phase distributions using an image processing software:
Q ðt1þ t2=2ÞzVpðSðt2Þ " Sðt1ÞÞ=t2" t1, where Sðt1Þ (resp. Sðt2Þ) is
the vapour saturation in the network at time t1(resp. t2), recalling
that the saturation is the volume fraction of the pore space occupied
by the vapour; Vpis the volume of the pore space. From which the
average liquid velocity at the outlet can be estimated as UzQ=W e, where W is the width of the pore network and e its thickness
(e ¼ 1 mm). Introducing the capillary number Ca ¼
m
vU=s
, wherem
vis the vapour dynamic viscosity (the capillary numbercharac-terises the competition between viscous and capillary effects), this
leads to the curves shown in Fig. 9, where the time is made
dimensionless using the time at breakthrough as characteristic
time. The data presented inFig. 9are for the high temperature
gradient. The experiment with the low temperature gradient is
faster (seeTable 1). Unfortunately, images of the phase distribution
were taken as the same frequency as for the low temperature gradient, i.e. with a too low frequency. As a result, we have too few images for determining the volume flow rate Q as described above
with a reasonable accuracy. It is expected that the tendencies are
similar as those illustrated inFig. 9, i.e. the flow rate increases with
time and this will be confirmed from the numerical simulations. The main direction of the liquid flow is obviously away from the heated side. This is in contrast with the steady-sate solution studied
in [15] where the flow is directed towards the liquidevapour
interface, that is towards the heated side.
In the porous media literature, e.g.[21]and references therein,
one distinguishes three main patterns depending on the values of capillary number Ca. When the capillary effects are dominant (very low Ca), the expected invasion pattern is referred to as an invasion percolation pattern (IP), whereas an IPSG (Invasion Percolation in a Stabilizing Gradient) pattern is expected for greater Ca when the flow is directed towards the heated side (the liquid flow is then directed in the direction opposite to the vapoureliquid interface main direction of motion), and an IPDG (Invasion Percolation in a Destabilizing Gradient) pattern is expected when the main direction of the liquid flow and the direction of motion of the vapoureliquid interface is the same as in the problem studied here.
These various patterns are depicted inFig. 10. As can be seen from
Fig. 9, Ca is in the range [10"6, 10"5]. According to the results
pre-sented in[22], this corresponds to transition values between an IP
pattern (quasi-static invasion) and a viscous fingering pattern,
Fig. 6. Detailed view of phase distribution at breakthrough in the experiments for the two temperature gradients: a) high temperature gradient, b) low temperature gradient. In contrast with the low temperature gradient, there are no liquid clusters (in black in Fig. 6b) in the upper part of network for the high temperature gradient. The arrows in Fig. 6a illustrates the evaporationecondensation effect discussed in the text (heat pipe effect). The red arrow represents the vapour flux whereas the blue arrow represents the transport in liquid phase between the condensation zone (blue ellipse) and the evaporation zone (red ellipse). (For interpretation of the references to colour in this figure legend, the reader is referred to the web version of this article.)
Fig. 7. Evolution of temperature at the heated side and outlet of network.
Fig. 8. a) Experimental pressure evolution during bubble growth (high temperature gradient), see Fig. 8b for definition of straight lines, b) numerical simulation.
hence a IPDG pattern is expected. This is discussed in more depth
from the numerical simulations (see Section5).
As can be seen fromTable 1, the growth of the vapour cluster is
significantly slower with the high temperature gradient. Note that
the times indicated inTable 1are the elapsed time between the
vapour bubble incipience and the vapour breakthrough. This can be explained from the energy balance,
f
¼f
pþf
extþf
lþf
vþf
vap (1)where
f
is the applied flux,f
pis parasitic heat flux lost by in-planeconduction,
f
ext is the heat flux lost by free convection orconduction from top and bottom plates,
f
lis heat flux used to heatup the liquid,
f
vis the heat flux used to heat up the vapour andf
vapis the heat flux used to vaporize the liquid. The main differences between the low temperature gradient case and the high
temper-ature gradient one lie in
f
ext(and to a lesser extentf
p), which ismuch greater in the high gradient case due to the energy exchange between the top plate of system and the surrounding air. This is
confirmed by the numerical simulations presented in Section6. As
a result, since the same heat load is applied in both experiments,
f
vap is lower in the high gradient case and therefore also thevaporization rate,m ¼_
f
vap=Lv. This leads consistently to a slowervapour cluster growth with the high temperature gradient. We return now to the difference regarding the liquid clusters in the upper third of network pointed out at the beginning of this section. The remarkable phenomenon is that the disconnected liquid clusters in the upper third region disappear before vapour breakthrough with the high temperature gradient. Since the mass of liquid needed to produce the volume of vapour occupying the network at breakthrough is quite small (on the order of one pore/ throat volume), it can be concluded that the disconnected clusters disappearance do not lead to a significant net production of vapour.
Two mechanisms can explain a priori the cluster dis-appearance: i) transport through liquid films carpeting the pore walls or trapped in the corners of the pore wall between a discon-nected cluster and a cluster located closer to the outlet, ii) evapo-rationecondensation effect. The effect of liquid films has been studied in the related, albeit distinct, field of mass transfer driven
evaporation, e.g.[19,20]. From these studies, it can be inferred that
the liquid pressure in a disconnected cluster is more likely to be lower than in a larger cluster on the ground that the largest throats are invaded first. Thus the throats remaining to invade in a relatively small disconnected cluster are on average smaller than for a larger
cluster. Hence, according to Laplace’s law (see Eq.(5)below), this
implies that the liquid pressure is smaller in a disconnected cluster. Since the transport in liquid films between two clusters, if any, should be proportional to the pressure difference between the two clusters, it can be concluded that the film effect cannot be invoked to explain the disconnected cluster disappearance (even taking into account the variation of surface tension with temperature). Also if the mechanism was significant, it should be observed for the low temperature gradient. We are therefore left with the evaporationecondensation explanation.
As sketched inFig. 6a, the explanation is as follows. Vapour form
in the hot upper region of the system as a result of cluster vapor-ization and vapour condenses in colder region. As suggested
theoretically for example in[23], the present study thus indicates
a heat pipe effect within the capillary structure during the vapour bubble growth. This also indicates the existence of vapour pressure gradients in the vapour cluster since the vapour is transported from the hotter region to the colder regions.
This significance of this mechanism increases with the temper-ature gradient. It is therefore much more marked with the high temperature gradient experiment. By contrast the disconnected
a
b
Fig. 9. Evolution of vapour saturation (a) and capillary numbers (b) during the invasion (high temperature gradient experiment).
cluster disappearance is quite weak with the low temperature
gradient as can be seen inFig. 6b. This is additional argument in
favour of the evaporationecondensation scenario. 4. Pore network model
As in several previous studies, e.g. [14e16], a simple
two-dimensional square network is used to represent the pore space. The lattice spacing, i.e. the distance between two neighbour pores, is denoted by a. The throats are rectangular capillaries of constant depth e and length d, and of width randomly distributed according
to a discrete uniform probability law in the range [lmin; lmax]. As
shown inFig. 11, the pores form the junctions of the pore space. A
pore is inscribed in a rectangular cuboid of thickness e and of square cross section in the network plane (square in black in
Fig. 11). The width of this square is lmax. Hence the length ath of
a throat is ath¼ a " lmax. The shape of a pore within the cuboid is
dictated by the width of the adjacent throats as shown inFig. 11.
As sketched in Fig. 11, a twice finer network is used for the
computation of temperature field with nodes placed also in the solid phase. As mentioned before, the same network geometry is, as much as possible, imposed in the simulations and in the experiments. As in the experiments, the network porosity is therefore 0.52.
4.1. Fluid flow model
Gravity effects are supposed negligible compared to viscous and capillary effects. The pressure is assumed spatially uniform in
the vapour cluster where the vapour is considered as
a compressible ideal gas. The viscous flow is therefore computed only in the incompressible liquid phase. The viscous pressure drop is neglected in pores, which serves mainly as liquid reser-voirs, and therefore taken into account only in the throats. Flow in a throat is laminar and described by Hagen-Poiseuille law. The flow in a throat is therefore computed thanks to an expression of the form
qij ¼
gij
m
D
Pij (2)where qijis the flow rate in the ijththroat,
m
is the liquid viscosity,D
Pij is the pressure drop across throat (¼the pressure differencebetween the two pores adjacent to the throat). In Eq.(2), gijis the
throat hydraulic conductance, which is expressed as
gij ¼
2Sijkij
a (3)
where Sij is the throat cross section and kij ¼ 2=Poij½lije=lijþ e)2,
where the Poiseuille number Poij is given by Poij ¼ 14:227þ
1402:5ð1 þ r*ð ffiffiffi 2 p " 1Þ=4ð1 þ r*Þ " ffiffiffi 2 p =8Þ1:9according to[24]; r*is
the aspect ratio: r*¼ l
ij=e.
Mass conservation at each pore required X
j
qij ¼ 0: (4)
where the sum runs over the four throats connected to pore i. The
system of Eq.(4)is solved numerically using a conjugate gradient
method and this gives the pressure in each liquid node of network. Notice that in this formulation the evaporation terms are
some-what “hidden” in the mass flow rate terms of Eq. (4). This is
explained through the consideration of boundary conditions, which are presented now.
Capillarity is taken into account through the YoungeLaplace equation assuming a perfectly wetting liquid (contact angle z 0.). Hence the capillary pressure threshold of a throat, that is the pressure difference across a meniscus located at the entrance of a throat that must be exceeded for the throat to be invaded by the vapour, is expressed as,
Pcz
s
"2 e þ 2 l # (5) A constant pressure, equal to the atmospheric pressure, is imposed at the outlet, whereas all other sides are subjected to no-flow boundary condition. The pressure in a pore completely or partially filled with vapour is equal to the vapour cluster pressure. When a liquidevapour interface is present at the boundary of a pore, two situations can occur depending on the stability of the meniscus at the throat entrance. When the meniscus is stable, i.e.when the throat cannot be invaded, the liquid flow rate qvap
resulting from the liquid vaporization is imposed in the throat, qvap ¼ Sij
r
lLvl
vD
Tv;sat aij;v "l
lD
Tsat;l aij;l ! (6)where Lvis the latent heat,
r
lis the liquid density andl
v(resp.l
l) isthe thermal conductivity of the vapour (resp. the liquid). In Eq.(6),
aij;f is the distance between the meniscus position in the throat and
the adjacent liquid pore (f ¼ l) or adjacent vapour pore (f ¼ v);
Fig. 11. Detail of pore network model: a) fluid flow model: the region in white corresponds to a pore of the fluid network; each pore is connected to each of its four neighbour pores (in light grey) by a throat (rectangular region in dark grey between two pores, b) thermal model; each node of thermal network is connected (dashed lines in light grey) to 8 neighbour nodes located either in the solid phase (darkest regions in Fig. 11a) or in the pore space.
D
Tv;sat ¼ Tvi" Tsat, where Tvi is the temperature is the adjacentvapour pore i and
D
Tl;sat ¼ Tlj" Tsat, where Tljis the temperature isthe adjacent liquid pore j.
When the throat can be invaded, the pressure corresponding to the vapour pressure lowered by the capillary pressure and raised by the viscous resistance of the vaporised flow in the throat,
D
Pvap ¼ qvapm
lij;l=Sijkij, is applied at the meniscus on the liquidside,
Pint ¼ Pvap" Pcþ
D
Pvap (7)As mentioned before, a throat can be invaded when the pressure difference across the meniscus exceeds the throat entry pressure,
Pc< Pvap"&Piþ
D
Pvap' (8)where Piis the pressure in the adjacent liquid pore.
4.2. Temperature field computation
In addition to the energy transport in the pore space due to convection and conduction, the thermal model takes into account the conduction in the solid structure. For this reason, the thermal network is twice finer than the fluid network and includes solid
nodes, seeFig. 11. Energy balance is performed at each thermal
node so as to compute the temperature field in the entire network. For a node i in a pore, the energy balance is expressed as
f
ext" X j Sijl
f ( TtþDt i " TjtþDt ) aij;f "r
fCpfUij TitþDtþ TjtþDt 2 !! þX ka
fSik(TtþDt i " TktþDt ) þr
fCpfVi ( TtþDt i " Tit )D
t ¼ 0 (9) withf
ext ¼a
TopSit ( TitþDt" Text ) þa
BotSib ( TitþDt" Text ) (10)In Eq.(9), the sums run over the four throats connected to pore i
(index of summation j) or over the four adjacent nodes in the solid (index of summation k) with f ¼ liquid or vapour depending on the
fluid occupying the pore; and s ¼ solid. The second term in Eq.(9)
represents the conduction and convection in throats whereas the third one represents the coupling with solid nodes. The last term is
the time derivative where Viis the volume of pore i; Sik are the
contact surface areas (including the walls and bottom and top plates between a fluid cell and a solid cell, so as to take into account heat transfers between the solid and the fluid. The heat transfer
coefficient,
a
f is given bya
f ¼l
*f=lfs, wherel
*f is the effectivethermal conductivity, computed using the Alexander correlation
[25]and lfsis the distance between a fluid node and a solid node.
The exchange of energy in the direction perpendicular to the
network plane is taken into account through the term
f
ext, Eq.(10).This term is introduced for the comparison with the experiments. Experimentally, exchanges between the etched network and the
environment at temperature Text through the transparent cover
plate on top or through the surface limiting the model porous medium on the bottom are difficult to avoid. In the pore network model, these energy exchanges (heat losses) are modelled using Eq.
(10), where
a
Topanda
Botare constant heat transfer coefficients. Forsimplicity, the same value, representative of heat losses due to
external free convection effects, is taken for both
a
Top anda
Bot,namely 3 W/m2K. This value leads to a good agreement between
the computed and measured temperatures for the low temperature gradient case.
The energy balance for a node in the solid is expressed as
f
ext" X jl
s ( TitþDt" TjtþDt ) a Sij þ X ka
fSik ( TitþDt" TktþDt ) þr
sCpsVi ( TtþDt i " Tit )D
t ¼ 0 (11)where the sums run over the four “solid” nodes connected to solid node i (index of summation j) or over the four nodes in the adjacent
pores (index of summation k). In the time derivative term, Viis the
volume of the control volume around node i.
In Eq.(11), we find again the transient term, the coupling with
the fluid nodes thanks to
a
f coefficient and a conductive termbetween solid nodes. This term accounts for the conductive transport in the network base plate, which is present in the experimental model.
A constant and uniform thermal flux density of 1 W/cm2, i.e. the
same value as in the experiments, is imposed on the heated side. The lateral sides are subjected to no-flux boundary condition. A constant exchange coefficient is assumed at the outlet,
l
[vT
vy ¼
a
extðT " TextÞ (12)The ClausiuseClapeyron relationship is used to compute the
saturation temperature Tsatfrom the pressure Pvapof the gas cluster,
PvapðTsatÞ ¼ Prefexp "
LvM R " 1 Tsat" 1 Tref #! (13) Hence the temperature is assumed to be uniform along the
liquidevapour interface and given by Eq.(13). This assumption can
become questionable in the presence of a high temperature gradient across the vapour cluster. Note however that small temperature gradients are expected in the applications motivating the present study, i.e. the porous wick of loop heat pipes. It should be also noted that the in-plane heat transfer in the Plexiglas top plate and Teflon bottom plate of the experimental set-up is not taken into account in this model.
Together with these boundary conditions, the system of Eqs.
(9) and (11) is solved numerically using a conjugate gradient method and this gives the temperature in each node of thermal network.
4.3. Vapour bubble growth algorithm
The vapour bubble growth algorithm is sketched inFig. 12and
can be described as follows. As in[14], the growth of the vapour
cluster is characterized by two main steps: pressurization and pore/ throat filling.
1. Initialisation step: Two procedures can be typically consid-ered. The first one, which may be the more realistic one, is to start with all pores and throats filled with liquid and with all nodes of thermal network at a uniform temperature equal to the ambient temperature. In this case, the initialisation step consists in computing the evolution of the network temperature until a fluid node reaches the saturation temperature, possibly increased to take into account some superheating. Once this stage is reached, the fluid node involved is considered full of vapour and the bubble grows from this site, the initial temperature field being known. Note that the disordered nature of the network leads to spatial fluctuations in the temperature field and therefore
the saturation temperature is reached first in only one pore or a limited number of pores along the heated side. The second option is suited for the comparisons with the experiment. It consists in selecting the pore where the vapour appears first in the experiment. This pore is the starting point for the bubble growth. The temperature in the network can be computed as in option #1 or taken uniform and equal to the saturation temperature initially. This second option allows choosing the same nucleation pore in the network as in the experiment. Since one of the objectives is the comparison with experimental invasion pattern, the
second option has been chosen, unless otherwise
mentioned, for the simulations presented in this article. Considering the first option would not change the main results but could make the comparison with experiment less simple to discuss since the vapour incipience pore could be slightly different in the simulation and the experiment. 2. Pressurization step: The bubble does not grow during this step,
which sees the pressure in the bubble increases until the minimum pressure allowing the invasion of at least one throat
along the liquidevapour interface is reached [Eq. (8)]. The
process responsible for the increase in the vapour pressure is the increase in the mass m of vapour resulting from the phase
change. Hence from ideal gas law we have Pvap ¼ mRT=VM
with dm=dt ¼ P k
qmiwhere the sums run over all the menisci
and qmi ¼
r
lqvap, Eq.(6).3. Filling step: The objective of this step is to found the necessary pressure level in the vapour to invade the throat that gets fully invaded by the vapour the fastest. This throat is referred to as the “fastest” throat in what follows. Details on this step are given hereafter.
4. End: Invasion is stopped at breakthrough, i.e. when vapour reaches the outlet.
4.3.1. Detail on the filling step
The time step is determined during this step. The time step is defined at each filling step as the time needed to completely fill the fastest throat (or pore). The filling step algorithm, which is
summarized inFig. 13, is based on the idea that two times need to
be identical. The first is the “drainage time”, which is the time needed by the liquid to leave the throat. The second time is the “invasion time”, which is the time needed to produce the mass of vapour needed to fill the throat.
The “drainage time” tdrain is computed from the flow
compu-tation in the part of the network occupied by the liquid,
tdrain ¼ Vij qij
(14)
where Vijis the volume of liquid in the fastest throat (or pore) and
qijis the volumetric flow rate in the throat.
The “invasion time”, also referred to as “the vapour filling time”,
tfillis expressed as
tfill ¼
D
mr
lQVap(15)
In Eq. (15),
D
m is the additional mass of vapour required tomaintain the vapour pressure in the bubble new total volume after the filling, thus including the volume of the completely filled throat as
well as the volume of the partially filled throats and pores; QVapis the
total evaporation rate, i.e. the sum of evaporation flux over all menisci.
D
m ¼RTPvapMsat&Pvap'
(
VvapþX VthroatsþX Vpores"V&Pvap'
) (16)
In Eq.(16), VðPvapÞ is the volume of the vapour cluster
corre-sponding to the current iteration vapour pressure; PVthroats
(respectivelyPVpores) is the volume drained during timetdrainin all
the invaded throats (respectively pores).
The condition tfill¼ tdrainis considered fulfilled when
--tdrain" tfill
-tdrain ,
3 (17)
In Eq.(17), 3 is the convergence parameter, typically taken as
3 ¼ 10"7. To satisfy Eq.(17), iterations over the vapour pressure are
necessary. Indeed, the vapour pressure drives the drainage dynamic. Increasing the gas pressure means decreasing the drainage time and increasing the invasion time. Decreasing the vapour pressure has exactly the opposite effect. At the end of an invasion step, the fastest throat is fully invaded by the vapour whereas the throats containing a moving meniscus are partially invaded according to the amount of liquid displaced in each throat during the considered time step.
4.3.2. Trapped clusters
A trapped liquid cluster, also more appropriately referred to as a disconnected cluster in the context of vaporisation, is a liquid cluster completely surrounded by vapour and therefore discon-nected from the outlet. Trapped clusters form during the displace-ment of liquid induced by the growth of vapour cluster. The total evaporation rate at the boundary of such a cluster can be computed
from Eq.(6)and therefore contributes to the pressure build-up in
the vapour cluster. Since the vapour pressure around such a cluster is spatially uniform, these clusters cannot move. They can however shrink because of vaporisation. In the model presented above, the pressure field in trapped clusters is not computed. This would imply additional iterative procedures so as to determine which interfacial throats in each trapped liquid cluster are stable (meniscus at the throat entrance) and which must be invaded. For the reason explained below simpler procedures are used. Two simple proce-dures can be used to model the invasion of a trapped cluster. The
most obvious one is to apply an invasion percolation rule,[26], as for
the model of slow evaporation driven by mass transfer, e.g.[1]. In
this case, the cluster interfacial throat of largest width is the only one
to be invaded up to full evaporation, see[1]for more details. Another
option, physically less correct since capillary effects are ignored, but computationally easier to implement is to assume that all the menisci in the interfacial throats of the trapped cluster are moving.
The evaporation rate, Eq. (5), from each interfacial throat then
dictates the speed at which each interfacial throat gets fully empty.
One can refer to[14]for more details on this two regimes. In our
Initialisation Pressurization step Filling step Breakthrough ? NO YES END
case, it turns out that the characteristic time of evaporation of an elementary mass of liquid corresponding to a throat or pore volume in a trapped cluster is quite large compared to the characteristic time of the vapour cluster growth up to breakthrough, at least for a sufficiently temperature gradient. Hence there is a limited evap-oration from the trapped clusters and the two procedures lead to about the same result. This also clearly indicates that the present algorithm is not adapted for simulating situations where a high temperature gradient develops.
5. Comparison between experimental and numerical results and discussion
The simulations are performed for two external temperatures,
namely Text¼ 310 K and Text¼ 350 K.
5.1. Pattern
The invasion patterns predicted numerically are shown inFig. 5
together with the experimental ones. As can be seen, the PNM leads to a quite good prediction of the experimental pattern for the low temperature gradient case. A perfect match between the experi-mental and numerical patterns is not expected owing to the uncertainties in throat size introduced by the channels machining
process, see Section3, as well as the presence of residual pieces of
metal in some channels resulting from the machining. The
comparison reported inFig. 5is therefore quite encouraging.
Contrary to the experiments, the numerical patterns are prac-tically identical for the two external temperatures tested. It should be pointed out that this model is designed for low temperature gradients, which is the situation expected in the wick of loop heat
Temperature field computation
Desired vapour pocket mass computation
Overall evaporation flux computation
Liquid flow rate computation
Pressure field computation
Local evaporation fluxes computation
Invasion time computation
Identification of moving menisci
Error between drain age time and invasion time computation
Error < convergence
criterion
?
Vapour
pressure new
guess
NO
YES
Vapour pocket new volume computation
Minimal drain age time computation
Vapour pressure initial guess
Liquid volumes and pore occupancy updates
Identification of trapped clusters
New identification of moving menisci
pipes. As discussed in the previous section, the approximation of uniform vapour pressure in the bubble becomes questionable in the case of a high temperature gradient. As a result, the evapo-rationecondensation effect, which is negligible for the low temperature gradients but becomes significant for higher gradi-ents, is not taken into account with the present model. In addition to the uncertainties due to the machining process, evapo-rationecondensation effects may also contribute therefore to the slight differences observed between the low gradient experiment and the simulation.
5.2. Growth rate
The time to nucleation, seeTable 2, is not surprisingly shorter in
the experiments since nucleation occurs at a temperature lower than the saturation temperature in the experiments. As reported in
Table 1, the elapsed time between nucleation and breakthrough predicted by the model is of the same order of magnitude as in the
experiment but shorter. In agreement with the discussion of Eq.(1)
in Section3and the experiments, this time increased with
dimin-ishing external heat losses. 5.3. Pressure
The excess pressure,
D
Pvap¼ Pvap" Patm, evolution during thebubble growth is presented inFig. 8b and is similar to the
experi-mental one (Fig. 8a). As explained previously (Section 3), the
pressure in the vapour fluctuates in the range defined by the bond capillary pressure thresholds, which indicates that there is no significant overpressure in the growing vapour cluster resulting from the liquid viscous resistance or the vapour production (which is quite low as discussed before). It can be noticed, however, that
the excess pressure
D
Pvap in the simulation practically neverexceeds the throat percolation capillary pressure threshold, (which
corresponds to l ¼ (lminþ lmax)/2 for the uniform distribution of
throat sizes considered in this article and leads, according to Eq.(5),
to the value of 101 Pa). This is what is expected in an invasion
percolation process. As can be seen fromFig. 8a, the situation is
somewhat different in the experiment with
D
Pvapfluctuating overthe full range of capillary pressure thresholds, i.e. up to 140 Pa. This can be again attributed to the fact that a significant vapour flow is
present in the (high temperature gradient) experiment, Fig. 6,
whereas this effect is neglected in the simulation.
In contrast also with the experimental results, the pressure fluctuation frequency increases with time in the simulations. This can be explained by the increase in the flow rate with time, and therefore the increase in the pore/bond invasion frequency, dis-cussed below.
5.4. Flow rate
The capillary number, defined as in Section 3, can be easily
computed from the numerical simulations since the liquid velocity is computed in each bond at the outlet. The evolution of Ca is
shown inFig. 14. The trend is similar to the one depicted inFig. 9b
(exp. results), i.e. the capillary number increases with time. The simulation for the higher thermal gradient leads, however, to a plateau, which corresponds to a plateau in the evaporation rate, as
depicted inFig. 15. This is due to the heat losses, which are more
important with the higher thermal gradient. Since the pressure in the vapour pocket does not increase but only fluctuates around
a mean value (Fig. 8), there is of course a direct link between the
evaporation flux and the liquid flow rate at the outlet and therefore
Ca. This is clearly seen from the comparison ofFigs. 14 and 15. The
values of capillary number are slightly higher (we recall that breakthrough is reached more rapidly in the simulations, see
Table 1) but comparable to the experimental ones (Fig. 9).
The evaporation flux (Fig. 15) and the capillary number (Fig. 14)
reach higher values, more than three times the maximum values of the higher gradient simulation, for the low gradient case. This is
also a consequence of the heat losses. From Eq.(1), it is clear that
a greater fraction of the applied heat flux is used for vaporizing the liquid when the heat losses are lower.
5.5. Multiple invasion and pattern transition
As mentioned before (see Section3), IPDG pattern is expected
for this range of capillary number. The network size is however a bit too small to clearly see the formation of a thin vapour finger as
expected in an IPDG displacement (Fig. 10). The departure from an
IP invasion scenario can, however, be evidenced from the consid-eration of the number of moving menisci during the invasion. The throats are invaded one by one in an IP process. Thus the invasion becomes distinct from IP when several throats are invaded at the
same time. As can be seen fromFig. 16, the number of moving
Table 2
Time up to nucleation.
Time (sec)
Exp (non insulated) w550
Exp (insulated) w200
Sim. (Text¼ 310 K) 1035 (Tnuc¼ 78$C), 532 (Tnuc_exp¼ 71$C)
Sim. (Text¼ 350 K) 409 (Tnuc¼ 78$C), 268 (Tnuc_exp¼ 71$C)
menisci increases with time as expected, which clearly indicates a departure from pure IP. Although a detailed discussion of the influence of network size on the results is beyond the scope of the paper, this can be further illustrated from simulations for a larger
network. The results shown inFig. 17are obtained with a 50 ! 50
network. The conditions of simulation are exactly the same as for
the smaller network, assuming in addition, for simplicity, no heat
losses. As can be seen from Fig. 17, the pattern becomes clearly
distinct from the IP pattern (shown for this network inFig. 17a). As
before the capillary number increases during the invasion (and
reaches here a value close to 3 ! 10"4at breakthrough) and the
number of moving menisci increases significantly as shown in
Fig. 15. Evolution of evaporation flux as a function of time (num. sim.): a) low gradient (Text¼ 350 K), b) higher gradient (Text¼ 310 K).
0 0.2 0.4 0.6 0.8 1 0 1 2 3 4
t*
Number of moving menisci
0 0.2 0.4 0.6 0.8 1 0 1 2 3 4 5 6 7
t*
Number of moving menisci
a
b
Fig. 16. Evolution of the number of moving menisci during the invasion.: a) low gradient (Text¼ 350 K), b) higher gradient (Text¼ 310 K). Each point in the figures corresponds to an
invasion step (¼full invasion by the vapour of a throat or a pore).
Fig. 18. This leads clearly to a pattern transition with, as expected, the formation of a thin percolating branch in the bottom half of the
network (Fig. 17b).
6. Conclusion
In this paper, we have presented visualization experiments and pore network simulations of bubble growth in a model porous
medium heated laterally. As in[14], the growth was modelled as
a succession of pressurization and pore filling steps. The compar-ison with the experiments leads to a good agreement in terms of invasion pattern and pressure level in the vapour cluster. The agreement is good also as regards the dynamics of the vapour cluster growth, the evolution of trapped liquid clusters, at least for a low temperature gradient across the system. The quasi two-dimensional nature of the system studied makes however diffi-cult an accurate comparison owing to heat losses. It can never-theless be concluded that the model captures well the physics of the bubble growth driven by heat transfer in a porous medium for a sufficiently low temperature gradient. The consideration of higher thermal gradient requires further developments. In particular, it becomes necessary to take into account the vapour flow induced within the growing vapour pocket.
The process is characterized by a transition between an invasion percolation regime at the beginning of the growth (throats at the bubble perimeter are penetrated one at a time) and a regime characterized by multiple throat penetration at the bubble perim-eter. This regime is characterized by the development of a thin vapour finger typical of a pattern of invasion percolation in a destabilizing gradient. The percolation gradient, which is linked to the pressure gradient in the liquid phase, originates in the liquid flow induces by the vapour cluster growth and which is directed towards the outlet. The pressure in the liquid decreases therefore in the direction of the outlet. This pressure decreasing corresponds to an increase in the percolation probability.
This has important potential implications as regards the flow and the transfers in the porous wick of loop heat pipe. The formation of thin vapour fingers favours premature vapour breakthrough and associated problems in the operation of loop heat pipe. The induced liquid flow in the direction of the outlet can be referred to as a reverse flow since it is directed in the
direction opposite to the flow direction under normal operation conditions, where the flow is directed towards the heated side. The occurrence of reverse flow may explain in part problems encountered during the start-up of loop heat pipes. It can be also pointed out that the models based on the traditional continuum approach to porous media are not adapted to simulate the development of thin viscous fingers.
Also, the experiments indicate the existence of a heat pipe effect during the development of the vapour pocket in the pres-ence of a sufficiently high temperature gradient. This evaporatione condensation effect affects the phase distribution within the porous medium and leads to the development of a dry zone adjacent to the heated side. This heat pipe effect may therefore affect the transfer in the porous wick of capillary evaporators. Acknowledgements
Financial supports from CNES and Région Midi-Pyrénées are gratefully acknowledged. This work has benefited from numerous discussions within CNRS-GDR ‘SYREDI’ (Systèmes de Refroidisse-ment Diphasiques).
Appendix
The classical theory, e.g.[27], for nucleation from a wall cavity
leads to express the activation temperature Tbas
Tb" Tsat ¼ 2L
s
Tsat vr
vr(A-1) where r is the cavity radius (assimilated here to a cylindrical cavity and assuming a perfectly wetting liquid). In the presence of a non condensable gas (NCG), i.e. air in our case, the expression becomes
[28], Tb" Tsat ¼ Tsat exp&Cg' Lv
r
vr "2s
r "KhCg # (A-2)where Khis air Henry’s constant and Cgis the solubility of air.
Eqs.(A-1) and (A-2)are plotted inFig. A-1. The results shown in
Fig. A-1clearly suggest that the presence of air in the machining grooves of the experimental network is a quite plausible cause for the lower bubble incipience temperature (about 4 K lower than the ethanol saturation temperature) observed in the experiments.
Fig. A-1. NCG effect on the bubble activation temperature as a function of bubble radius.
Fig. 18. Evolution of the number of moving menisci during the invasion (simulation corresponding to the pattern shown inFig. 17b). Each point in the figure corresponds to an invasion step (¼full invasion by the vapour of a throat or a pore).
References
[1] M. Prat, Recent advances in pore-scale models for drying of porous media, Chem. Eng. J. 86 (2002) 153e164.
[2] G.P. Peterson, An Introduction to Heat Pipes, Modeling, Testing and Applica-tions. Wiley Interscience, New-York, 1994.
[3] A. Faghri, Heat Pipe Science and Technology. Taylor & Francis, Washington, 1995.
[4] D.H. Min, G.S. Hwang, Y. Usta, O.N. Cora, M. Koc, M. Kaviany, 2-D and 3-D modulated porous coatings for enhanced pool boiling, Int. J. Heat Mass Transfer 52 (2009) 2607e2613.
[5] A.W. Woods, Liquid and vapor flow in superheated rock, Ann. Rev. Fluid Mech. 31 (1999) 171e199.
[6] R.J. Lipinski, A coolability model for post-accident nuclear reactor debris, Nucl. Technol. 65 (1984) 53e66.
[7] M. Kaviany, Principles of Heat Transfer in Porous Media (Second Printing), second ed. Springer-Verlag, New York, 1999.
[8] E. Aker, K.J. Maloy, A. Hansen, Simulating temporal evolution of pressure in two-phase flow in porous media, Phys. Rev. E 58 (1998) 2217e2226. [9] M.J. Blunt, M.D. Jackson, M. Piri, P.H. Valvatne, Detailed physics, predictive
capabilities and macroscopic consequences for pore-network models of multiphase flow, Adv. Water Resour. 25 (2002) 1069e1089.
[10] O. Chapuis, M. Prat, Influence of wettability conditions on slow evaporation in two-dimensional porous media, Phys. Rev. E 75 (2007) 046311.
[11] A.G. Yiotis, I.N. Tsimpanogiannis, A.K. Stubos, Y.C. Yortsos, Coupling between external and internal mass transfer during drying of a porous medium, Water Resour. Res. 43 (2007) W06403.
[12] O. Chapuis, M. Prat, M. Quintard, E. Chane-Kane, O. Guillot, N. Mayer, Two-phase flow and evaporation in model fibrous media. Application to the gas diffusion layer of PEM fuel cells, J. Power Sources 178 (2008) 258e268.
[13] M. Rebai, M. Prat, Scale effect and two-phase flow in a thin hydrophobic porous layer. Application to water transport in gas diffusion layers of PEM fuel cells, J. Power Sources 192 (2009) 534e543.
[14] C. Satik, Y. Yortsos, A pore-network study of bubble growth in porous media driven by heat transfer, ASME J. Heat Transfer 118 (1996) 455e462.
[15] C. Figus, Y. Le Bray, S. Bories, M. Prat, Heat and mass transfer with phase change in a porous structure partially heated. Continuum model and pore network simulations, Int. J. Heat Mass Transfer 42 (1999) 2257e2569. [16] T. Coquard, M. Prat, A. Larue de Tournemine, C. Figus, Pore-network models as
a tool for the analysis of heat and mass transfer with phase change in the capillary structure of loop heat pipe, in: Proc. 14th International Heat Pipe Conference (14th IHPC), Florianópolis, Brazil (2007).
[17] M. Prat, Pore network models for the study of transfers in the porous wick of loop heat pipes, Heat Pipe Science and Technology, An International Journal 1 (2) (2010) 129e149.
[18] M.A. Chernysheva, Y.F. Maydanik, Numerical simulation of transient heat and mass transfer in a cylindrical evaporator of a loop heat pipe, Int. J. Heat Mass Transfer 51 (2008) 4204e4215.
[19] M. Prat, On the influence of pore shape, contact angle and film flows on drying of capillary porous media, Int. J. Heat Mass Transfer 50 (2007) 1455e1468. [20] F. Chauvet, P. Duru, S. Geoffroy, M. Prat, Three periods of drying of a single
square capillary tube, Phys. Rev. Lett. 103 (2009) 124502.
[21] M. Prat, F. Bouleux, Drying of capillary porous media with stabilized front in two-dimensions, Phys. Rev. E 60 (1999) 5647e5656.
[22] R. Lenormand, E. Touboul, C. Zarcone, Numerical models and experiments on immiscible displacements in porous media, J. Fluid Mech. 189 (1988) 165e187. [23] V. Buz, K. Goncharov, Modelling of vapour generating in small-porous capil-lary structures, in: Proc. 15th International Heat Pipe Conference (15th IHPC) Clemson, USA (2010).
[24] M.A. Tirunarayanan, A. Ramachandran, Correlation of isothermal pressure drop in rectangular ducts, in: Proc. Australas Conf. Hydraul. Fluid Mech, 2th, University of Auckland (1965), pp. A213eA230.
[25] E.J. Alexander, Structure-property Relationships in Heat Pipe Wicking Mate-rial Ph.D Thesis. North Carolina State University, Dept. of Chemical Engi-neering, North Carolina, 1972.
[26] D. Wilkinson, J.F. Willemsen, Invasion percolation: a new form of percolation theory, J. Phys. A: Math. Gen. 16 (1983) 3365e3376.
[27] V.P. Carey, Liquidevapor Phase-change Phenomena, second ed. Hemisphere Publishing Corporation, New York, NY, February, 1992, 2007.
[28] J. Li, P. Cheng, Bubble cavitation in a microchannel, Int. J. Heat Mass Transfer 47 (2004) 2689e2698.