HAL Id: hal-01860144
https://hal.archives-ouvertes.fr/hal-01860144
Submitted on 4 Oct 2018
HAL is a multi-disciplinary open access
archive for the deposit and dissemination of
sci-entific research documents, whether they are
pub-lished or not. The documents may come from
teaching and research institutions in France or
abroad, or from public or private research centers.
L’archive ouverte pluridisciplinaire HAL, est
destinée au dépôt et à la diffusion de documents
scientifiques de niveau recherche, publiés ou non,
émanant des établissements d’enseignement et de
recherche français ou étrangers, des laboratoires
publics ou privés.
Enhanced Weak Doppler Micro-Embolic Signal
Detection using Energy Fluctuations
Maroun Geryes, Sébastien Ménigot, Jamal Charara, Mohammad Nasserdine,
Ali Mcheick, Jean Marc Girault
To cite this version:
Maroun Geryes, Sébastien Ménigot, Jamal Charara, Mohammad Nasserdine, Ali Mcheick, et al..
Enhanced Weak Doppler Micro-Embolic Signal Detection using Energy Fluctuations. Biomedical
Signal Processing and Control, Elsevier, 2019, 47, pp.177-182. �10.1016/j.bspc.2018.08.020�.
�hal-01860144�
Enhanced Weak Doppler Micro-Embolic Signal Detection using Energy Fluctuations
Maroun Geryesc, Sébastien Ménigota,b, Jamal Chararac, Mohammad Nasserdinec, Ali Mcheickc, Jean-Marc Giraulta,b,d
aLUNAM Université, LAUM, CNRS UMR 6613, Université du Maine, Av. O. Messiaen, 72085 Le Mans Cedex 9, France b Groupe ESEO, 10 boulevard Jeanneteau, CS 49017 Angers Cedex, France
cDepartment of Physics and Electronics, Faculty of Sciences I, Lebanese University, Beirut, Lebanon dCorresponding author : [email protected]
Abstract
Ultrasound transcranial Holter offers the possibility of long-duration recordings with the micro-emboli detection process being performed offline. This offline detection allows developing much more robust micro-embolic detection procedures and applications. From a signal processing perspective, most commercial automatic detection systems, based on the short time Fourier transform, employ constant detection thresholds either on the whole band or on sub-bands. However, earlier studies highlighted many doubts about the accuracy and robustness of these systems for the detection of weak micro-embolic signatures. In this work, we present an original detection technique based on energy fluctuations as a strong tool for the detection of the weakest micro-embolic signal. Results, from a set of real signals, show a detection rate of 92% and a false alarm rate of 10%. These good performances lead us to consider the proposed technique as a good candidate to detect weak micro-embolic signals.
Keywords : Ultrasound Doppler signal, signal processing, micro-emboli detection, energy signal, energy fluctuations. Received 14 December 2017, Revised 29 June 2018, Accepted 20 August 2018, Available online 28 August 2018. https://doi.org/10.1016/j.bspc.2018.08.020
1. Introduction
Cerebrovascular Accident (CVA) occurs when the blood flow to a part of the brain is suddenly stopped either by a rupture of a blood vessel leading to a hemorrhage, or a blockage leading to an embolism. The relation of em-bolus to CVAs occurrence has been widely demonstrated [1]. CVAs, being the second cause of mortality worldwide, represent a major concern and death threat over a huge population. Therefore, CVAs are considered as a public health issue for which many research activities are per-formed in perspective of finding treatments or methods of early diagnosis thus avoiding its occurrence.
An effective widely used CVA diagnosis solution is the Transcranial Doppler (TCD) system [2]. This system is commonly used for the detection of micro-emboli circulat-ing in the cerebral vascular system. Micro-embolic events are detected from the Doppler signal as high intensity tran-sient signals (HITS), superimposed on the Doppler signal backscattered by the blood. However, TCD clinical use has been limited by several hindering points. For instance, the time needed for probe positioning can be considerably long. To reduce this time, Mackinnon et al. [3] proposed to use a servo-controlled probe. Moreover, the very short effective examination duration can be insufficient to allow the detection of several micro-embolisms. Consequently to overpass this drawback, Mackinnon et al. [3] have shown
that the longer the examination duration, the better con-fidence in the detector.
New generations of TCD systems are being developed in a way to overcome these drawbacks. Proposed solutions involve new enhancements, such as the servo-controlled po-sitioning of the ultrasound probe [3] and the possibility of long-term recordings with the micro-emboli detection pro-cess being performed offline through a computer [3]. A French firm, Atys Medical, implemented a Holter system based on the innovative idea of R. Aaslid [4],[3]. Challeng-ing issues fall under two main categories: artifact rejection and detection of weak micro-embolic signals. This paper focuses on weak micro-emboli detection only.
Many research works were carried out attempting to develop methods to detect weak micro-emboli robustly. Most of these works have tackled the issue by adapting the threshold to the decision information on which the detec-tion is performed. When the decision informadetec-tion is time-varying, a time-varying threshold is expected and when the decision information is constant, a constant threshold is expected. Otherwise weak micro-events would never be detected.
Concerning methods with time-varying threshold, de-tecting weak micro-events may consist in using a predic-tion modeling where the probability to find a micro-embolic event is supposed to be very weak. When the random
fluctuation of the prediction error is supposed to be het-eroscedastic [5] (a specific case of non-stationarity where the variance is time-varying) a GARCH Model [6, 7] can be used. In addition, when the random fluctuation of the prediction error is supposed to be cyclostationary [8] (sta-tistically stationary per cycle), a synchronous AR model can be used [9]. In such a paradigm, the decision infor-mation can be the auto-correlation of the prediction error and the problem resides in the choice of the threshold.
Concerning methods with constant threshold, as the micro-embolic event is of narrow band nature, detecting weak micro-events may consist in using band pass filters encompassing the spectral signature of the micro-embolic event [10]. This solution was first proposed in [10] and was applied directly on the Doppler signal. By using such a band pass filter on the Doppler signal amplitude, the low frequency component, related to the cardiac rhythm, is removed singly and therefore the remaining signal, com-posed of random fluctuations, becomes the decision infor-mation. Thus, in the decision information, the intensity of the micro-embolic event is now more magnified with re-spect to the background Doppler signal. Therefore, the detection capability of the detector is improved. However, in a blind detection paradigm, there is a price to pay: the frequency of the micro-embolic signal must be known be-fore the filtering step. As it is impossible to know this frequency, other methods were introduced. These meth-ods proposed to use a bank of juxtaposed filters in which the spectral band is divided into several narrow sub-bands and where the detection can be operated independently in each sub-band. Depending on the spectral division, several filter types can be found: bank of narrow band filters with the same width [11], discrete wavelet decomposition [12], and wavelet packet decomposition [13]. By using these different kinds of filters, the difficulty lies in the choice of the constant threshold in each sub-band and on the fusion of the detection since a micro-event can appear in several consecutive sub-bands.
To sum up, even though there exists plenty of robust methods for detecting micro-embolus, few of them are re-ally capable of detecting very weak micro-embolic signals. As mentioned previously, the main problem lies in the choice of the threshold that must be adapted to the de-cision information.
In this paper, we tend to detect the lowest intensity micro-embolic signals in a robust manner using adaptive thresholding. This would allow detecting micro-emboli of very small sizes. This adaptive thresholding is applied from energy signal fluctuations. The new method will be compared to both energy-based constant threshold derived from the whole band spectrum (standard detector) and from sub-band spectrum.
Notice that this study is an extension of a previous work we proposed [14], and includes higher number of tested signals. However, in the present study, we have omitted the rise rate calculation phase we used in [14] due to its high complexity. We have also added a training
phase to optimize the detection thresholds.
2. Materials and Methods
2.1. The Proposed Offline Detection Unit
It is widely stated when the Rayleigh scattering is valid, that the energy of the backscattered Doppler signal is proportional to the size of the scatterer to the power of 6 [13, 15, 16] and the energy returned by an embolus is greater than that returned by billions of red blood cells. Hence, energy would function as a solid decision informa-tion from which the presence of micro-emboli could be de-tected. This justifies why our offline1 detectors are chosen
to be majorly based on energy criteria.
Commercial TCD systems (from Atys Medical, DWL®, Medilab GmbH, Natus®, Scimed™, Skidmore Medical Ltd.,...) employ spectral estimators based on the Short Time Fourier Transform (STFT). The STFT spectral estimator with a sliding window can be formally written as:
S(t, f ) = Z x(τ ) · w∗(t − τ ) · exp−2πjf τdτ 2 , (1) where x(t) is the analysed Doppler signal, w(t) is the slid-ing window and ∗ stands for complex conjugation. Note that after a preliminary stage of experimental optimiza-tion of the STFT parameters based on the study done in [17], the STFT in this study is performed using a 15 ms-Hamming window with an overlap of 65%. Moreover, calculations of the STFT and the instantaneous energy are carried out repetitively on 5 second segments extracted from the Doppler signal. This value is fixed to 5 seconds because it corresponds to the time duration on the spectro-gram plotted on commercial devices. It allows a good vi-sualization of different events that may occur. From STFT defined in equation 1, the instantaneous energy at a fixed time t can be obtained by:
E(t) = Z
S(t, f )df. (2) At that stage, we assume that the instantaneous energy E(t) = α(t) + γ(t), represented in blue in Fig.1a, can be expressed through a low frequency component α(t), repre-sented in red in Fig.1a, and a high frequency component γ(t)represented in Fig.1b. The low frequency component that is the cyclic cardiac component α(t) is removed from the instantaneous energy. This is done first by evaluat-ing the trend α(t) through a smoothevaluat-ing step and then by subtracting it from E(t). The remaining fluctuation2 γ(t)
can be decomposed into a positive fluctuation γpos(t)and
a negative fluctuation γneg(t):
γ(t) = γpos(t) + γneg(t), (3)
1Note that because the system is offline, the computational cost
is not a prior issue.
2The random fluctuation is due to the random positions of billions
of red blood cells traveling into the blood flow.
where γneg(t) = γ(t) < 0 represented in green in Fig.1b
and γpos(t) = γ(t) > 0represented in blue in Fig.1b.
As expected, the envelope (or the amplitude) is not constant as it fluctuates at the cardiac rhythm. The sig-nal is heteroscedastic [5], i.e. its energy varies cyclically with time, due to the local time-varying amount of red blood cells in the sampling volume. On the other hand, due to the time-varying blood speed, the observed process is quasi-cyclostationary [8], since the energy fluctuation (variance) is time dependent or even quasi-periodic. Such properties already reported in previous works [9, 7, 18], lead to using a time-varying threshold. Histograms of the positive γpos (in blue) and negative γneg fluctuations (in
green) are reported in Fig. 1c. Absolute difference signal d(t) = |env (t) − γpos(t)| where the envelope is env(t) =
− |γneg(t) + j · H (γneg(t))| with H(·) the Hilbert
trans-form, and a detection threshold (6.5 × σd, σd being the
standard deviation of d(t)) is reported in Fig. 1d (red dashed line).
In a statistic point of view, the stochastic nature of the fluctuation can be formalized by a probability density P(γ). This probability density is assumed firstly to be the summation of the probability densities from the positive and negative parts of the energy fluctuations:
P(γ) = P(γpos+ γneg) = P(γpos) + P(γneg), (4)
and secondly to be even when no micro-HITS and no ar-tifacts are present:
P(γpos) = P(−γneg), (5)
where P(γpos) = P(γ) · θ(γ)with θ(γ) the Heaviside
func-tion and where P(γneg) = P(γ) − P(γpos) = P(γ) · θ(−γ).
Note that, due to the presence of micro-HITS, the his-togram depicted in Fig.1c is no more completely even.
In order to validate the even distribution hypothesis of energy fluctuations, a Kolmogorov-Smirnov test was performed from the fluctuation energy derived from the recording database; the null hypothesis being P(−γ) = P(γ). The null hypothesis is verified with a p-value of 0.25 when no micro-emboli or artifacts are present. The null hypothesis is rejected with a p-value of 0.007 when micro-emboli or artifacts are present.
However, the knowledge of the probability law is not the most relevant point3, here the key point is the even
property of the probability density. Hence, the positive part of the energy represents the same fluctuations as the negative part but corrupted with High Intensity Transient Signals (HITS), that are outside the statistics. In other words, the positive part of the energy is symmetric to the negative one except when HITS occur. Thus, by using the symmetrical property of the probability density of the fluc-tuation, it is possible to calculate a time varying threshold
3Notice that it was shown in [13] that the cyclostationary
distri-bution of the Doppler energy is Gaussian.
based only from the negative amplitude of the fluctuation and then apply it on the positive part to detect the strictly positive HITS.
Consequently, the weak micro-embolus signals can be detected by a binary test used in all detectors:
γ(t)
H1
≷
H0
λ(t). (6)
If the instantaneous energy fluctuation γ(t) is greater than the detection threshold, then an embolus is detected (hy-pothesis H1), otherwise no embolus is detected (hypothesis
H0).
Knowing that the Doppler signal is quasi-cyclostationary, the quasi-periodically time varying threshold λ(t) (see Fig. 1b) is proposed to be dependent on the envelope of the negative energy fluctuations plus a constant to be set:
λ(t) = env (t) + m · σd, (7)
mbeing a constant to be set (m = 6.5 in Fig.1d).
This envelope is then transferred and applied onto the positive energy fluctuations (Fig. 1b) where the detection process in equation 6 is performed. When the signal in the positive energy fluctuation is higher than the time-varying threshold, the detector is triggered and the peak is recorded. To sum up the method, a pseudo-code is avail-able in appendix.
2.2. Study Design
The different detectors we propose in this study are tested from Holter TCD recordings. The Doppler signals were recorded, in a non-interventional practise at the Cen-tre Hospitalier Regional Universitaire (CHRU) of Lille (2 avenue Oscar Lambret 59000 Lille, France). The clinical study was approved by the ethical committee of the CHRU of Lille. The Holter Transcranial Doppler System-TCD-X (TCD-X, Atys Medical, Soucieu-en-Jarrest, France) along with the description of data collection can be found in our recently published articles [14, 19].
All medical acts were performed in the usual way, with-out any additional procedure for diagnosis, treatment or monitoring. The recording analysis here was an a posteri-ori study where the results have no interference with tient care. In this retrospective study, recordings from pa-tients with asymptomatic high-grade carotid stenosis were kept. We excluded the recordings from patients with ab-sence of an acoustic window necessary for TCD and with-out non-biological prosthetic heart valves.
After the clinical exam, the gold standard of detection was constituted as in [20]. Embolic signals were identi-fied on the basis of their characteristic sound and visually inspected signatures on the spectrogram as stated in [20] by three blinded expert observers of our laboratory. Upon identification of micro-emboli, the experience level of the experts had not been considered as a critical factor. This had been stated in [21, 22] where micro-embolic signatures
Figure 1: Application of our detection technique based on negative energy fluctuations. a) The instantaneous energy of the Doppler signal in blue is represented along with the low frequency component α(t) in red. b) The smoothing curve is subtracted from the instantaneous energy resulting in energy fluctuations (positive fluctuations > 0 in blue and negative fluctuations < 0 in green). A negative time-varying envelope (red) is then constructed from the negative fluctuations. The constructed negative time varying envelope is opposed and applied on the positive fluctuations. c) Histograms of the positive (in blue) and negative fluctuations (in green), respectively. d) Absolute difference signal d(t) between the envelope and the positive fluctuation (in blue) : d(t) = |env(t) − γpos(t)| and detection threshold (in dashed red
vertical line). Vertical red lines for different values of the standard deviation σdof d(t) from σdto 7 × σdand a red dashed vertical line for
the proposed threshold of 6.5 × σd.
could be detected equally by both experts and non-experts. Finally, the time positions of agreed-on micro-emboli were noted.
The use of the TCD Holter version results in an in-crease in the number of signal artifacts. For this reason, a manual artifact rejection system was applied as in [14, 19]. 2.3. Database
Our data-set is composed of 32 signals of 63 ± 5 min-utes in average and derived from 32 patients. The database is divided into two categories. The first category includes 10signals (derived from 22 patients) dedicated to achieve the training phase. The second category includes 22 sig-nals (derived from 22 patients) on which the experimenta-tion methods are tested and results are analysed. The data-set size is similar to previous studies [10, 12, 22], where the mean value is around 21 patients.
To evaluate the results of the different detectors, we compare these results to the gold standard of detection established initially. The basic statistical tools calculated for our evaluation and used to make up the Receiver Op-erating Curve (ROC) were:
• Detection Rate (DR): calculated as the number of true positive detections divided by the number of gold standard detections. True positive detection refers to the detection of an embolus recorded in the gold standard. The Non-detection rate (NDR) is cal-culated as NDR = 1 − DR;
• False Alarm Rate (FAR): calculated as the number of false positive detections divided by the total num-ber of detections. False positive detection refers to the detection of an embolus not recorded in the gold standard or in other words an embolus which has not crossed the sample volume;
• Area Under the Curve (AUC): calculated as the area under the receiver operating curve.
3. Results
The results are divided into two phases. The first is the training phase through which we determine the optimal settings of our implementations. The second is the testing 4
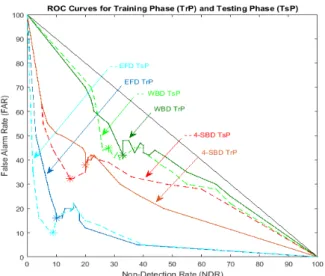
Figure 2: ROC curves for different values of thresholds in the Train-ing Phase (TrP) and TestTrain-ing Phase (TsP) for the Energy Fluctu-ations Detector (EFD in blue/dashed cyan), 4-Sub-Band Detector (4-SBS in brown /dashed red ) and standard Whole Band Detector (WBD in dark green/ dashed green). When no embolic signal is de-tected, curves tend to a straight line that passes through the point (0, 1) and (1, 0). For ideal methods, curves tend to the point (0, 0).
phase through which we evaluate the performances of the new detector with optimal settings.
Furthermore, the new method we have proposed, is compared first to standard Whole Band Detectors (WBD) and second to Sub-Band Detectors (SBD). First, for WBD, the detection process in equation 6 is performed using a constant threshold; i.e. it is fixed empirically by the user for the entire examination. It is patient-, operator-, and device-dependent. The threshold is set above the maximal background energy of the Doppler signal when no embolus is present [20]. For SBD, the same detection procedure is applied to the spectral band divided into several narrow sub-bands and the detection is operated independently in each sub-band. The energy detector is composed of N detectors associated with N Doppler frequency sub-bands. Note that SBD is a particular case of WBD where N = 1.
3.1. Training Phase
The training phase allowed to be adjusted the best val-ues through maximizing the detection rate and minimizing the false alarm rate.
Fig. 2 shows that the best results are obtained by the Energy Fluctuations Detector (EFD) represented by the blue solid curve which is the closest to the ideal point (0% FAR and 0% NDR) compared to both the brown solid curve representing the 4-Sub-Band Detector4(4-SBD) and
the green solid curve representing the Whole Band Detec-tor (WBD).
4Note that the number of sub-bands than gives the best
trade-off between complexity and False Alarm Rate and Detection Rate is N = 4.
The latter results were confirmed by the Area Under the Curve5(AUC) calculations presented in Table 1. The
AUC for EFD (9%) was lower than both the AUC for the 4-SBD (26%) and the AUC for the WBD (42%). The highest performance of the EFD was obtained with a threshold calculated for m=6.5 (refer to eq. 7). The Detection Rate (DR), the Non-Detection Rate (NDR) and the False Alarm Rate (FAR) are reported in Table 1. For EFD, DR was 90%, FAR was 16% and the NDR 10%. The results for the other detectors are also reported in Table 1. For 4-SBD, DR was 80%, FAR was 38% and the NDR was 20%. For WBD, DR was 67%, FAR was 42% and the NDR 33%.
3.2. Testing Phase
In order to assess the performances of our new detector, we compared the best testing phase results obtained with 4-SBD and WBD. Fig. 2 shows that the best results were obtained by EFD (blue curve) which was the closest to the ideal point (0% FAR and 0% NDR) compared to 4-SBD (in orange curve) and WBD (green curve). The latter results are confirmed by the Area Under the Curve (AUC) calculations presented in Table 1. The AUC for EFD (8%) was lower than both the AUC obtained by 4-SBD (29%) and WDB (40%). The highest performances of EFD were obtained with a threshold calculated with m = 6.5 (refer to eq. 7). DR, NDR and FAR are reported in Table 1. For EFD, DR was 92%, FAR was 10% and NDR was 8%. Results for the other detectors are also reported in Table 1. For 4-SBD, DR was 85%, FAR was 32% and the NDR was 15%. For WBD, DR was 68%, FAR was 40% and the NDR 32%.
By comparing the ROC results obtained during the Training Phase (TrP) and the Testing Phase (TsP) in Fig. 2, it is clear that the results in both phases are very sim-ilar. This proves the homogeneity of our chosen dataset; homogeneity being a solid indicator that the statistical properties of one part of an overall dataset are the same as any other part.
4. Discussion and Conclusion
To overpass the performances of existing methods in terms of false alarm rate and detection rate, we proposed an original method based on the instantaneous energy fluc-tuations.
Aims were reached since our method overpasses exist-ing methods by a factor of 5 on AUC (Area Under the Curve) criterium in regards to the whole band detector (WBD) and a factor of 4 in regards to the 4-subband detec-tor (4-SBD). This new method relies on two assumptions one of which is completely novel.
The first hypothesis concerns the non-stationary na-ture of Doppler signal. Indeed, by taking into account the
Table 1: Area Under the Curve (AUC), Non-Detection Rate (NDR), False Alarm Rate (FAR), Detection Rate (DR) for Whole Band Detector (WBD), 4-Sub-Band Detector (4-SBD) and Energy Fluctuations Detector (EFD). Results for the training phase (TrP) and testing phase (TsP).
Detector AUC (%) NDR (%) FAR (%) DR (%) Type TrP TsP TrP TsP TrP TsP TrP TsP WBD 42 40 33 32 42 40 67 68 4-SBD 26 29 20 15 38 32 80 85
EFD 9 8 10 8 16 10 90 92
heteroscedasticity and the quasi-cyclostationarity of its in-stantaneous energy, a time-varying threshold may possible to detect the smallest micro-embolic signatures. Without taking into account this hypothesis, the threshold would have been constant and the detection would have been limited to the detection of biggest micro-emboli.
The second hypothesis is completely novel, since the calculation of the adaptive threshold is based on the even property of the instantaneous energy fluctuation distribu-tion. Note that the nature of the distribution is not lim-ited to the Gaussian law and it can be extended to all even distributions. The sensitivity of the method is limited to weak micro-emboli with energies just superior to the back-ground energy fluctuations. Consequently, to additionally increase the detection rate of very weak miro-emboli, an average procedure to reduce the background energy might be envisaged.
The combination of these two assumptions leads to im-plement a time-varying threshold in a simple way in re-gards to existing methods.
However, before implementing such detector into a com-mercial TCD system, an automatic artifact procedure should be developed. The second point that could be interesting to investigate is to go further in the methods mixing sub-band and energy fluctuations as tempted by [23] with few patients. Such methods implemented in a commercial TCD, could be a more sensitive and more robust to de-tect the smallest microemboli. A future multicentre study will be necessary to check the improvement of the medical diagnostic.
Acknowledgements
The authors would like to acknowledge Marilys Almar and Benoit Guibert (Atys Medical) for the holter TCD. They thank also Corinne Gautier (CHRU of Lille) for the Doppler Data.
This research was financially supported by the Doc-toral School of Sciences and Technology, Lebanese Uni-versity, Lebanon, the National Council for Scientific Re-search CNRS, Lebanon. This work was also supported by Agence Nationale de la Recherche (Project ANR-10-TECS-006, EMBOLTER).
[1] E. M. Chung, J. P. Hague, D. H. Evans, Revealing the mecha-nisms underlying embolic stroke using computational modelling, Physics in medicine and biology 52 (23) (2007) 7153.
[2] V. Vuković-cvetković, Microembolus detection by transcranial Doppler sonography: review of the literature, Stroke research and treatment 2012.
[3] A. D. Mackinnon, R. Aaslid, H. S. Markus, Long-term ambula-tory monitoring for cerebral emboli using transcranial Doppler ultrasound, Stroke 35 (1) (2004) 73–78.
[4] R. Aaslid, Developments and principles of transcranial Doppler, Transcranial Doppler 1 (1992) 1–8.
[5] H. White, A heteroskedasticity-consistence covariance matrix estimator and a direct test for heteroskedasticity, Econometrica 48 (1980) 817–838.
[6] T. Bollerslev, Generalized Autoregressive Conditional Het-eroscedasticity, Journal of Econometrics 31 (1986) 307–327. [7] J.-M. Girault, S. Ménigot, L. Deibine, Automatic detection of
micro-emboli by means of a generalized autoregressive condi-tional heteroskedasticity model, The Journal of the Acoustical Society of America 128 (4) (2010) 2304–2304.
[8] W. A. Gardner, A. Napolitano, L. Paura, Cyclostationarity: Half a century of research, Signal Processing 86 (4) (2006) 639– 697.
[9] S. Ménigot, L. Dreibine, N. Meziati, J.-M. Girault, Automatic detection of microemboli by means of a synchronous linear pre-diction technique, in: 2009 IEEE International Ultrasonics Sym-posium (IUS), IEEE, 2371–2374, 2009.
[10] H. Markus, M. Cullinane, G. Reid, Improved automated de-tection of embolic signals using a novel frequency filtering ap-proach, Stroke 30 (8) (1999) 1610–1615.
[11] N. Aydin, H. S. Markus, Detection of embolic signals using wavelet transform., in: NSIP, 774–778, 1999.
[12] N. Aydin, F. Marvasti, H. S. Markus, Embolic Doppler ultra-sound signal detection using discrete wavelet transform, IEEE Transactions on Information Technology in Biomedicine 8 (2) (2004) 182–190.
[13] J.-M. Girault, Cerebral Microembolism Synchronous Detection with Wavelet Packets, chap. 4, Signal and Image Multiresolu-tion Analysis, Wiley Online Library, 245–287, 2013.
[14] M. Geryes, S. Ménigot, W. Hassan, M. Almar, B. Guibert, C. Gautier, J. Charara, J.-M. Girault, A new energy detector of micro-emboli using a time-varying threshold, in: Third In-ternational Conference on Advances in Biomedical Engineering (ICABME), IEEE, 89–92, 2015.
[15] P. M. Morse, K. U. Ingard, Theoretical acoustics, Princeton university press, 1968.
[16] M. A. Moehring, J. R. Klepper, Pulse Doppler ultrasound de-tection, characterization and size estimation of emboli in flow-ing blood, IEEE Transactions on Biomedical Engineerflow-ing 41 (1) (1994) 35–44.
[17] N. Aydin, H. S. Markus, Optimization of processing parame-ters for the analysis and detection of embolic signals, European Journal of ultrasound 12 (1) (2000) 69–79.
[18] J.-M. Girault, Z. Zhao, Synchronous detector as a new paradigm for automatic microembolus detection, International Journal of Biomedical Engineering and Technology 14 (1) (2014) 60–70. [19] M. Geryes, S. Ménigot, W. Hassan, A. Mcheick, J. Charara,
J.-M. Girault, Detection of Doppler Microembolic Signals Using High Order Statistics, Computational and Mathematical Meth-ods in Medicine 2016.
[20] E. B. Ringelstein, D. W. Droste, V. L. Babikian, D. H. Evans, D. G. Grosset, M. Kaps, H. S. Markus, D. Russell, M. Siebler,
et al., Consensus on microembolus detection by TCD, Stroke 29 (3) (1998) 725–729.
[21] E. Chung, L. Fan, C. Degg, D. H. Evans, Detection of Doppler embolic signals: psychoacoustic considerations, Ultrasound in medicine & biology 31 (9) (2005) 1177–1184.
[22] E. M. Chung, L. Fan, A. R. Naylor, D. H. Evans, Impact of clinical environment on embolus detection: a comparison of automated and manual detection of Doppler embolic signals, Cerebrovascular diseases 23 (2-3) (2006) 169–174.
[23] M. Geryes, S. Ménigot, J. Charara, J.-M. Girault, An energy detector based on negative energy fluctuations coupled with sub-band decomposition as a robust micro-embolus detection system, in: 2017 IEEE International Ultrasonics Symposium (IUS), IEEE, 1–4, 2017.
Pseudo-code of the Algorithm
Algorithm 1Pseudo-code of the micro-embolus detection using the detector based on energy fluctuations
Input: Doppler instantaneous energy signal E(t) identi-fied by eq. (2)
Output: Micro-embolic detection h(t) i ← 1
for i = 1 do
E(t) ← short time Fourier transform s(t, f) defined in eq. (2);
Compute E(t); end for
for i = 1 do
Obtain fluctuations γ(t) ← evaluate the trend and subtract it to E(t);
Compute energy fluctuations γ(t)
Obtain the envelope of the negative fluctuations γneg(t)
end for for i = 1 do
Apply the envelope γneg(t) on the positive
fluctua-tions γpos(t) ←define the envelope as a threshold λ(t)
Optimize the threshold λ(t) ← training phase ; Compute optimal threshold λ(t);
end for
if γpos(t) > λ(t) then
Embolus h(t) is detected and counted end if