HAL Id: hal-03053645
https://hal.archives-ouvertes.fr/hal-03053645
Submitted on 11 Dec 2020
HAL is a multi-disciplinary open access
archive for the deposit and dissemination of
sci-entific research documents, whether they are
pub-lished or not. The documents may come from
teaching and research institutions in France or
L’archive ouverte pluridisciplinaire HAL, est
destinée au dépôt et à la diffusion de documents
scientifiques de niveau recherche, publiés ou non,
émanant des établissements d’enseignement et de
recherche français ou étrangers, des laboratoires
piezoelectric LiNbO3
Vincent Polewczyk, Michel Hehn, Arnaud Hillion, Sylvie Robert, Pascal
Boulet, Karine Dumesnil
To cite this version:
Vincent Polewczyk, Michel Hehn, Arnaud Hillion, Sylvie Robert, Pascal Boulet, et al.. Epitaxial
growth of magnetostrictive TbFe2 films on piezoelectric LiNbO3. Journal of Physics: Condensed
Matter, IOP Publishing, 2019, 31 (40), pp.405801. �10.1088/1361-648X/ab27e6�. �hal-03053645�
Epitaxial growth of magnetostrictive TbFe
2
films
on piezoelectric LiNbO
3
Vincent Polewczyk,
1Michel Hehn,
1Arnaud Hillion,
1Sylvie Robert,
1Pascal
Boulet
1and Karine Dumesnil
11Institut Jean Lamour, CNRS-Université de Lorraine, 54000 Nancy, France
E-mail: vincent.polewczyk@gmail.com
Abstract
The TbFe2 compound has been deposited by Molecular Beam Epitaxy on Lithium Niobate
(LN) substrates with different orientations (LN Z-, 128 Y- and 41 Y-cuts). Despite the challenging growth on these unconventional substrates, crystalline TbFe2 films (as a single
orientated domain or with a limited number of orientations) of reasonable structural quality could be obtained after the deposition of a Mo buffer layer. Detailed and combined RHEED and X-ray analysis permitted to unravel the complex Mo and TbFe2 crystal orientations and to
reveal common 3D Orientation Relationships (OR) between the different lattices, whatever the initial LN cut. The magnetic properties and especially the magnetic anisotropy have been investigated in taking magnetocrystalline, magnetoelastic and magnetostatic contributions into account. These promising results on the epitaxial growth of hybrid piezoelectric/ magnetostrictive crystalline system constitute an important step towards the control of magnetization via electrically generated static and/or dynamic strains, and towards the development of magnetic sensors based on Surface Acoustic Wave devices.
Keywords: hybrid nanostructures, epitaxial growth, TbFe2, magnetostriction, piezoelectric substrate.
1. Introduction
The control of the magnetization and/or the magnetization dynamics in a reliable, fast and low energy consumption way is of paramount interest in the field of data storage, data manipulation and signal processing. The magnetization itself constitutes the storage unit cell while magnons can transport information without charge transfer. Beyond the classical use of DC or AC magnetic fields, several levers are under consideration to interact with magnetization, driving both the emergence of new physics and the development of new architectures for applicative devices. One can mention the spin polarized electric current acting via Spin Transfer Torque on magnetic elements, the pure spin current generated in strong Spin Orbit coupling materials neighboring a magnetic layer, the light for which the underlying mechanisms of interaction with magnetization are still
especially efficient in multiferroic materials, where magnetic and electric order parameters coexist and are sufficiently coupled. Such materials are however scarce and current studies therefore tend towards the so-called hybrid multiferroic systems, combining magnetic and ferroelectric materials. The required coupling between order parameters should then be insured at the interfaces between both phases via elastic coupling, i.e. transmission of strains.
This emerging research field combining magnetization and strains has been recently referred to as straintronics. It covers the wide area of mutual interaction between these two parameters (static and/or dynamic) that can each be controlled/excited/detected by different ways: magnetic field, light, voltage… [1,2] Systems combining magnetostrictive and piezoelectric materials have already been investigated for a few decades, one main objective being first to sense an external magnetic field via the
Acoustic Wave characteristics [3,4]). But recent promising achievements have also driven a renewed attention in the community involved in the magnetization manipulation, with the acoustically driven ferromagnetic resonance, magnetization switching, assisted domain wall motion… [5-7]
The devices generally synthetized in straintronics are based on well-known piezoelectric materials such as quartz, lead-zirconate-titanate (PZT), Lithium Niobate (LiNbO3) and simple magnetic materials such as Ni or
Co. Some groups have nevertheless explored more complex magnetic materials with expected enhanced magnetostriction (Terfenol-D), but always in amorphous or polycrystalline form that doesn’t exhibit the highest possible magnetostriction. [8-10]
The main goal of this study is to go a step further, towards the growth of single crystalline highly magnetostrictive materials that could be in strong structural coupling with the piezoelectric phase. The Terfenol (TbFe2) is the first
candidate due to its record room temperature magnetostriction (2000 ppm). [11] It crystallizes in the so-called “Laves phase” cubic structure (space group 3 ) and is ferrimagnetic with a Curie temperature of 425°C.
The epitaxial growth of single crystalline TbFe2 has been
previously achieved on sapphire substrates along different growth directions and using different types of buffer layers: (110) TbFe2 on Al2O3 (1120) with a
NbFe-α buffer; (111) TbFe2 on Al2O3 (1120) with a (110) Mo
buffer [12-15]. In both cases, the films are under perpendicular compressive strain and in-plane tensile strain that favor an in-plane magnetization. (111) TbFe2
films were also obtained on Al2O3 (0001) covered by a
(111) Nb buffer. [15] This buffer is however of reduced structural quality due to the presence of facets because of very low surface free energy for (110) Nb. One study finally reports on the possibility to achieve the epitaxial growth of (111) TbFe2 films on a LN substrate (Z-cut
orientation), using a double Ti/Mo buffer layer.[16] This film is submitted to a perpendicular tensile strain and an in-plane compressive strain that tend to favor perpendicular magnetization. Despite this success in growing TbFe2 on LNZ-cut, the authors emphasize the
difficulties related to the low stability of LN at high temperature with the possible Li diffusion. The double Ti/Mo buffer is supposed to form an efficient chemically inert diffusion barrier.
We present here recent advances in the epitaxial growth and characterization of TbFe2 films synthetized by
Molecular Beam Epitaxy on LiNbO3 (referred to as LN in
the following) substrates with different orientations (Z-,
128Y- and 41Y-cuts), and using a single Mo buffer layer. The growth on LN128Y- and 41Y-cuts is particularly interesting due to their strong piezoelectric response and therefore their use for SAW applications, but challenging due to unconventional surface planes. [3,4,17-20] A single Mo buffer layer is chosen to limit the amount of material between the magnetostrictive and piezoelectric phases and thus to possibly enhance the elastic coupling required in these hybrid multiferroic systems.
In the following, and for the three LN orientations, combined RHEED and extensive X-ray experiments (φ-scans on asymmetrical reflections, pole figures) are analyzed and discussed to unravel the structural characteristics, the different orientation relationships between successive Mo and TbFe2 layers and the possible
occurrence of multiple domains and variants,. The different LN cuts are first presented, then we analyze the results concerning the Mo buffer and the TbFe2 layers
successively. A special paragraph is finally devoted to the TbFe2 magnetic properties.
2. Different cuts of LN substrates
Crystal cuts of LN are of prime importance for LN-based device properties because they dictate the surface properties, especially piezoelectric and optical properties. This material has a trigonal crystal structure (R3ch), which may be represented by a rhombohedral or by an hexagonal unit cell. In the four axis hexagonal coordinate system, the 1-axis (//a-axis) and 4-axis (//c-axis)
correspond to <112̅0> and <0001> crystallographic directions respectively. The various LN surface orientations are usually described by using a (X,Y,Z) orthogonal reference axis, with X parallel to , Z parallel to and Y resulting from the right hand rule.
The three different LN cuts/orientations used as a substrate for the TbFe2 growth are depicted in figure 1 (a):
(i) LN Z, where the cut (in red) is perpendicular to the Z-axis (ii) LN 128Y, where the cut (in blue) is perpendicular to a direction rotated (counterclockwise) by 128° from Y around X. The [0001] crystal axis is thus tilted by -38° from the normal to the surface (iii) LN 41Y, where the cut (in green) is perpendicular to a direction rotated (counterclockwise) by 41° from Y around X. The [0001] crystal axis is thus tilted by +49° from the normal to the surface. The figure 1 (b) gathers the stereograms associated to these orientations. The positions of the poles are referred by azimuthal (φ) and polar (χ) angles and correspond to the orientation in space of the directions normal to specific planes. The center corresponds to the surface normal, while the outer circle (χ = 90° from the center) corresponds to the surface plane. For each of the
three cuts presented here (in red, blue and green), the in-plane orientation is chosen with the X-axis lying along the horizontal direction. The 0001 pole is shown with a star symbol while dots and squares correspond respectively to <1120> and <1100> directions, all lying in the (0001) basal plane. Two extra poles (diamond symbols) have been added for LN128 and 41Y-cuts, in order to indicate the main directions close to the surface normal. The 1014
pole is strictly perpendicular to the surface for LN 128 Y-cut ( 1014 planes are parallel to the surface and exhibit a rectangular surface symmetry), while the 0112 pole is tilted by 8° from the surface normal for LN 41Y. The surface of LN 41Y-cut thus doesn’t correspond to any specific crystallographic plane.
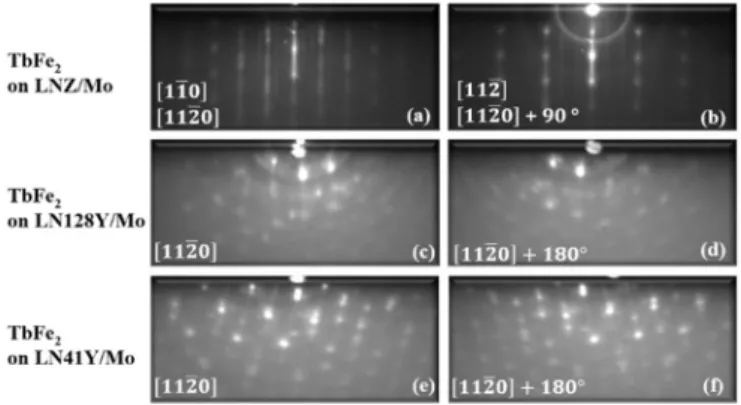
Before any deposition experiments, the LN substrates are first cleaned with acetone and isopropanol, and rinsed with de-ionized water. The outgas process in the Ultra High Vacuum (UHV) chamber is then limited to one hour at 500°C to prevent from a possible deterioration at high temperature. [16] At this temperature, we don’t observe
any change in the LN RHEED patterns and any increase of pressure which remains in the low 10-10 Torr range. The
observed RHEED patterns are given in figure 2 for the various LN cuts and along two different azimuths, rotated by 90° for LNZ ((a) and (b)) and LN128Y ((c) and (d)), and rotated by 180° for LN41Y ((e) and (f)).
RHEED measurements are relatively difficult due to the insulating nature of the substrate, but remain possible when increasing the temperature and grounding the substrate holder. The observation of Kikuchi lines for the three different cuts confirms the good crystalline quality of the surface. For LNZ ((a) and (b)) and LN128Y ((c) and (d)), the RHEED analysis (especially the inter-streaks distances and the surface symmetry) allows us to identify the main [1120] azimuthal direction. For LN41Y ((e) and (f)), the absence of specific crystalline planes parallel to the surface gives rise to unconventional patterns without obvious surface symmetry that cannot be simply analysed. The determination of the in-plane X direction is possible from the information provided by the supplier and is verified by X-ray diffraction experiments. One can nevertheless interestingly notice that the two patterns collected along X and in rotating the surface by 180° are not similar, but exhibit streaks that are either positively or negatively tilted respect to the vertical direction. Given the experimental tilt angle of ± 8°, those patterns likely originate from diffraction process in the (0112) planes (tilted by 8° from the macroscopic surface), as it is reported in the case of stepped surfaces. [21,22]
3. Crystalline order and orientation of the Mo
buffer on LN substrates
The Molybdenum is evaporated from an electron gun. The deposition has been performed with different
deposition rates in the [0.02– 0.07nm.s-1] range and for
several thicknesses [20-100nm], without a clear incidence of these parameters on the crystalline quality. The results presented in this paper correspond to 50 nm thick Mo films.
High temperatures, typically above 700 °C, are generally reported as optimal for the deposition of high quality Mo films on sapphire substrates. [14,15,23] The likely degradation of LN at high temperatures led us to test lower deposition temperatures in the [400°C - 800°C] range. In contrast to the results obtained on sapphire, X-ray analysis shows that the crystalline quality for deposition on LNZ-cut decreases for deposition temperatures above 500 °C. On LN128Y and 41Y-cuts, the optimal temperature is 650 °C.
The figure 3 presents the RHEED patterns collected after the Mo deposition on LNZ ((a) and (b)), LN128Y ((c) and (d)) and LN41Y ((e) and (f)) at these optimal temperatures. The azimuthal directions are labeled respect to the underlying LN surface.
For LNZ/Mo, two typical patterns separated by 30° are observed every 60°. In both cases, one can observe the superposition of two diffraction patterns that could not be separated in changing the azimuthal angle and that could not be simply identified. In addition, streaks are relatively diffuse and dotted, revealing a 3D character, i.e. a surface roughness.
For the other LN cuts, the RHEED images obtained when changing the azimuthal angle after the Mo deposition are constituted of elongated dots and obviously do not form conventional diffraction patterns. It is impossible to identify a specific surface symmetry from the succession of azimuthal angles. Finally, the images collected for a given azimuthal angle and when rotating by 180° from this angle are systematically different. All those observations indicate a complex crystal orientation and the absence of Mo high symmetry crystal planes parallel
to the macroscopic substrate surface. One can nevertheless notice an interesting point: the images collected along LN X and LN X+180° directions reveal inclined broad lines formed by vertically elongated features; the lines are tilted by approximately ± 38° with respect to the surface normal for Mo on LN128Y and by ± 49° for Mo on LN41Y. Those patterns are consistent with the presence of inclined crystalline planes, the intersection of which with the film surface is parallel to the LN 1120 direction. The tilt angles of these lines are by the way of opposite signs between the two substrates. In order to unravel these orientations, both in the sample plane but also more generally in the space, Mo pole figures have been measured by X-ray diffraction (D8 discover (Bruker)). While the detector position is fixed at a given Bragg angle corresponding to a family of equivalent inter-reticular planes, the sample is both rotated around its normal (angle φ) and tilted from the vertical (angle χ). The angular positions where a significant intensity is measured permit to identify the orientation of the normal to the corresponding planes, the so-called poles.
Figure 4 presents the 110 Mo poles measured for the films deposited on the three different LN substrates ((a), (c) and (e) in left column). φ angles vary in the [0°-360°] range while available χ angles lie in the [0°-80°] range. The sample is initially positioned with the in-plane LN X-axis along the horizontal axis (φ = 90°).
The experimental pole figures obviously show more 110 poles than the number expected from a single domain with a cubic structure (6); this reveals the presence of several Mo crystalline domains. The three figures are symmetrical with respect to the vertical axis and one of the 110 Mo poles is superimposed with the 0001 LN pole (labeled with a star symbol). Since the LN X-axis is horizontal for φ = 90°, the LN 0001 poles appear for φ = 0° or 180° (vertical axis) and for χ angles of 0° in LNZ and 38° (resp. 49°) in LN128Y (resp. LN41Y), as it is shown in figure 1 (b) and as it has been verified experimentally (not reported here).
A first Orientation Relationship (OR) between LN and Mo lattices is consequently:
110 Mo // 0001 LN
These (110) Mo and (0001) LN planes are parallel to the macroscopic sample surface in the case of the LN Z substrate, which is easily verified by specular large angle X-ray scattering experiments. [20] In the cases of LN 128Y and LN 41Y, those parallel planes are tilted by 38° and 49° from the sample surface and intercept the surface plane along the LN X direction. These characteristics are consistent with the specific RHEED images observed when the electron beam is parallel to LN X-axis.
Figure 3. RHEED patterns collected for 50 nm thick Mo films deposited at 450°C on LN Z (a and b), at 650°C on LN 128 cut (c and d) and LN 41 Y-cut (e and f). The azimuthal directions are labeled respect to the underlying
The OR between (110) Mo and (0001) LN parallel planes are obtained in combining the poles figure with so-called phi scans for selected Asymmetrical Reflections (AR) for the LNZ substrate (figure 5). The phi scans have been measured using a PANalytical MRD XPert Pro diffractometer. The Mo (310), (121) and (222) AR are chosen since their azimuthal position would correspond respectively to in-plane <001>, <111> and <110> directions. LN (1129) and (30312) AR are chosen since their azimuthal position would correspond respectively to in-plane <1100> and <1120> directions.
As expected for LN Z-cut, 30° separate the AR related to <1100> and <1120> in-plane directions (respectively filled red squares and dots in figure 5 (a)). For the Mo films, the φ scans permit to identify four <001> (rotated by 60°) and four <110> directions (rotated by 60°) over the 180° angular range. These reveal the occurrence of three (110) domains rotated by 60° and the following in-plane OR respect to the LN lattice:
Mo 001 // LN 1100 Mo 110 // LN 1120
The main poles expected from the three Mo domains following these OR are given in figure 5 (b) (empty symbols in three different colors). The main in-plane poles for LN are labelled with red filled symbols. One can notice that in-plane Mo <111> directions (hexagon cross symbols) are localized at ± 5° from <001> in-plane directions (diamond empty symbols), which is confirmed by the experimental φ scans for (121) Mo AR (blue symbols in figure 5 (a)). Similarly, <113> in-plane directions (not presented here) are localized at ± 5° from in-plane <110> directions (circle empty symbols). The observed RHEED patterns (figure 3 (a and b)) correspond to the resulting superposition of the diffraction patterns since the in-plane spread of crystal orientation doesn’t allow a clear separation between
these. The ratio between inter-streaks distances have been checked to be 1.41 between 110 and 001 azimuths (figure 3 (a)) and 1.92 between 111 and 113 azimuths (figure 3 (b)).
For LN128Y and LN41Y substrates, the experimental positions of 110 Mo poles have been compared to those expected from the occurrence of three domains in the (110) Mo plane parallel to (0001) LN plane, with the same OR as those determined on LNZ: Mo < 001 > // LN < 1100 > and Mo < 110 > // LN < 1120 >. The theoretical poles are presented with empty circles (one color for each domain) in the figure 4 (right column). The agreement between experimental and theoretical poles is excellent for two domains (D1 in black and D2 in red), while experimental poles related to the third one (D3 in green) are obviously missing.
The absence of the third Mo domain is surprising given the symmetry of the (0001) LN plane and must be related to a symmetry breaking linked to the surface. As shown by stereograms, some of these missing 110 poles (green
circles in figure 4) are expected for large χ angles. Since (110) Mo planes are known to exhibit a very low surface free energy, (110) Mo surfaces are particularly stable, which most likely favors Mo domains with close-to-the-normal (110) poles. This is the case for D1 and D2 domains for which 110 poles are observed at 30° (resp. 21.5°) from the normal on LN128Y (resp. on LN41Y). The energy of the D3 domain with 110 poles at 34.1° (resp. at 30.3°) and especially one pole at 90° from the normal is likely larger than for other domains; the D3 domain is consequently not favored during the growth process.
These experiments on the three LN substrates consequently reveal the occurrence of a three dimensional orientation relationship between Mo and LN lattices: (110) Mo (110) // (0001) LN
Mo < 001 > // LN < 1100 >
and Mo < 110 > // LN < 1120 >.
The in-plane OR between the (110) Mo and the (0001) LN planes, with the three distinct Mo domains are presented in figure 6 (Mo atoms in blue, Nb atoms of LN in red). In the case of the LN128Y and LN41Y substrates, only two domains are present.
These specific OR between the (110) Mo and the (0001) LN planes are different from the most common OR reported between (110) bcc and (111) fcc lattices (or (0001) hcp lattice), i.e. the Nishiyama-Wassermann and the Kurdjumov-Sachs OR. [24] The currently observed OR, so-called R30-OR (bcc 110 // fcc 110 ), has however been already theoretically predicted and observed in Ce/V bilayers. [25] The stabilized orientations are usually predicted by the rigid-lattice theory and depend on the ratio between nearest neighbor distances in the plane (figure 6 (b)). [26] The most likely orientations are those for which densely-packed rows in (111) fcc and (110) bcc are aligned and for which the distances between the corresponding rows dfcc and dbcc are
close in the two crystals. The equality between dfcc and
dbcc for the different possible OR leads to a criteria based
on the ratio between nearest neighbor distances
/ . [26]
In the case of (110) Mo on (0001) LN in the R30-OR, one can notice the approximate match of 1 Mo : 1 LN atomic rows perpendicular to LN 1120 and of 3 Mo : 1 LN atomic rows perpendicular to LN 1100 , with a resulting mismatch of respectively +16.21% and -5.65%. The optimal ratio r is deduced in equalizing the distances between these atomic rows:
√3 2
3 √3
This leads to a ratio of 0.5 while xMo/yLN = 0.529, which
explains the stabilized R30-OR experimentally observed.
4. Crystalline order and orientation of TbFe
2layers
on LN/Mo templates
The TbFe2 growth is achieved via co-evaporation of Tb
and Fe from Knudsen effusion cells, with typical individual evaporation rates between 0.005 nm.s-1 and
0.02 nm.s-1 [12]. Various substrate temperatures have
been tested in the [500°C – 800°C] range, and optimum results, as observed by RHEED analysis and X-ray diffraction, are obtained for a deposition temperature of 650 °C. The presented results correspond to 50 nm thick TbFe2 films.
Figure 7 gathers the RHEED images obtained for the TbFe2 layers deposited on LNZ ((a) and (b)), LN128Y
((c) and (d)) and LN41Y ((e) and (f)). The azimuthal directions are labelled with respect to the TbFe2 and LN
orientation for LNZ, and with respect to LN for the two other substrates.
On LNZ/Mo, two distinct RHEED patterns are observed, separated by 30° from each other, and repeated each 60°. The streaks appear spotty with the occurrence of inter-streaks on 1/3 positions, usually attributed to a surface reconstruction or a surface structure. The ratio between main inter-streaks distances is 1.73, which is consistent with a (111) surface plane and a [111] TbFe2 growth
direction on this LNZ/Mo template.
The RHEED images obtained after the TbFe2 deposition
on other LN cuts exhibit multiple dots, a high diffuse background and even a slight tendency to form rings (on LN128Y). These are characteristics of a poor crystal order and most likely of the occurrence of multiple domains. One can also mention on LN41Y the presence of tilted dots alignments respect to the surface normal, as it is observed after the Mo deposition. The tilt angles are opposite along LN X and LN X+180°, with the same signs but different values compared with Mo deposits. As in the case of Mo deposits, the complex crystal orientations require the measurements of TbFe2 poles
figures (figure 8) to unravel the relative orientations and orientations relationships. These could be completed with the measurements of φ scans for asymmetrical reflections in the case of LNZ/Mo/TbFe2 (not reported here) for
which the RHEED patterns reveal a high symmetry direction along the surface normal.
The figure 8 presents the 111 TbFe2 poles figures
measured for the samples deposited on the three different LN substrates (left column). The sample is initially positioned with the in-plane LN X-axis along the horizontal axis φ = 90°. The right column corresponds to the theoretical poles, as expected from the OR described in the following.
For the TbFe2 deposit on LNZ/Mo, seven 111 poles are
observed: the central one for χ = 0 being by far the most intense and the six others arising for a same χ = 70° and
separated by 60° in φ, as confirmed by the measurement of φ scans for (440) asymmetrical reflections (not shown here). These are consistent with the presence of two TbFe2 variants rotated by 60°, with [111] along the
surface normal and with the following in-plane orientation relationships with respect to the underlying Mo template and LN substrate:
TbFe 112 /⁄ Mo 001 // LN 1100 TbFe 110 /⁄ Mo 110 // LN 1120
The theoretical positions are given in figure 8 (b) where both 110 Mo (empty circles) and 111 TbFe2 (empty
squares and triangles) poles are shown. Since the (110) Mo deposit forms three domains rotated by 60°, the TbFe2
growth along the [111] direction fits this six-fold symmetry and gives rise to a single in-plane orientation despite the occurrence of three (110) Mo domains. The pole figures measured for TbFe2 deposits on the other
LN cuts (figure 8 (c) and (e)) are more complex. One can notice a higher background and the presence of intense and spatially small spots, likely attributed to spurious
substrate reflections. Broader intense spots are identified as 111 TbFe2 poles: 6 main poles on LN128Y and 10
poles on LN41Y, forming figures that are symmetrical with respect to the vertical axis. An interesting point to underline is the superimposition of two 111 TbFe2 poles
with the 110 Mo poles appearing at the smallest χ values (indicated by red arrows in the right column for χ = 30°
on LN128Y and χ = 21.5° on LN41Y). This indicates the parallel orientation of the corresponding (110) Mo and (111) TbFe2 planes, as it is observed for TbFe2 deposited
on LNZ/Mo. However, in contrast to the LNZ case, these superimposed TbFe2 and Mo poles don’t coincide with
the 0001 LN pole, significantly tilted from the surface normal.
Theoretical stereograms have thus been calculated in considering two TbFe2 domains and associated variant
with (111) planes parallel to (110) Mo and similar OR as the one deduced form the deposition on LNZ:
(111) TbFe2 // (110) Mo with a selection for “less-tilted”
planes respect to the sample surface (close-to-the-normal poles)
TbFe < 110 > // Mo < 110 > TbFe < 112 > // Mo < 001 > in the planes of coincidence.
The calculated poles (black and red squares and triangles in figure 8 (d) and (f)) are in very good agreement with experimental data for the deposit on LN41Y. Each intensity spot can be clearly identified as a pole associated to the D1 or D2 domain, or to their variant.
For the deposit on LN128Y, the situation is a bit more complex: the six main poles are clearly associated to the D1 and D2 domains (squares), however the possible variants (triangles) only give rise to contributions of much smaller intensity. Moreover, one can notice that other poles of low intensity might correspond to a third domain (D3 in green) with its variant, the one for which a 111 TbFe2 pole is superimposed with the 110 Mo pole located
at χ = 38° (light red arrow).
In conclusion, two TbFe2 domains with variants are
observed on LN41Y, two TbFe2 domains without variants
are strongly dominant on LN128Y, despite the existence of small contributions from a third domain and variants. In both cases, the OR between Mo and TbFe2 lattices are
the same, which was also confirmed by the measurements of 220 TbFe2 pole figures. [20]
These OR between (110) Mo and (111) TbFe2 planes are
sketched in figure 9.
As in the case of (110) Mo on (0001) LN, these OR are the so-called R30-OR, with a 1 TbFe2 : 1 Mo coincidence
between atomic rows perpendicular to Mo 110, and a 1 TbFe2 : 3 Mo coincidence between atomic rows
perpendicular to Mo 001 , with a resulting mismatch of respectively -14.4% and +4.95%. As shown previously, the optimal ratio / for this orientation is 0.5. The experimental ratio in the case of Mo and TbFe2 is
0.52, which easily explains this preferred relative orientation.
The R30-OR is consistent with previous results reported for the (111) TbFe2 growth on (110) Mo on sapphire
substrates. [14] The observation of similar OR for the different LN cuts points out the 3D character of this OR, as between Mo and LN lattices. However, in contrast to the LNZ case where the surface symmetry strongly favors (110) Mo and (111) TbFe2 planes parallel to the surface,
the occurrence of several tilted Mo domains on LN128Y and LN41Y gives rise to several TbFe2 domains and
possibly their associated variants (60° rotated around < 111 > directions). Those are however not fully equivalent, as this can be noticed in the poles figures: on LN41Y, 111 TbFe2 poles are superimposed on the two
110 Mo poles tilted by 21.5° from the normal, leading to 2x2 (variants) domains. No 111 TbFe2 pole is observed
on the 110 Mo pole tilted by 49° from the normal. On LN128Y, 111 TbFe2 poles are superimposed on the two
110 Mo poles tilted by 30° from the normal, leading to 2 domains. The 111 TbFe2 pole superimposed on the 110
Mo pole tilted by 38° from the normal is less intense, as it is the case for the poles associated to variants.
As mentioned for the Mo growth on LN128Y and LN41Y, this non-equivalence of domains most likely originates from surface energy considerations. The (111) TbFe2 planes with a low surface free energy are all the
more favored that they lie close to the surface plane.
5. Magnetic properties of TbFe
2films on LN/Mo
templates
Magnetic hysteresis loops have been measured at room temperature, using SQUID-VSM (Quantum Design) and VSM (ADE technologies) instruments, with magnetic fields applied in the plane (IP) and out of the plane (OOP) of the TbFe2 layers deposited on the various LN cuts. No
demagnetizing field corrections were performed for OOP loops in order to show the magnetic field actually required to magnetically saturate the film. The diamagnetic contributions from the sample holder and substrate have been subtracted.
Figure 10 presents the comparison between IP (H // LN [1120] + 90° in red) and OOP loops (in green) in (a), (c) and (e), as well as IP measurements along several in-plane directions ((b), (d) and (f)). Let’s underline that the IP LN [1120] + 90° direction corresponds to an IP high symmetry crystal axis for TbFe2 ([110]) on LNZ/Mo,
while it is not the case on the two other LN cuts.
The comparison of IP and OOP measurements ((a), (c) and (e)) shows first that the TbFe2 film deposited on
LNZ/Mo exhibits a tendency to perpendicular magnetization (larger remanent magnetization, less rounded shape of the hysteresis loop), while the TbFe2
a favoured in-plane magnetization. This is obvious on LN41Y/Mo where the IP loop measured for the magnetic field applied along LN X+90° is square with a sharp magnetization reversal.
This difference in magnetic anisotropy between the different LN cuts, especially the occurrence of OOP easy axis on LNZ, is likely related to the influence of magnetoelastic contributions. In a [111] grown TbFe2
film (negative b2 magnetoelastic constant), a
perpendicular tensile strain namely favours an OOP magnetization, while a perpendicular compressive strain favours an IP magnetization. Large X-ray experiments have confirmed a tensile strain of approximately +0.16%, likely arising from the different thermal expansion coefficients of the deposited layers and the LN substrate, as it has been previously reported in other systems. [12,13,20]
Such a magnetoelastic contribution has been evidenced for various REFe2 and REAl2 films deposited on
substrates with either smaller or larger thermal expansion coefficients, thus leading to either compressive or tensile perpendicular strains than can favor IP or OOP magnetic anisotropy depending on the sign of magnetoelastic constants. [13,16,27,28] In the current case, the crystal
field anisotropy favours <111> directions and may thus also contribute to the OOP anisotropy, despite the counter effect of magnetostatic contributions that always favor IP magnetization. [11]
For LN128Y and LN41Y substrates, the presence of several TbFe2 crystal orientations doesn’t enable such a
simple approach and also most likely leads to strain relaxation. Magnetostatic contributions should dominate and drive IP magnetization.
The comparison of hysteresis loops with the field applied along different IP directions (figure 10 (b, d and f)) shows that the IP magnetic behaviour is isotropic on LNZ/Mo and anisotropic with an easy magnetization direction along LN X + 90° on LN128Y/Mo and LN41Y/Mo. In the case of the [111] growth direction (on LNZ), the presence of two variants leads to six <111> directions tilted by 20° from the sample plane and rotated by 60° from each other in azimuthal angle. The angle between any in-plane direction and an out-of-plane <111> direction is therefore in the [20°-35°] range (20° for <112> directions and 35° for <110> directions). Given the structural dispersion, this difference is obviously not large enough to induce an in-plane magnetic anisotropy. On the two other cuts, the in-plane anisotropic behavior
is not easily understood from the complex TbFe2
orientation. If induced strains, and thus magnetoelastic contributions, related to the growth process might not be relevant in this case, one could try to link the observed anisotropy to the magnetocrystalline and shape contributions. The shape anisotropy favors an in-plane magnetization but not a specific in-plane axis, except for a specific microstructure that was not explored in the current study. As stated above, the magnetocrystalline anisotropy should favor <111> directions. From the measured poles figures and associated stereographic projections (figure 8), the different TbFe2 domains lead to
several in-plane and close-to-the plane <111> directions that should thus be favored by the combination of shape and magnetocrystalline anisotropy. For TbFe2 on
LN128Y, the favored domains (black and red squares) give rise to <111> directions tilted by 9° out-of-plane from LNX+48° and by 28° from LNX+60°. For TbFe2 on
LN41Y, the observed domains give rise to IP <111> directions along LNX+8° and LNX+49°. In consequence, these are obviously not responsible for the observed in-plane easy axis along LNX+90°, which remains up to now unexplained. Further investigation are required to analyze the domain morphology and films microstructure, and explore their possible influence.
Beyond the magnetic anisotropy, one can underline that the saturation magnetization for TbFe2 on LNZ/Mo is
significantly smaller than the value expected from the bulk (800 kA.m-1). This can be a sign of limited quality
and could be attributed to different factors: chemical contamination by neighbor elements and/or elements diffusing from the substrate, oxidation… [20] The saturation magnetization values however reach approximately 700 kA.m-1 on LN128Y/Mo and 800
kA.m-1 on LN41Y/Mo. This could indicate that these later
specific LN cuts are more stable upon heating and that the high temperature chemical interaction with the TbFe2
layer is reduced compared to the case of deposition on LNZ.
For the three LN cuts, the coercive field is close to 0.6 T, in agreement with the values reported by Huth et al. on LNZ and on Al2O3. [14-16]
6. Conclusion
The crystalline growth of TbFe2 on unconventional and
challenging substrates has been successfully achieved using a single Mo buffer layer. Common orientation relationships were found between Mo and LN lattices, as well as between TbFe2 and Mo lattices, whatever the
substrate, i.e. for the three different LN surface orientations.
(111) TbFe2 // (110) Mo // (0001) LN
with R30-OR in these parallel planes:
TbFe < 110 > // Mo < 110 > // LN < 1120 >
TbFe < 112 > // Mo < 001 > // LN < 1100 >
Despite common 3D-OR between various lattices, the surface free energy associated to different crystalline planes appears to play an important role since this will select specific domains among those that are equivalent from the OR point of view. A single domain with its associated variant is stabilized on LNZ where the substrate’s surface and OR drive low energy (110) Mo and (111) TbFe2 growth planes; Two or three domains
with their associated variants develop on LN41Y and LN128Y where the substrate’s orientation leads to Mo domains with significantly tilted <110> directions. The quality of the TbFe2 crystal order is by the way reduced
on LN128 and 41Y-cuts, as revealed by the spatial extension of the diffracted intensity in pole figures. Concerning the magnetic behavior, the TbFe2 deposited
on LN41Y exhibits the highest saturation magnetization, close to bulk value, while it is significantly smaller for the film on LNZ, most likely due to diffusion of Lithium from the substrate at high temperatures under UHV. Further investigations would require detailed chemical and surface analysis. Moreover, the easy magnetization axis lies out of the plane for LNZ/Mo/TbFe2, in agreement
with the role of magnetoelastic contributions, and in the plane for the films grown on 128Y and 41Y-cuts. The observed IP anisotropic behavior in these later cases remains up to now unexplained.
The successful growth of crystalline TbFe2, as a single
domain or as a limited number of domains, on LN substrates with piezoelectric properties is a very promising step towards the development of hybrid multiferroic systems. Surface Acoustic Wave devices where the SAW is generated at the LN surface by piezoelectric effect and travels through a strongly magnetostrictive crystalline TbFe2 delay line are
currently under investigation. These will be tested as magnetic sensors as well as acoustic excitation sources to drive the magnetization dynamics.
Acknowledgements
Experiments were carried out on IJL Project TUBE-Davm equipments funded by FEDER (EU), French PIA project “Lorraine Université d’Excellence” (ANR-15-IDEX-04-LUE), Region Grand Est, Metropole Grand Nancy and ICEEL.
[1] Kim J W, Vomir M, Bigot J Y 2012 Phys. Rev. Lett. 109 166601 [2] Biswas A K, Bandyopadhyay S, Atulasimha J 2014 Appl. Phys. Lett. 105 072408
[3] Kadota M, Ito S, Ito Y, Hada T, Okaguchi K 2011 Jap. J. of Appl. Phys. 50 07HD07
[4] Webb D C, Forester D W, Gangu1y A K, Vittoria C 1979 IEEE. Trans. Magn. 15
[5] Weiler M, Dreher L, Heeg C, Huebl H, Gross R, Brandt M S, Goennenwein S T B 2011 Phys. Rev. Lett. 106 117601
[6] Thevenard L, Camara I S, Majrab S, Bernard M, Rovillain P, Lemaitre A, Gourdon C, Duquesne J Y 2016 Phys. Rev. B. 93 134430 [7] Edrington W, Singh U, Dominguez M Y, Rehwaldt Alexander J, Nepal R, Adenwalla S 2018 Appl. Phys. Lett. 112 052402
[8] Atulasimha J, Bandyopadhyay S 2010 Appl. Phys. Lett. 97 173105
[9] Pertsev N A, Kohlstedt H, Dkhil B 2009 Phys. Rev. B. 80 054102 [10] Ryu J, Priya S, Uchino K, Kim H E 2002 J. Electroceram. 8 107-119
[11] Clark A E 1980 Handbook on the physics and chemistry of rare earths North Holland Publishing Company
[12] Mougin A, Dufour C, Dumesnil K, Mangin P 2000 Phys. Rev. B. 62 14
[13] Wang C T, Clemens B M, White R L 1996 IEEE. Trans. Magn. 32 4752
[14] Huth M, Flynn C P 1998 Phys. Rev. B. 58 17 [15] Huth M, Flynn C P 1998 J. Appl. Phys. 83 7261
[16] Huth M, Flynn C P 1999 J. Mag. and Magn. Mat. 204 204-208 [17] Yamaguchi M, Hashimoto K Y, Kogo H, Naoe M 1980 IEEE. Trans. Magn. 16
[18] Zhou H, Talbi A, Tiercelin N, Bou Matar O 2014 Appl. Phys. Lett. 104 114101
[19] Polewczyk V, Dumesnil K, Lacour D, Moutaouekkil M, Mjahed H, Tiercelin N, Petit Watelot S, Dusch Y, Hage-Ali S, Elmazria O, Montaigne F, Talbi A, Bou Matar O, Hehn M 2017 Phys. Rev. App. 8 024001
[20] Polewczyk V 2018 PhD dissertation Université de Lorraine [21] Milne R H 1982 Surface Science. 122 474-490
[22] Hottier F, Theeten J B 1977, Surface Science. 65 563-577 [23] Kwo J, Hong M, Nakahara S 1986 Appl. Phys. Lett. 49 319 [24] Hellwig O, Theis-Briihl K, Wilhelmi G, Stierle A, Zabel H 1998 Surface Science. 398 379-385
[25] Homma H, Yang K Y, Schuller I K 1987 Phys. Rev. B. 36 18 [26] Paik S M, Schuller I K 1990 Phys. Rev. Lett. 64 16
[27] Oderno V, Dufour C, Dumesnil K, Mangin P, Marchal G 1996 Journal of Crystal Growth. 165 175-178
[28] Avisou A, Dufour C, Dumesnil K 2008 J. Appl. Phys. 103 07E135

![Figure 10 presents the comparison between IP (H // LN [1120] + 90° in red) and OOP loops (in green) in (a), (c) and (e), as well as IP measurements along several in-plane directions ((b), (d) and (f))](https://thumb-eu.123doks.com/thumbv2/123doknet/14437602.516321/10.892.124.375.605.825/figure-presents-comparison-loops-green-measurements-plane-directions.webp)
