Computer-Aided Rational Solvent Selection for
Pharmaceutical Crystallization
by
Jie Chen
B.S. Chemical Engineering, Tsinghua University, 2004
M.S.CEP, Massachusetts Institute of Technology, 2008
Submitted to the Department of Chemical Engineering
in partial fulfillment of the requirements for the degree of
DOCTOR OF PHILOSOPHY IN CHEMICAL ENGINEERING
at the
MASSACHUSETTS INSTITUTE OF TECHNOLOGY
May 2010
@
Massachusetts Institute of Technology 2010. All rights reserved.
A uthor...
Department of Chemical Engineering
May 3, 2010
Certified by ...
...
Bernhardt L. Trout
Professor of Chemical Engineering
Thesis Supervisor
Accepted by ...
MASSACHUSETTS INS~fTE OF TECHNOLOGYJUN 3 0 2010
LIBRARIES
William M. Deen
Professor of Chemical Engineering
Chairman, Committee for Graduate Students
AmmCVFs
Computer-Aided Rational Solvent Selection for Pharmaceutical
Crystallization
by
Jie Chen
Submitted to the Department of Chemical Engineering on May 3, 2010, in partial fulfillment of the
requirements for the degree of
DOCTOR OF PHILOSOPHY IN CHEMICAL ENGINEERING
Abstract
Solvents play an important role in crystallization, a commonly used separation and purifica-tion technique in the pharmaceutical, chemical and food industries. They affect crystal prop-erties such as particle size distribution, morphology, polymorphism etc. and therefore have consequences for the downstream processing of the solid material. Current solvent selection techniques for solution crystallization remain ad hoc and typically do not have a theoretical underpinning. Elucidation of the interactions between solvent and solute molecules and the mechanism underlying the solvent effects on each aspect of the crystal properties would be a major aid for the rational selection of solvents and also the development of crystallization processes. In this work we studied the effect of solvent on the polymorphism and morphology of organic crystals using molecular modeling techniques.
The two most important contributions of this thesis are listed below.
1. We studied the self-assembly of solute molecules in solutions prior to nucleation for two
polymorphic systems, tetrolic acid and glycine, using molecular dynamics simulations. We tested the existence of a link between the structure of the clusters formed in solution and the polymorphism of the crystals. Our results show that the link hypothesis succeeds in explaining the polymorph selection of tetrolic acid from different solvents. However it fails for glycine and thus should be used with caution.
2. We designed a computer-aided rational solvent selection procedure for improving the morphology of needle-like 2,6-dihydroxybenzoic acid form 2 crystal. We also exper-imentally grew 2,6-dihydroxybenzoic acid form 2 crystals using the solvent mixture suggested by computer simulations, which do exhibit reduced aspect ratios. This computer-aided selection procedure can not only quickly identify an effective solvent or solvent mixture, but also provide mechanistic understandings of the underlying chem-istry. It can also be extended to improve the morphology of other needle-like organic crystals easily.
Thesis Supervisor: Bernhardt L. Trout Title: Professor of Chemical Engineering
Dedication
Acknowledgements
I would first of all like to thank Professor Bernhardt L. Trout for his constant support and
help during the course of this thesis. He has always been very accessible and has given me immense freedom to pick and choose my projects. His insights into molecular simulations and pharmaceutical processing always provided me an overall guidance when I was lost. Our brain storming session gave me many new ideas when I was stuck. I truly appreciate having him as my advisor.
I would also like to thank my committee members, Professor Arup Chakraborty, Professor Michael J. J. Cima, Professor Collin M. M. Stultz. Their enthusiastic involvement and helpful discussions through out the course of the project helped me immensely. I am grateful to Professor Allan S. Myerson from Illinois Institute Technology for many helpful discussions about the glycine project. His experiences and insights into nucleation and crystallization problems inspired me with many interesting ideas.
There have been many present and former group members who have helped me get started with the project and then helped me at various times along the way. I would like to thank the former Trout group members Dr. Ning Shan and Dr. Gregg T. Beckham for helping me start with the molecular simulations and helping me define my project. I would like to thank the current Trout group members Dr. Keith Chadwick and Ying Diao for helping with the crystallization experiments. I would also like to thank the rest of Trout group members for their helpful inputs at the group meetings and their company both at and outside work. Last but not the least I would like to thank Gwen Wilcox, Angelique Scarpa, and Stephanie Bright for making life easier at MIT.
Finally I would like to thank all my friends who have made my time at MIT fun and memorable. I want to especially thank Sandeep for his constant support during my study at MIT and generally in life.
Contents
1 Introduction
1.1 B ackground . . . .
1.2 Motivation and Outline of Thesis . . . .
2 Basics of Molecular Modeling
2.1 Introduction . . . . 2.2 Two Types of Molecular Modeling . . . .
2.2.1 Quantum Mechanics Approach 2.2.2 Force Field Approach . . . .
2.3 Techniques in Molecular Modeling . . . . 2.3.1 Energy Evaluation . . . .
2.3.2 Energy Minimization . . . .
2.3.3 Molecular Dynamics Simulations 2.3.4 Monte Carlo Simulation. . ..
3 Computational Study of the Self-Assembly of Solute Molecules in Solution and Its Implications for the Polymorphic Outcome of Solution
Crystalliza-tion 31
3.1 Introduction . . . . 31
3.2 Solvent Effect and the Link Hypothesis . . . . 33
3.3 O bjectives . . . . 37 3.4 Tetrolic A cid . . . . 38 23 . . . . 2 3 . . . . 2 4 . . . . 2 4 . . . . 2 5 . . . . 2 8 . . . . 2 8 . . . . 2 8 . . . . 2 9 .. . . . . . . . 30
3.4.1 Polymorphism of Tetrolic Acid . . . . 3.4.2 Computational Details . . . . 3.4.2.1 Force Field Validation . . . . 3.4.2.2 Solvation Free Energy Calculation . . . . 3.4.2.3 Free Energy Change of the Dimerization Reaction . . . . . 3.4.2.4 Radial Distribution Function Calculations . . . . 3.4.2.5 Dimer Fraction of the Hydrogen Bond Network . . . . 3.4.3 Results and Discussions . . . .
3.4.3.1 The Interplay between Tetrolic Acid and Solvent Molecules 3.4.3.2 Dimerization Reaction . . . . 3.4.3.3 Dimer Fraction of Hydrogen Bond Network . . . . 3.4.4 Conclusions of the Self-Assembly Study of Tetrolic Acid . . . .
3.5 G lycine . . . .
3.5.1 Polymorphism of Glycine . . . .
3.5.2 The Link Hypothesis for Glycine and the Controversy . . .
3.5.3 O bjectives . . . . 3.5.4 Force Field Development . . . .
3.5.5 Glycine Clusters in Solution . . . .
3.5.6 Glycine Clusters near the a Glycine Crystal Surface (010)
3.5.7 Conclusions of the Self-Assembly Study of Glycine . . . . .
3.5.8 Other Solvent Mediated Polymorph Selection Mechanisms
3.5.8.1 Methanol Inhibition on the (0±10) Faces of a and 3 Glycine 81
3.6 Conclusions . . . . 87
4 Computer-Aided Rational Selection of Solvents for Improving the Mor-phology of Needle-like Crystals 89 4.1 Introduction . . . . 89
4.2 Solvent Effect and Model System . . . . 90
4.3 Morphology Predictions . . . . 91 . . . . 64 . . . . 64 . . . . 64 . . . . 66 . . . . 67 . . . . 73 . . . . 78 . . . . 80 . . . . 81
4.4 Force Field and Computational Details . . . . 4.5 Results and Discussion . . . . 4.5.1 Single Solvents . . . . 4.5.2 Solvent Systems of the desired functional groups . . . .
4.6 Experimental Validation . . . . 4.7 Conclusions . . . . . . . . 96 . . . 102 . . . 102 . . . 109 . . . 112 . . . 117
5 Conclusions and Future Work
5.1 Molecular Modeling in Understanding Crystal Polymorphism . . . .
5.2 Molecular Modeling in Understanding Crystal Morphology . . . .
5.3 Molecular Modeling in Other Areas of Crystallization . . . .
Appendix:
A Crystal-Solvent Interaction Energy Calculations for DHB
B Reaction between 2,6-Dihydroxybenzoic Acid and Acetone
C Solubility of DHB form 2 D PXRD Patterns of DHB Crystals 119 119 120 121 123 125 127 129
List of Figures
2-1 Bonded contributions in the force field approach. . . . . 26
2-2 A flowchart of developing the force field parameters for a novel molecule. . . 27
3-1 Polymorphs of ROY. . . . . 32 3-2 The kinetics of a dimorphic phase transformation. . . . . 34
3-3 The link hypothesis for tetrolic acid. . . . . 36
3-4 Percentage changes of the the lattice parameters (PCLPs) and RMSDs of TTA crystal supercells in 2 ns MD simulations at 20 K and 1 atm. . . . . 42
3-5 Dimerization reaction of tetrolic acid. . . . . 45
3-6 Definition of the order parameter (OP) used in the umbrella sampling of the
dimerization reaction of tetrolic acid. . . . . 45
3-7 Definition of the radial distribution function between atom 1 and atom 2. . . 46
3-8 Atom labels in the RDF calculations of tetrolic acid. . . . . 47
3-9 Illustration for dimer fraction calculation . . . . 49
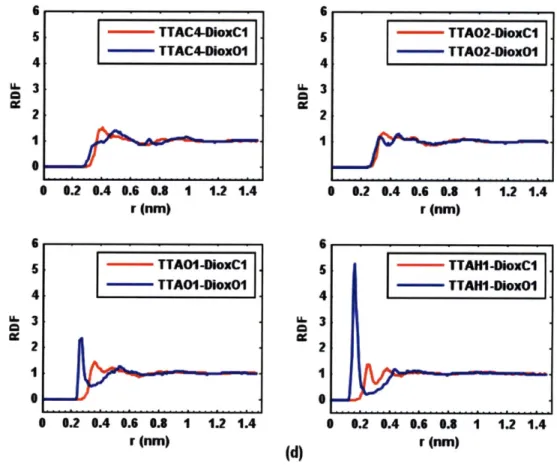
3-10 RDFs of the distances between the atoms in TTA and the atoms in various
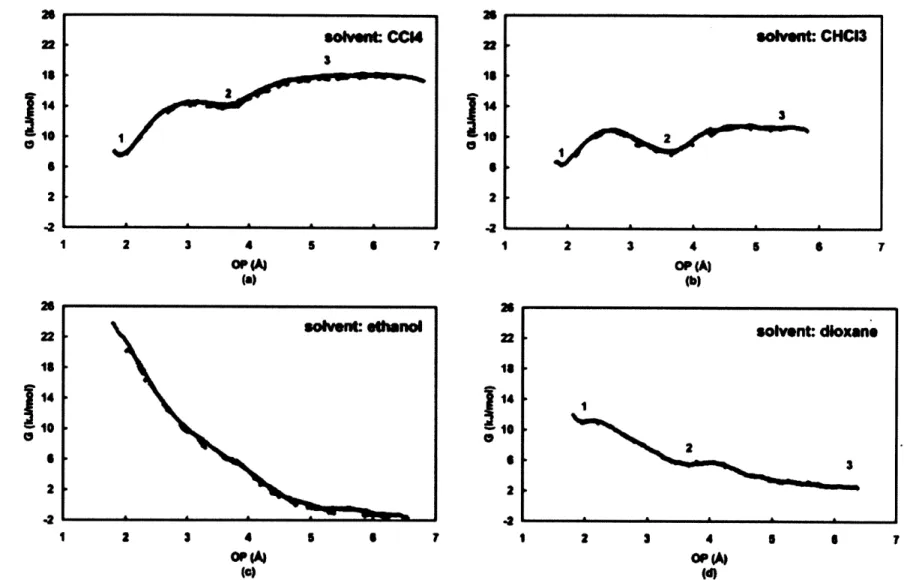
solvents at 298 K and 1 atm. . . . . 55 3-11 Free energy profiles for the TTA dimerization reation in various solvents at
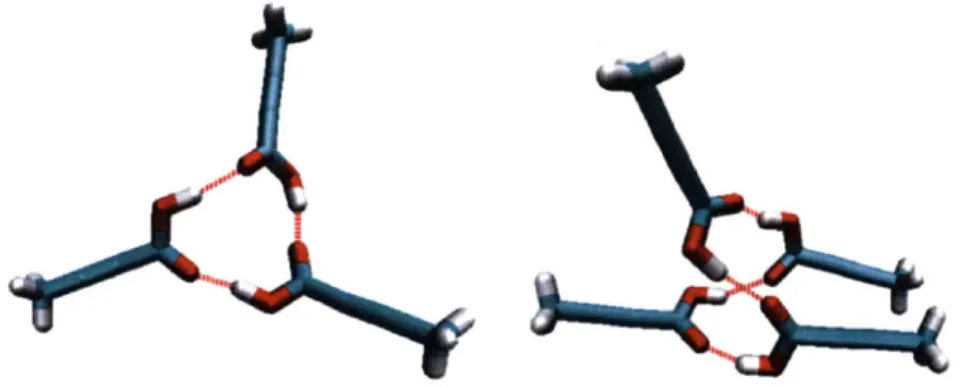
298 K and 1 atm obtained using the MD umbrella sampling. . . . . 59 3-12 TTA clusters in various solutions. . . . . 61 3-13 The clusters reducing TTA's potential to form carboxylic acid dimer. . . . . 62
3-14 Crystal structures of a,
#
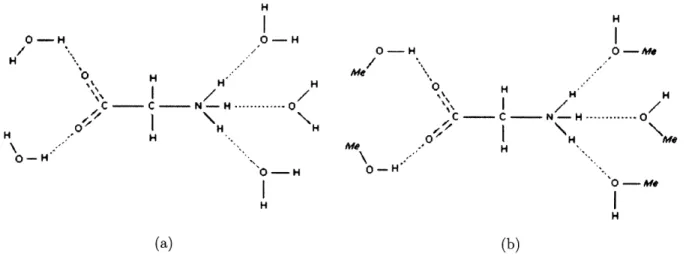
and -y glycine, viewed along the a-axis, a-axis and b-axis respectively. . . . . 643-15 The link hypothesis for the polymorphic system of glycine. . . . . 66 3-16 Schematic demonstration of the calculations of the interaction energies
be-tween the hydrogen bonding sites of glycine and water/methanol. . . . . 69 3-17 Cyclic dimer fraction of glycine hydrogen bond networks in solutions at 298
K and 1 atm . . . . 75 3-18 The number of hydrogen bonds per glycine molecule in various solutions at
298 K and 1 atm . . . . 75 3-19 Free energy profiles for the glycine dimerization reaction in water and
methanol-water 3:7 mixtures at 298 K and 1 atm obtained using the MD umbrella
sam pling m ethod. . . . . 77
3-20 Simulation box of the 3.8 mol/L glycine aqueous solution contacting with a
glycine (010) face, viewed along the a-axis of the crystal. . . . . 79 3-21 Cyclic dimer fractions of the glycine hydrogen bond networks in various
solu-tions at 298 K and 1 atm contacting with the (010) face of a glycine, plotted together with the results without the crystal surface. . . . . 80 3-22 The (010) face and (0-10) face of a and
#
glycine from Weissbuchs previousw ork . . . . 82 3-23 Simulation boxes of the (010) and (0-10) faces of a (left) and 13 glycine (right)
contacting with water... . . . . . . . . 83
3-24 Solvent-crystal interaction energies on face (010) and face (0-10) of both a and
3
glycine for water and methanol-water mixtures calculated using MD simulation at 298 K and 1 atm. . . . . 85 3-25 A snapshot of the/
glycine (010) face interacting with methanol-watermix-ture, viewed along the c axis of 13 glycine . . . . 86
4-1 Morphology of DHB form 2, predicted using BFDH model from MERCURY. 91
4-2 Demonstration of Wulff construction. . . . . 92
4-3 Schematic demonstration of the BFDH model. . . . . 92
4-5 Kinetic based growth models. . . . . 95
4-6 A simplified scheme to calculate the aspect ratio of needle-like crystals. . . . 96
4-7 Percentage changes of the lattice parameters and the density of the DHB crystals in MD simulations at 20 K and 1 atm using different partial charges. 98 4-8 Demonstration of the calculation of vacuum attachment energy. . . . 100
4-9 Demonstration of the calculation of crystal-solvent interaction energy. . . . . 101
4-10 Snapshots of the crystal-solvent interfaces near DHB form 2 crystal face (00±1). 106 4-11 Snapshots of the crystal-solvent interfaces near DHB form 2 crystal face (110) and face (200). . . . 107
4-12 Structure of anisole . . . 109
4-13 DHB form 2 crystals aged in different solvents. . . . 115
4-14 PXRD pattern of DHB crystals. . . . 116
4-15 A flowchart of the computer-aided solvent selection procedure for improving the morphology of needle-like crystals. . . . 118
B-1 Reaction between 2,6-dihydroxybenzoic acid and acetone. . . . 125
D-1 PXRD patterns of DHB crystals aged in toluene, diethyl ether, anisole, chlo-roform , and ethanol. . . . 130
List of Tables
3.1 Crystallographic information of tetrolic acid. . . . . 39 3.2 Physical and chemical properties of carbon tetrachloride, chloroform, ethanol,
and dioxane. . . . . 43
3.3 System details of the MD simulations for the solvation free energy calculations
of tetrolic acid. . . . . 44
3.4 System details of the MD simulations for the RDF calculations. . . . . 47
3.5 System details of the MD simulations in the study of dimer composition of the hydrogen bond network of tetrolic acid . . . . 49
3.6 Calculated solvation free energies of TTA in ethanol, chloroform, carbon tetra-chloride, and dioxane at 298 K and 1 atm. . . . . 50 3.7 Free energy differences between the three states on the dimerization pathway
and their relative population. . . . . 58 3.8 Refcodes and cell parameters of glycine crystals. . . . . 65 3.9 The percentage change of lattice parameters (PCLPs), the root mean squared
difference (RMSD) and the relative energies of the three polymorphs of glycine modeled using three different sets of force field parameters. . . . . 70 3.10 Hydrogen bond energies between glycine and water/methanol, calculated
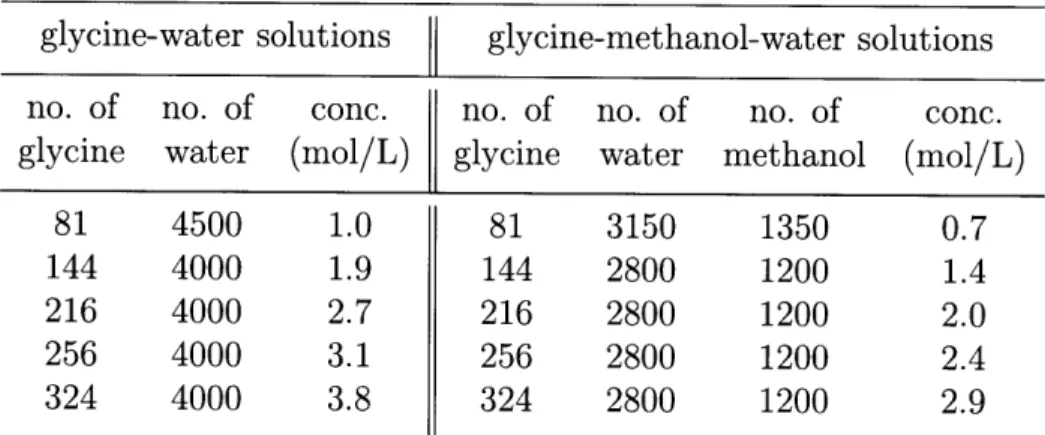
us-ing both the ab initio method and the empirical force field method. . . . . . 72 3.11 The number of molecules in the simulation boxes for the study of glycine
3.12 Details of the simulation boxes of the (010) and (0-10) faces of a and 3 glycine
contacting with water or methanol/water mixture. . . . . 84
4.1 Percentage changes of lattice parameters of the equilibrium DHB crystal structures compared to the experimental X-ray structures, calculated using
CHELPG charges derived from ab initio DFT calculations. . . . . 97
4.2 System details of vacuum attachment energy calculation. . . . . 99
4.3 Modified attachment energies and predicted aspect ratios of DHB from single solvents. . . . 108 4.4 Modified attachment energies and predicted aspect ratios of DHB from solvent
systems with desired functional groups. . . . 111
A. 1 System details of crystal-solvent interaction energy calculations for DHB. . . 124
Chapter 1
Introduction
1.1
Background
Crystallization from solution is a commonly used separation and purification process in a wide variety of industries, e.g. pharmaceutical, chemical, and food. Crystallization may be defined as a phase change in which a crystalline product is obtained from a solution. It is induced by changing the state of the system in some way that reduces the solubility of the crystallizing species. A crystallization event involves four steps: creation of supersaturation, induction, nucleation, and crystal growth. Supersaturation refers to a solution containing more dissolved material than could be dissolved by the solvent under normal/equilibrium conditions. It can be created by reducing the temperature, increasing the pressure, adding anti-solvents, etc. Crystals do not appear right way after the creation of supersaturation. Supersaturated solutions can be stable for minutes, hours and sometimes even days depend-ing on the system. This period of time is called the induction time. Nucleation is the commencement of a new phase. Classical nucleation theory says that thermal fluctuations give rise to the appearance of small nuclei of a second phase and occasionally produce a long chain of favorable energetic fluctuations, thereby creating a nucleus exceeding the critical size.1 Although this second phase has favorable lower free energy than the initial phase, there is a free energy penalty associated with the creation of an interface. The free energy, AG,
of the second phase is therefore the sum of a negative volume term and a positive surface term. For a spherical nucleus, AG is defined by equation 1.1:
4
AG = -rR 3AGv + 47rR (1.1)
3
where R is the radius of the nucleus, AGv is the bulk free energy difference per unit volume between the first and second phases, and -y is the surface free energy of the second phase per unit area. A critical nucleus usually consists of hundreds of atoms and a few nano meters in size, which cannot be detected by either human eyes or any advanced spectroscopic tech-nology currently available. After nucleation, the nuclei continue to grow until the solution reaches its solubility equilibrium again. This is known as the crystal growth step.
In addition to product purity, it is often necessary to control the external shape and size of the crystals and to produce the desired polymorph and/or optical isomer. Solvent is an important process parameter in solution crystallization. 2-5 It affects the solubility, yield,
particle size distribution, morphology and polymorphism of the crystal product, all of which have consequences for the down-stream processing of the solid material.' Solvent screening is a standard procedure in the pharmaceutical industry in searching for all the potential polymorphic forms in the early stage of drug development. Solvent/additive effects on crys-tal morphology have also been extensively studied and reported in literature.7,8 However,
current solvent selection for solution crystallization still adopts a trial and error approach.
A typical selection process may involve starting with a list of solvent candidates, performing
crystallization experiments, studying the crystal properties and then revising the solvent list based on the experimental results. This cycle will be repeated until the right solvent giving the desired crystal properties is found. This process is expensive and time consuming, espe-cially when solvent mixtures are introduced. Elucidating of the interactions between solvent and solute molecules, understanding the mechanism underlying the solvent effects on each aspect of the crystal properties and moreover developing a model to predict them before carrying out crystallization experiments would be a major aid for the rational selection of solvents and also in the development of crystallization processes.
Molecular modeling is the term used to describe the techniques that employ quantum mechanics and statistical mechanics in conjunction with computer simulations to study the chemical and physical properties of materials. In recent years, molecular modeling has emerged as a useful tool in the solution of a number of crystallization problems.9,'10 In
particular, modeling allows more focused experimentation based on structural and energetic calculations rather than intuition and trial and error.
1.2
Motivation and Outline of Thesis
The overall goal of this thesis is to apply molecular modeling techniques to gain mechanistic understandings of how solvents affect the properties of the crystals obtained from solution crystallization and to further aid in the rational design of crystallization processes.
We focused on solvent effects on the polymorphism and morphology of organic crystals. In Chapter 2, we shall overview some of the basics in molecular modeling. In Chapter
3, we discuss the self-assembly of solute molecules in solution prior to nucleation for two
polymorphic systems, tetrolic acid and glycine. Using molecular simulation techniques, we tested the existence of a link between the structure of the solute clusters formed in solution and that of the polymorphic form of the crystals. Our results will show that the link hypothesis succeeded in explaining the polymorph selection of tetrolic acid from different solvents, but failed for glycine. Thus the link hypothesis should be used with caution in explaining the polymorph selection by solvents. In Chapter 4, we shall describe a computer-aided rational solvent selection procedure designed for improving the morphology of needle-like 2,6-dihydroxybenzoic acid form 2 crystals and also show that crystals grown from the solvent mixture suggested from the computer simulations do exhibit reduced aspect ratios. This computer-aided selection procedure can not only quickly identify an effective solvent or solvent mixture but can, as will be demonstrated, provide mechanistic understandings of the underlying chemistry. A solvent selection framework that can be applied to improve the morphology of other needle-like organic crystals will be outlined. In Chapter 5, we will present some of the salient conclusions of the thesis and possible future directions that the
Chapter 2
Basics of Molecular Modeling
2.1
Introduction
In recent years molecular modeling methods based on computer simulations have become a useful tool in solving various scientific and engineering problems. Moreover, with the development of powerful supercomputers and advanced algorithms, the impact of molecular modeling has increased tremendously in the past few years and is expected to increase even more so in the future. Molecular modeling provides a bridge between the microscopic details of a system (the motion of atoms, the interactions between molecules, the coordination numbers, etc.) and the macroscopic properties of experimental interest (the equation of state, transport coefficients, structural order parameters and so on). Information under extremes of temperature and pressure, which may be difficult or impossible to gather experimentally, can be studied using computer modeling. Quite subtle details of molecular motion and structure in heterogeneous catalysis, fast ion conduction or enzyme action are difficult to probe experimentally but can be extracted readily from computer modeling. To some extent, computer-based modeling methods have filled the long existing gap between experiment and theory.
2.2
Two Types of Molecular Modeling
The forces of interaction between particles can be classified into four major categories: grav-itational, strong nuclear, weak nuclear and electromagnetic. " The gravitational force is extremely long range and usually does not contribute to the intermolecular interaction. The strong nuclear forces and the weak nuclear forces are significant over the range 10- nm. Since molecular dimensions are typically of the order of 5 x 10⁻¹ nm, these nuclear forces cannot contribute to the intermolecular forces. Consequently, intermolecular forces must be of electromagnetic origin.
Before performing molecular modeling we need a mathematical model to describe the intra and intermolecular interactions. There are mainly two types of models reported in the literature, the quantum mechanic and force field approaches.
2.2.1
Quantum Mechanics Approach
Quantum mechanics (QM) is a set of scientific principles describing the wave-particle du-ality of energy and matter at the atomic scale. In quantum mechanics, the properties of the particle can be described as the properties of a wave. Its quantum state can be repre-sented as a wave of arbitrary shape and extending over space as a wave function. Therefore there is no clear definition of atoms and bonds. QM is widely used to study chemical re-actions and to calculate interaction energies between molecules with high accuracy. The Schr6dinger equation is the fundamental equation of quantum mechanics. Its solutions are called wave functions, which give a complete description of any system. In principle it is pos-sible to describe all chemical systems using quantum theory. In practice, only the simplest chemical systems may realistically be investigated in purely quantum mechanical terms and approximations must be made for most practical purposes (e.g., Hartree-Fock, MP2, density functional theory etc.). Quantum calculations are usually computationally expensive and thus are mostly applied to small systems. In crystallization research QM has been mainly used in three areas:
1. Calculating the solvation free energy of a molecule which is further utilized to estimate
its solubility. 12
2. Predicting/optimizing the structure of a molecule in the gas phase which serves as the input for crystal structure prediction. 13
3. Developing a force field for a novel molecule. The concept of a force field will be
discussed next.
2.2.2
Force Field Approach
A force field refers to the functional form and parameter sets used to describe the potential
energy of a system of particles. Force field functions and parameter sets are derived from both experimental work and high-level quantum mechanical calculations. The basic functional form of a force field consists of both bonded terms relating to atoms linked by covalent bonds and nonbonded terms describing the long range electrostatic and van der Waals forces. The specific decomposition of the terms depends on the force field but a general form for the total energy in an additive force field can be written as
Etotai = Ebond + Eangle + Edihedral + Eeiectrostatic + EvanderWaals (2.1)
The first three terms belong to the bonded contributions which correspond to the bond stretching, angle bending and the torsion of a dihedral angle (shown in Figure 2-1). The other two terms belong to the nonbonded contributions, the electrostatic and van der Waals forces.
The bond and angle terms are usually modeled as harmonic oscillators in force fields that do not allow bond breaking. The functional form for the dihedral term is highly variable. As an example, the forms of all these three terms can be described by
Ebond = Kr (r - req)2 (2.2)
bonds
Eangle =
E
Ko(9 - Oeq)2 (2.3)angles
Edihedral =
(
Kq(1 + cos np) (2.4)dihedrals
(a) bond streching (b) angle bending (c) dihedral torsion Figure 2-1: Bonded contributions in the force field approach.
The nonbonded terms are the most computationally intensive because they include many more interactions per atom. A popular choice is to limit interactions to pairwise energies. The van der Waals term is usually computed with a Lennard-Jones or Buckingham potential. The electrostatic term is usually computed with Coulombs law. Both can be scaled by a constant factor to account for electronic polarizability and produce better agreement with experimental observations. For example, the functional form for the nonbonded energies in a commonly used force field, OPLS force field," is
Enonbonded -- [q - (2.5)
j i<j I(73 S
Where the first and the second terms correspond to the electrostatic and van der Waals contributions respectively.
All force fields are based on numerous approximations and derived from different types
of experimental data. Therefore they are called empirical. A flowchart of developing the force field parameters for a novel molecule is shown in Figure 2-2. The advantage of using
.-Initial geometries of model compounds
Interaction Parameter Optimization Partial Atomic Charges
VDW Parameters
Internal Parameter Optimization
Bonds
11 Angles
Torsions
IV
H Crystal and solution condensed phase MID simulations
Parameter Optimization Complete
Figure 2-2: A flowchart of developing the force field parameters for a novel molecule.
a force field is that the energy evaluation becomes significantly cheaper computationally than the first principal quantum calculation. Therefore the simulation of bigger systems, e.g. proteins, polymers and crystals, becomes feasible. Moreover, these force fields are developed based on functional groups/residues and can be assembled together easily when studying a new molecule. For example, we do not need to develop the force field parameters from scratch for any new protein we would want to study because most force fields used for protein simulations are developed based on the amino acids. Once we know the sequence of the protein of interest, we can easily assemble the required parameters together.
optimized for specific systems. The OPLS/OPLS-AA force field," developed by Jorgensen
et al. at Yale University, has a very good library of common organic solvents and can also
be used for protein simulations. CHARMM,15 AMBER,16 GROMOS,17 etc. are the force
fields commonly used for macromolecule simulations: proteins, sugars, DNAs and so on.
COMPASS18,19 is a powerful force field that supports atomistic simulations of condensed phase materials. Considering the number of force fields, we will not list all available ones here. Force field development is a very active research area. Obtaining an accurate force field is the prerequisite of any meaningful calculation. Current effort has been placed in developing force fields that can account for the polarizability,2 -22 in which a particle's charge is influenced by the electrostatic interactions with its neighbors.
2.3
Techniques in Molecular Modeling
2.3.1
Energy Evaluation
Once we have the force field necessary to describe the interactions within and between molecules, we can evaluate the energy of the system. It is just a one-step calculation, which can be expressed as the pairwise summation of the interaction energies between the atoms of interest. This type of calculation can be used to evaluate the lattice energy of a crystal once its structure is solved, which can be further used either to rank the thermodynamic stability of newly discovered polymorphs or to check the validity of the force field when the stability ranking is experimentally determined.
2.3.2
Energy Minimization
Energy minimization is usually performed by changing the positions of atoms in the system to find a local/global minimum. It can be mathematically expressed as
Emin = min E ( . (2.6)
where 1 is the position of the ith atom in the system. This type of calculation can be useful in searching for new polymorphic forms, helping to solve crystal structures and removing bad initial contacts for molecular dynamics simulations.
2.3.3
Molecular Dynamics Simulations
Molecular Dynamics simulation is a technique for computing the equilibrium and transport properties of a classical many-body system, where the motion of the constituent particles obeys the laws of classical mechanics. If we consider a system of atoms with Cartesian coordinates, the equation governing the motion becomes
mi = i (2.7)
where mi and
1
are the mass and position of the ith atom and F is the force on that atom. Molecular dynamics simulations are in many respects very similar to real experiments. Firstly, we prepare a sample: we select a model system consisting of N particles and we solve Newton's equations of motion for this system until the properties of the system no longer change with time. After equilibration we perform the actual measurement. In a real experiment, we connect our sample to an instrument and measure the property of interest over a certain time interval. If the measurements are subject to statistical noise then the longer we average the more accurate our measurement becomes. It is exactly the same in molecular dynamics. To measure an observable quantity in a molecular dynamics simulation we must first of all be able to express this observable as a function of the positions and momenta of the particles in the system. For example, the instantaneous interaction energy between two proteins A and B is fully determined by the position of the atoms in these twomolecules:
EA (t) - .f (aAr (t)he .p. . ofAi(t), .th and , (t) atmi-m-e-lA 1 Bj Bn
(2.8)
at time instance t. As the position of atom fluctuates due to thermal motion, the instanta-neous interaction energy also fluctuates. To reduce the statistical error of the measurement just as we do in real experiments, we will take many samples and calculate the average:
K
E
EAB(tk)(EAB) = k=1 K (2.9)
where K is the total number of samples extracted in a molecular dynamics simulation.
2.3.4
Monte Carlo Simulation
Monte Carlo simulation methods are especially useful in studying systems with a large num-ber of correlated degrees of freedom such as fluids, disordered materials, strongly coupled solids and macromolecules. Different from the molecular dynamics method, the Monte Carlo approach relies on statistical mechanics rather than trying to reproduce the dynamics of a system. It uses a large amount random numbers and generates states according to appropri-ate Boltzmann probabilities. Consequently, it can be applied to study those events that are impossible/inefficient to simulate directly using MD simulations due to either the difficulty in setting up a MD system or the extremely long time scale of observing the event of interest. For example, finding a phase transition point, e.g. melting temperature, is much easier using the Monte Carlo approach than molecular dynamics. Details of the Monte Carlo method can be found in many molecular simulation books.2
Chapter 3
Computational Study of the
Self-Assembly of Solute Molecules in
Solution and Its Implications for the
Polymorphic Outcome of Solution
Crystallization
3.1
Introduction
Polymorphism is the ability of a solid material to exist in more than one form or crys-tal structure, whilst retaining the same chemical composition.24 Polymorphism exists as a
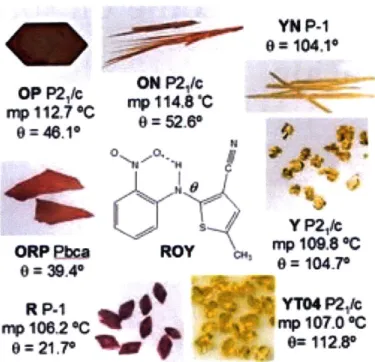
result of the difference in crystal packing or the existence of different conformers of the same molecule, called packing polymorphism and conformational polymorphism respec-tively. The existence of other crystal types as the result of hydration or solvation is called pseudo-polymorphism. Figure 3-1 shows the polymorphs of the molecule 5-Methyl-2-[(2-nitrophenyl)amino]-3-thiophenecarbonitrile, commonly known as ROY. It has ten known polymorphs, seven of them with solved structures. This phenomenon leads to significant
variability in the properties of products in the pharmaceutical, chemical and food industries and continues to pose a challenge to scientists and engineers in producing crystal products of consistent quality. An undesired polymorphic form of the drug product, for instance, can lead to different bioavailability in the target organism, which could render the drug useless, or increase its potency to a dangerous limit.26 One well-known example is the case of antiviral drug Ritonavir.27 29 A more stable polymorphic form discovered after the drug
was commercialized led to the withdraw of the drug product from the market and resulted in tremendous economical loss. In the pharmaceutical industry, a very large number of pharmaceuticals exhibit the phenomenon of polymorphism. 70% of barbiturates, 60% of sulfonamides and 23% of steroids exist in different polymorphic forms. Hence, the accurate control of the polymorphism of drug products is one of the most important considerations in crystallization process design.
YIN P-1
0= 104,10
V5112.7C2
8=46.1*
s Y P21s
ORP Pba ROY Cu mp 109.8 *C
0
=
39.40=
104.7R P-1 YTO4 P2/c
p 107.0 *C 9
=
213e.=11AFigure 3-1: Polymorphs of ROY.
3.2
Solvent Effect and the Link Hypothesis
It is widely know that organic molecules can crystallize into different polymorphic forms from different solvents. Numerous examples have been reported in the literature, including oxalyl dihydrazide,3 L-glutamic acid,3 1 tetrolic acid,3 2 2,6- dihydroxybenzoic acid33 etc. Solvent
screening is a standard procedure in pharmaceutical industry to search for all the potential polymorphic forms in the early stage of drug development. In a recent review paper about solvent effects on polymorphism, Blagden and Davey pointed out three important areas in understanding polymorph selection from solution crystallization within a framework of structural and kinetic parameters:34
1. an understanding of the structural similarities and differences between polymorphs.
2. an appreciation of the interplay between thermodynamic and kinetic factors.
3. a knowledge of the fundamental crystallization growth unit and its relationship to the
structural synthon.
The first point emphasizes the importance of understanding the structural characteristics of different polymorphs, including cell symmetry, subtle changes in the molecular conforma-tions, hydrogen bonding schemes, etc. It is obvious that the first point serves as the basis for all the other studies. In the second point, the interplay between kinetics and thermodynamics is essentially summarized in Ostwald's rule of stages,3 5 which indicates that in a polymorphic
system the crystallization processes may begin with the nucleation of the least stable form and finish with the most stable form. Thus, the primary nucleation stages are interspersed with polymorphic transformations that often involve a growth and dissolution process from a
metastable phase to a more stable phase. The situation for a dimorphic system in which the solution-mediated transformation process is possible is shown schematically in Figure 3-2. Initially, the nucleation and then growth of the metastable form occurs until its solubility is reached. The nucleation of the stable form occurs later and the subsequent growth is driven
by the dissolution of the metastable form. The role of solvent in polymorphic
rate of the metastable form to the more stable form. Kinetic studies were conducted for the crystallization of 2,6-dihydroxybenzoic acid form chloroform and toluene36 rescpectively.
Results showed chloroform facilitates the transformation from the metastable to the stable form more effectively than toluene by accelerating the nucleation rate of the stable form. In the third point, emphasis has been placed on building a link between the growth syn-thons 3
,1 formed through molecular self-assembly in the solution and the structural synthons
packed in the crystal. There is a notion of a crystal as a supramolecular entity created from building blocks, also known as structural synthons.38 Structural synthons can be a single molecule or an intermolecularly bonded group of molecules. The link hypothesis says that the most stable growth synthon formed by self-assembly of solute molecules in solutions has the highest probability to crystallize out as the structural synthon in the solid form, with the mediation of solvents. Obviously, this hypothesis is trying to explain polymorph formation from a thermodynamic point of view, whilst kinetic factors like supersaturation, the rate of creating supersaturation, nucleation, etc. are put aside.
Meta stable
C.0 Stable
Time
Figure 3-2: The kinetics of a dimorphic phase transformation.
Although intuitively the most direct way of truly understanding polymorph selection by solvents is to study the nucleation, it is a very challenging problem both experimentally and computationally. The induction time to nucleation is usually on the order of hours,
sometimes even days, which makes it impossible to study using classic molecular dynamics, which can only simulate nano-second time scale events of a modest sized system of ~10000 atoms. Recently, with the development of advanced simulation techniques for more efficient sampling of rare events (e.g. transition path sampling3 9), a few computational studies of the
nucleation of Lennard-Jones fluids"0 and the nucleation of the stable form of a molecular
crystal, terephthalic acid, from its metastable form4 1 were reported. This progress in
com-putational methods, although promising, is still not sophisticated enough for studying the nucleation of a real molecular crystal from solution, which requires a comprehensive consid-eration of the large number of degrees of freedom introduced by solvents, local orientation of the molecule, multiple molecules in the asymmetric unit cell, etc. Experimentally detecting the occurrence of nucleation is extremely difficult due to the limitation in the resolution of currently available instruments. Critical nuclei usually consist of hundreds molecules and are typically of the size of a few nano meters. One can only infer the nucleation mechanism from the post-nucleation observation (crystals harvested) or from the pre-nucleation solution chemistry. The latter approach falls in line with the link hypothesis mentioned earlier and will be discussed more next.
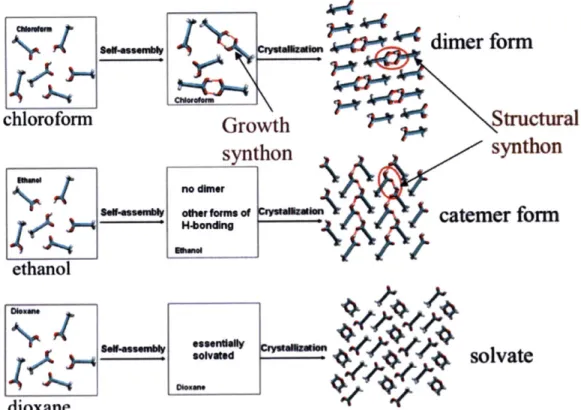
The self-assembly of solute molecules in solution happens much faster than the nucleation. It usually takes place in the time scale of nano seconds. Both experimental and computational approaches have been applied to study this process, to investigate the existence of the link, and to gain insights into the solvent mediated polymorph selection. Davey et al. studied the self-assembly of tetrolic acid in various solvents using FTIR Spectroscopy." Carboxylic acid dimers (growth synthon) formed by a pair of tetrolic acid molecules were detected in a tetrolic acid chloroform solution, from which a dimer based (structural synthon) crystal structure was obtained upon crystallization. The dimer motifs were absent in a tetrolic acid ethanol solution, from which a catemer based (structural synthon) crystal structure was obtained. They firstly proposed the existence of a link between the solution chemistry and the solid-state polymorphic outcome, which is schematically shown in Figure 3-3. This hypothesis was also successful in explaining the crystal structures obtained for various other systems, e.g.
2,6-dihydroxylbenzoic acid3 3 and 5-fluorouracil. 2 Exceptions have been reported as well,
i.e. mandelic acid4 3 and anthranilic acid," where the link between solution chemistry and
crystallization output is absent. There is sometimes a debate as to whether such a link exists when the structures of the clusters in solution are inferred using different measurements, e.g. glycine. 45-48 It is clear that the understanding of the clusters formed in solution using a solely
experimental approach is still limited. Molecular dynamics (MD) is a powerful tool that can track the motion of each atom in the system. It has been used previously to study the molecular self-assembly and precursor formation in a variety of solutions. 49,50 This approach
can provide understandings of the solute-solvent interactions at atomic level. Moreover, MD can be implemented to study those processes where direct access using experimental approaches is still very difficult. Hence, it is a good complementary tool for experimental techniques.
...,.
dimer
form
chloroform
Growth
Structural
synthon
synthon
no dimr
*11
*""*'O ""'""""
catemer form
ethanol
dioxane
Figure 3-3: The link hypothesis for tetrolic acid. Red circles highlight the structural synthons in forms I and II. TTA molecules are in Licorice representation: 0 in red, H in white, C in cyan and hydrogen bonds in red dashed lines.
3.3
Objectives
In this work, we have studied the self-assembly processes of two polymorphic organic crys-tals, tetrolic acid and glycine, in solution. Tetrolic acid (TTA) was selected as the model compound because it crystallizes into different polymorphic forms from different solvents and is a good supporting example for the link hypothesis." Glycine was selected as the other model compound because of the controversy surrounding the existence of the link,45-48
which will be described in detail in the glycine section. The objective of this study was to gain fundamental understandings of
1. the interplay between solute and solvent molecules,
2. the effects of solvent on the formation of various growth synthons and their relative stabilities,
3. the relationship between the structure of the solute clusters in solution and that of the
polymorph formed during crystallization.
Additionally, we wanted to provide some guidance for the rational selection of solvents for solution crystallization to obtain the desired polymorph.
3.4
Tetrolic Acid
3.4.1
Polymorphism of Tetrolic Acid
Tetrolic acid (TTA) crystallizes in both a dimer-based, centric P1 structure (form I) and a catemeric P21 chain structure (form II)." Form II is the stable form at room temperature,
whilst form I is more stable at higher temperatures, above 354 K.12 So the polymorphs are
enantiotropically related. The conformational difference between TTA molecules in forms I and II is very small, thus the polymorphism studied in this work is packing polymorphism. TTA is also reported to form a solvate with dioxane.32 Detailed crystallographic information is listed in Table 3.1. Previous studies on TTA precursors in solution by Gavezzotti et al.49 using molecular simulation tools showed that carboxylic acid dimers were the most persistent configuration in carbon tetrachloride, whilst the dimers broke immediately when the solvent was switched from carbon tetrachloride to water. This preliminary computational study was carried in a very dilute system without accounting for the multi-body interactions between solute molecules. Moreover, the relative stability of various synthons in solution and the mechanism through which solvent molecules mediate the self-assembly process are still not clear.
3.4.2
Computational Details
3.4.2.1 Force Field ValidationTTA was modeled using the CHARMM15 force field. Bond and angle equilibrium parameters were extracted by averaging the experimental X-ray crystal structures of forms I and II. The four solvents studied were carbon tetrachloride, chloroform, ethanol and dioxane. TTA is known to crystallize into form I, form II and a solvate from chloroform, ethanol and dioxane respectively. Carbon tetrachloride was chosen due to its strong apolarity, although no TTA crystals were experimentally obtained from this solvent currently. The dielectric constants of these solvents are listed in Table 3.2 as indictors of their polarity.53 Hydrogen bond
crystal type lattice parameters reported solvents refcode
form I52 a = 7.320
A
a = 83.91triclinic b = 5.099 A # = 117.46 chloroform TETROL
c = 7.226 A ' = 112 a
form I5 2 a = 7.887 A a = 90
monoclinic b = 7.121
A
0 = 100.18 ethanol TETROL01 c = 3.937 A Y = 90a = 4.1673 A a = 97.557
solvate 3 2 triclinic b = 6.5063 A 13 = 92.948 dioxane XAKGEW
c = 12.4424 A -y = 91.670 Table 3.1: Polymorph information of tetrolic acid.
a Crystal data are directly obtained from the Cambridge Crystallographic Data Center
(CCDC). Thus, the number of significant digits is not consistent.
measure of the molecule's hydrogen bond donor ability, which is related to the free energy change of the hydrogen bond formed between the molecule of interest and some reference base; the
#
parameter is a measure of the hydrogen accepter ability and is related to the free energy change of the hydrogen bond formed between the molecule of interest and some reference acid. For example, ethanol (a = 2.7,,3 = 5.8) is a strong hydrogen bond donoras well as a strong hydrogen bond acceptor, while dioxane (a = 0.9, 4 = 5.3) is only a strong hydrogen bond acceptor. Since chloroform and carbon tetrachloride are not well parameterized in the CHARMM force field, all solvents were modeled using the OPLS-AA force field14 with one modification: the arithmetic average instead of the geometric average
was used for combining the Lennard-Jones radii, thus the same potential energy functional forms could be applied for both TTA and solvents.
This modified CHARMM-OPLS forced field was carefully tested. The density and the heat of vaporization of these four solvents at 298 K and 1 atm were calculated using MD and compared to experimental values to validate the modification in the combination rule for LJ radius. A 2 ns MD trajectory of a cubic solvent box was obtained with time step of 1 fs in the NPT ensemble at 298 K and 1 atm. Periodic boundary conditions were applied. A
14 A cutoff was used for the van der Waals interactions and the smooth particle mesh Ewald method55 was applied to the electrostatic interactions. (This setting was used in all MD simulations in this study if periodic boundary conditions were present.) All atoms were fully flexible during the simulations, and all calculations were performed using the CHARMM program package. The last 1.5 ns run was used to calculate the density with a sampling interval of 1 ps and the statistical error was estimated using the method described by Allen. 56
The heat of vaporization was calculated using the formula:
AEvap = E(g) - E(l) (3.1)
A/Hap = AEva, + RT (3.2)
where E(g) and E(l) are the potential energies of the gas and liquid. The gas phase was treated as an ideal gas. E(g) represents the average potential energy of a single molecule in a vacuum (essentially the intramolecular energy of the model compound), computed from a 1 ns MD simulation in vacuum. Langevin dynamics was applied, with a friction coefficient of
500.0. The calculated and experimental values57,58 of the density and heat of vaporization of these solvents are listed in Table 3.2. There are only minor differences between the calculated and experimental values, which confirmed that the modified OPLS-AA force field (with the arithmetic average combination rule) was adequate in modeling these four organic solvents.
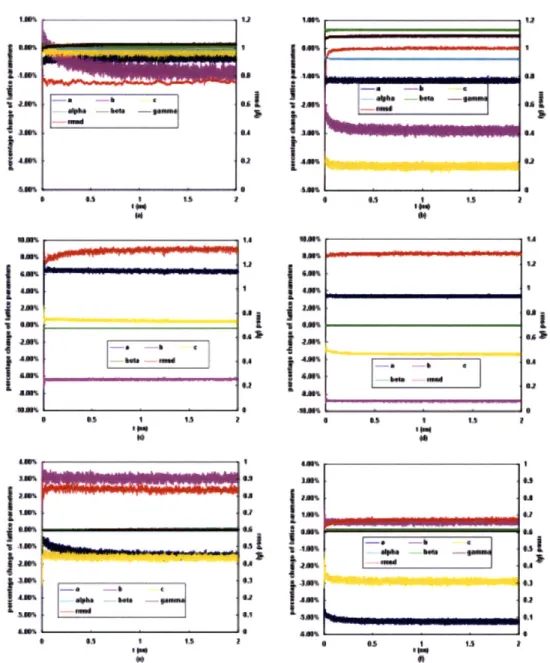
The suitability of using the CHARMM force field to model TTA was verified by the percentage changes of lattice parameters (PCLPs) and the root mean squared difference (RMSD) of a crystal supercell in a 2 ns MD simulation at 20 K and 1 atm. Low temperature MD simulation in the NPT ensemble is similar to a potential energy optimization in allowing the system to relax to a local minimum. The experimental X-ray crystal structure was used as the reference state. This simulation was performed for both TTA polymorphic forms I and
II, and the results are plotted in Figure 3-4a and c. The validation of mixing the CHARMM
and the OPLS-AA force fields was tested by performing the same MD simulation for the solvate form of TTA (shown in Figure 3-4e). The interactions between TTA and the other
three solvents were not tested due to the lack of comparable experimental data. The PCLPs for all these three forms of TTA crystal are within 6.5%, and the RMSDs over the whole MD simulation are less than 1.4 A, which suggests that the modified CHARMM-OPLS force field is adequate in modeling TTA crystals. We also performed the same simulations using purely the OPLS-AA force field (geometric average combination rule used for LJ radii) for TTA and dioxane, and results are plotted in Figure 3-4b, d and f. Compared to the modified CHARMM-OPLS force field, the pure OPLS-AA force field gives similar RMSD values, decreased PCLP values for the lattice parameter a of the form II and the lattice parameter b of the solvate, but increased PCLP values for the others cell parameters. Thus, we concluded that it was better to use the modified CHARMM-OPLS force field to model TTA and solvents in the following studies.
4AM am 4Mi SAN% am 483' am SAM% S Os I 4. tA a I. ~am3 4-il * 5 II a) too Uft [ i JA*% -3-' A[n ' 18%
lIE
ism S*A*%I IANJ8% 5 183 I28I S2 0 -IA% Si a Is aFigure 3-4: Percentage changes of the lattice parameters and RMSDs of TTA crystal super-cells in 2 ns MD simulations at 20 K and 1 atm. a) a box of form I crystal with 6a x 6b x 6c super-cells, the modified CHARMM-OPLS force field applied; b) a box of form I crystal with 6a x 6b x 6c cells, the OPLS-AA force field applied; c) a box of form II crystal with 6a x 6b x 12c cells, the modified CHARMM-OPLS force field applied, alpha and gamma parameters do not change over the whole simulation run, thus, are not shown here; d) a box of form II crystal with 6a x 6b x 12c cells, the OPLS-AA force field applied; (e) a box of solvate with 8a x 6b x 3c cells, the modified CHARMM-OPLS force field applied; (f) a box of solvate with 8a x 6b x 3c cells, the OPLS-AA force field applied.
j'~.
-.. 6* Si' U Si'1
I) IUd Oi SA 4. ts foodI
-ON-0dielectric hydrogen hydrogen density calc density exp C AHap calc AHvap exp d
constant a bond bond (g/ml) (g/ml) (kJ/mol) (kJ/mol)
parameter a b parameter
#
b ethanol 24.3 (298K) 2.7 5.8 0.767 t 0.001 0.789 42.01 t 0.17 42.30 chloroform 5.0 (273 K) 2.2 0.8 1.462 ± 0.001 1.498 31.38 ± 0.08 31.25 carbon 2.24 (293 K) 1.4 0.6 1.618 ± 0.002 1.594 32.17 ± 0.13 32.43 tetrachloride dioxane 2.2 (298 K) 0.9 5.3 1.002 ± 0.001 1.033 42.09 ± 0.08 40.42Table 3.2: Physical and chemical properties
a Experimental values of dielectric constant
of carbon tetrachloride, chloroform, from ref. 5
ethanol, and dioxane.
b Obtained from ref.54 a parameter is a measure of the hydrogen bond donor ability, 13 parameter is
hydrogen bond acceptor ability.
c Experimental values of density at 298 K and 1 atm from ref. 57
d Experimental values of heat of vaporization at 298 K and 1 atm from ref.58
3.4.2.2 Solvation Free Energy Calculation
The solvation free energies of TTA in different solvents from its gas phase at 298 K and 1 atm were used to characterize how strongly the solute molecules interact with the solvent molecules. The thermodynamic integration (TI) method was applied to calculate the solva-tion free energies. The initial state (A = 0) is defined as one TTA molecule fully solvated in a ~ 30A x ~ 30A x ~ 30A solvent box. The system was equilibrated at the target temperature
and pressure. System details are listed in Table 3.3. The final state (A = 1) is defined as
turning off the electrostatic and van der Waals interactions between the solute and solvent molecules. Ten windows were used from the initial state to the final state with 6A = 0.1.
For each window, the system was equilibrated for 100 ps and sampled for 500 ps.
carbon chloroform ethanol dioxane tetrachloride solution solution solution
solution
no. of solvent molecules 163 190 243 154
no. of TTA molecules 1 1 1 1
equilibrated cell size 29.5 A 30.2
A
31.8 A 29.1 ATable 3.3: System details of the MD simulations for the solvation free energy calculations of tetrolic acid.
3.4.2.3 Free Energy Change of the Dimerization Reaction
The formation of a carboxylic acid dimer (product) from two fully solvated TTA molecules
(reactant) was studied in these four solvents. The free energy change of the dimerization reaction (Figure 3-5) was used to characterize the stability of the carboxylic acid dimer, which was calculated using the MD umbrella sampling method. 59-61 The order parameter (OP) used to study this reaction was defined by averaging two distances between the hydroxyl hydrogen and carbonyl oxygen of a pair of TTA molecules, which is schematically shown in Figure 3-6. Two TTA molecules were inserted into a 30A x 30A x ~ 30A pre-equilibrated solvent
box, same as the solvent box used in the solvation free energy calculations (Table 3.3). To overcome diffusion, one TTA molecule was confined in the center of the simulation box using
a harmonic restraint with a force constant of 836.8 kJ/(mol-A2). A harmonic functional form of an umbrella potential was used, as shown below
U = ku( -60)2 (3.3)
Where, k, is the harmonic force constant with unit kJ/(mol-A2), Jo is the equilibrium point of the sampling window.
State I Dimer State 2 Catemer State 3 Monomer
Figure 3-5: Dimerization reaction of tetrolic acid.
dI
d2
OP = dl+d22
Figure 3-6: Definition of the order parameter (OP) used in the umbrella sampling of the dimerization reaction of tetrolic acid.
3.4.2.4 Radial Distribution Function Calculations
Radial distribution functions (RDFs)4 2 were used to provide more detailed structural
atomic density varies as a function of the distance from one particular atom (Figure 3-7), and can be expressed as
g12(r) N2(r) (3.4)
p*47r2 6r
where N2(r) is the number of particle 2 in the shell of thickness 6r and distance r away from
particle 1, and p* is the density of particle 2 in the bulk. To calculate the RDFs, a tetrolic acid molecule is inserted into a pre-equilibrated solvent box. More system information is shown in Table 3.4. Again to overcome diffusion, the TTA molecule was confined in the center of the simulation box using a harmonic restraint with a force constant of 836.8 kJ/(mol.A2). A 2 ns MD trajectory with time step 1 fs was harvested. Various RDFs were calculated
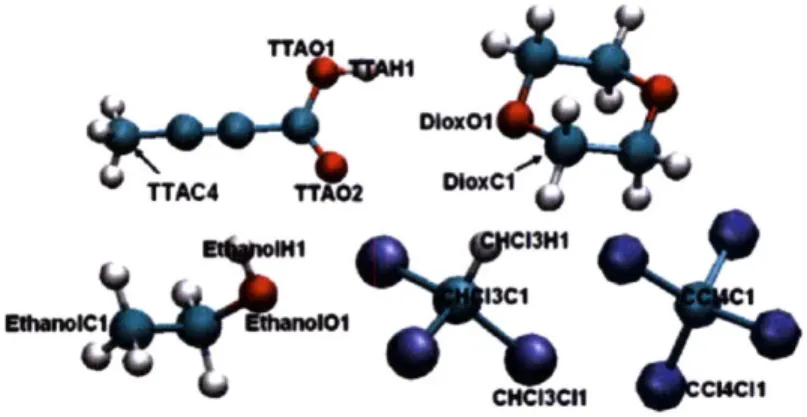
throughout the duration of the production run (the last 1.5 ns) by evaluating a histogram of the distances between the specific atom in solvent molecule and the interested atom in TTA every 0.1 ps. All atoms used in RDF calculations are labeled in Figure 3-8. RDFs reported are those obtained by averaging all of the histograms and normalizing the RDF value in the bulk to 1. 2 2
T
2 2 orFigure 3-7: Definition of the radial distribution function between atom 1 and atom 2.
3.4.2.5 Dimer Fraction of the Hydrogen Bond Network
MD simulations for tetrolic acid solutions of various concentrations (Table 3.5) were con-ducted to study the structure of the clusters formed in solution. Previous work from Davey
et al.13
showed that TTA is highly soluble in chloroform, ethanol and dioxane. The highest TTA concentrations used in their experiments were 3.0 M in chloroform, 7.9 M in ethanol,
Figure 3-8: Atom labels in the RDF calculations of tetrolic acid.
carbon chloroform ethanol dioxane tetrachloride solution solution solution
solution
no. of solvent molecules 416 390 464 247
no. of TTA molecules 1 1 1 1
equilibrated cell size 40.8 A 37.4 A 35.9 A 32.4