Comprehensive Molecular Characterization
of Pheochromocytoma and Paraganglioma
The MIT Faculty has made this article openly available.
Please share
how this access benefits you. Your story matters.
Citation
Fishbein, Lauren et al. “Comprehensive Molecular Characterization
of Pheochromocytoma and Paraganglioma.” Cancer Cell 31, 2
(February 2017): 181–193 © 2017 Elsevier Inc
As Published
http://dx.doi.org/10.1016/J.CCELL.2017.01.001
Publisher
Elsevier
Version
Author's final manuscript
Citable link
http://hdl.handle.net/1721.1/116699
Terms of Use
Creative Commons Attribution-NonCommercial-NoDerivs License
Detailed Terms
http://creativecommons.org/licenses/by-nc-nd/4.0/
Comprehensive molecular characterization of
pheochromocytoma and paraganglioma
Lauren Fishbein1,†,‡, Ignaty Leshchiner2,†, Vonn Walter3,†, Ludmila Danilova4, A. Gordon
Robertson5, Amy R. Johnson6, Tara M. Lichtenberg7, Bradley A. Murray2, Hans K. Ghayee8,
Tobias Else9, Shiyun Ling10, Stuart R. Jefferys3, Aguirre A. de Cubas3,11,§, Brandon
Wenz12, Esther Korpershoek13, Antonio L. Amelio3, Liza Makowski3,6, W. Kimryn
Rathmell3,11,§, Anne-Paule Gimenez-Roqueplo14, Thomas J. Giordano15, Sylvia L. Asa16,
Arthur S. Tischler17, The Cancer Genome Atlas Research Network, Karel Pacak18,*,
Katherine L. Nathanson12,19,*, and Matthew D. Wilkerson3,20,ᵟ,*,a
1Division of Endocrinology, Diabetes and Metabolism, Department of Medicine, Perelman School
of Medicine at the University of Pennsylvania, Philadelphia, PA 19104 USA 2The Eli and Edythe L.
Broad Institute of Massachusetts Institute of Technology and Harvard University, Cambridge, MA 02142 USA 3Lineberger Comprehensive Cancer Center, University of North Carolina at Chapel
Hill, Chapel Hill, NC 27599 USA 4The Sidney Kimmel Comprehensive Cancer Center at Johns
Hopkins University, Baltimore, MD 21287 USA 5Canada’s Michael Smith Genome Sciences
Centre, BC Cancer Agency, Vancouver, BC V5Z 4S6 Canada 6Department of Nutrition, University
of North Carolina at Chapel Hill, Chapel Hill, NC 27599 USA 7The Research Institute at
Nationwide Children’s Hospital, Columbus, OH 43205 USA 8Division of Endocrinology, Diabetes
& Metabolism, Department of Medicine, College of Medicine, University of Florida, Gainesville, FL
*Corresponding authors: Matthew D. Wilkerson: mdwilkerson@outlook.com; Katherine L. Nathanson: knathans@exchange.upenn.edu; Karel Pacak: karel@mail.nih.gov.
†Co-first authors aLead Contact
‡Current address: Division of Endocrinology, Metabolism and Diabetes, Department of Medicine, University of Colorado School of Medicine, Aurora, CO 80045, USA
§Current address: Division of Hematology and Oncology, Department of Medicine, Vanderbilt Ingram Cancer Center, Vanderbilt University School of Medicine, Nashville, TN 37232, USA
ᵟCurrent address: The American Genome Center, Collaborative Health Initiative Research Program, Department of Anatomy, Physiology and Genetics, Uniformed Services University of the Health Sciences, Bethesda, MD 20814, USA
Publisher's Disclaimer: This is a PDF file of an unedited manuscript that has been accepted for publication. As a service to our
customers we are providing this early version of the manuscript. The manuscript will undergo copyediting, typesetting, and review of the resulting proof before it is published in its final citable form. Please note that during the production process errors may be discovered which could affect the content, and all legal disclaimers that apply to the journal pertain.
Author Contributions
M.D.W., K.P. and K.L.N. jointly led the PCPG Analysis Working Group. M.D.W. coordinated overall analysis. L.F. served as data coordinator. T.M.L. coordinated clinical data. T.J.G., S.L.A. and A.S.T. performed the pathological analysis. V.W., S.R.J. and M.D.W. coordinated RNA sequencing analysis. A.R.J., A.L.A., L.M. and M.D.W. performed MAML3 fusion gene validation analysis. I.L. and M.D.W. coordinated the DNA sequencing analyses. K.L.N., L.F., I.L., T.E. and M.D.W. performed the germline mutation analysis. I.L. and B.A.M. coordinated copy number analysis. A.G.R. coordinated miRNA sequencing analysis. L.D. coordinated DNA methylation analysis. S.L. coordinated RPPA analysis. L.F., A.A.d.C., B.W. and W.K.R. coordinated pathway analysis. K.L.N., L.F., K.P., A.S.T., H.K.G., T.E., W.K.R., T.J.G., S.L.A., A-P.G-R. and E.K. contributed clinical analysis. K.L.N., M.D.W. and L.F. wrote the manuscript, which all authors reviewed.
HHS Public Access
Author manuscript
Cancer Cell
. Author manuscript; available in PMC 2018 February 13.Published in final edited form as:
Cancer Cell. 2017 February 13; 31(2): 181–193. doi:10.1016/j.ccell.2017.01.001.
A
uthor Man
uscr
ipt
A
uthor Man
uscr
ipt
A
uthor Man
uscr
ipt
A
uthor Man
uscr
ipt
32610 USA 9Division of Metabolism, Endocrinology, & Diabetes, Department of Internal Medicine,
University of Michigan Health System, Ann Arbor, MI 48109, USA 10University of Texas MD
Anderson Cancer Center Houston, TX, 77030, USA 11Division of Hematology and Oncology,
Department of Medicine, University of North Carolina at Chapel Hill, Chapel Hill, NC 27599 USA
12Division of Translational Medicine and Human Genetics, Department of Medicine, Perelman
School of Medicine at the University of Pennsylvania, Philadelphia, PA 19104 USA 13Department
of Pathology, Erasmus MC University Medical Center, Rotterdam, The Netherlands 14INSERM,
UMR970, Paris-Cardiovascular Research Center, F-75015, Paris, France 15Department of
Pathology, University of Michigan Health System, Ann Arbor, MI 48109, USA 16Department of
Pathology, University Health Network, Department of Laboratory Medicine and Pathobiology, University of Toronto, Toronto, Ontario M5G 2C4 Canada 17Department of Pathology and
Laboratory Medicine, Tufts Medical Center, Boston MA 02111 USA 18Endocrinology and Tumor
Genetics Affinity Group, Eunice Kennedy Shriver NICHD, NIH MD 20892 USA 19Abramson
Cancer Center, Perelman School of Medicine at the University of Pennsylvania, Philadelphia, PA 19104 USA 20Department of Genetics, University of North Carolina at Chapel Hill, Chapel Hill, NC
27599 USA
Summary
We report a comprehensive molecular characterization of pheochromocytomas and
paragangliomas (PCC/PGLs), a rare tumor type. Multi-platform integration revealed that PCC/ PGLs are driven by diverse alterations affecting multiple genes and pathways. Pathogenic germline mutations occurred in eight PCC/PGL susceptibility genes. We identified CSDE1 as a somatically-mutated driver gene, complementing four known drivers (HRAS, RET, EPAS1, NF1). We also discovered fusion genes in PCC/PGL, involving MAML3, BRAF, NGFR and NF1. Integrated analysis classified PCC/PGLs into four molecularly-defined groups: a kinase signaling subtype, a pseudohypoxia subtype, a Wnt-altered subtype, driven by MAML3 and CSDE1, and a cortical admixture subtype. Correlates of metastatic PCC/PGL included the MAML3 fusion gene. This integrated molecular characterization provides a comprehensive foundation for developing PCC/PGL precision medicine.
Graphical abstract
A
uthor Man
uscr
ipt
A
uthor Man
uscr
ipt
A
uthor Man
uscr
ipt
A
uthor Man
uscr
ipt
Keywords
pheochromocytoma; paraganglioma; genomics; MAML3; CSDE1; sequencing; expression subtypes; TCGA; molecular profiling; metastasis
Introduction
Pheochromocytomas (PCCs) and paragangliomas (PGLs) are neuroendocrine tumors that originate from chromaffin cells and occur in the adrenal medulla (PCCs) and in sympathetic or parasympathetic ganglia (PGLs). Most present as benign, yet show high morbidity and mortality due to excessive catecholamine production, leading to hypertension, arrhythmia and stroke. Up to 25% are malignant (Ayala-Ramirez et al., 2011), as defined by distant metastases to non-chromaffin tissues. Patients with metastatic PCC/PGLs have limited treatment options and poor prognosis, often with less than 50% surviving at five years (Hescot et al., 2013). Despite a low incidence (0.8 per 100,000 for PCCs) (Beard et al., 1983), over one-third of PCC/PGLs are associated with inherited cancer susceptibility syndromes, which is the highest rate among all tumor types (Dahia, 2014). Inherited mutations have been identified in more than 15 well-characterized genes, most commonly in VHL, SDHB, SDHD, NF1 and RET (Favier et al., 2015). Markers of metastatic disease are limited, including germline SDHB mutations, extra-adrenal location, tumor size and elevated plasma methoxytyramine levels (Amar et al., 2005; Ayala-Ramirez et al., 2011; Eisenhofer et al., 2012)
Although the inherited basis of PCC/PGLs has been well characterized, somatic profiles have not been well delineated. To date, limited somatic profiling has identified mutations at various frequencies in several genes including EPAS1 (HIF2α), RET, VHL, RAS, NF1 and ATRX (Burnichon et al., 2012; Burnichon et al., 2011; Cho et al., 2005; Comino-Mendez et al., 2013; Crona et al., 2013; Fishbein et al., 2015; Hrascan et al., 2008; Komminoth et al., 1994; Toledo et al., 2016; Zhuang et al., 2012) and has identified recurrent somatic copy number alterations (Flynn et al., 2015a). Nevertheless, there is still a substantial fraction of
A
uthor Man
uscr
ipt
A
uthor Man
uscr
ipt
A
uthor Man
uscr
ipt
A
uthor Man
uscr
ipt
PCC/PGLs for which the etiology of tumorigenesis is not well understood. As part of The Cancer Genome Atlas (TCGA), we aimed to generate a comprehensive genomic
characterization of PCC/PGLs.
Results
Patient Cohort and Molecular Analysis Strategy
Through the TCGA, we collected and analyzed a cohort of PCC/PGLs from 173 patients (Table S1). Fifty-seven percent of patients were female and 43% were male. The mean age at initial diagnosis of PCC/PGL was 47 years with a range of 19 to 83 years. Eleven patients (6%) had distant metastatic events. In total, 16 patients (9%) had aggressive disease events defined by having distant metastatic events, positive local lymph nodes or local recurrence. Plasma or urine biochemical testing results were available for 144 patients (83%). Clinical genetic testing results were available for 116 patients (67%).
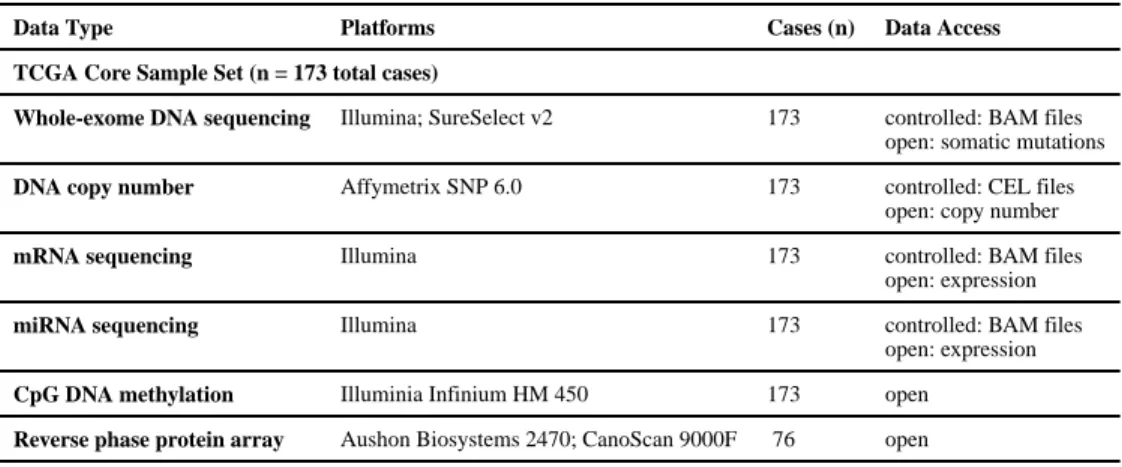
To identify and characterize PCC/PGL genome alterations, tissue specimens were analyzed by multiple genomic assays (Table 1). Matched normal tissue and tumor specimens were analyzed by whole-exome sequencing for mutations and SNP arrays for copy number analysis. Tumor specimens were also analyzed by mRNA sequencing, miRNA sequencing, DNA methylation arrays and reverse phase protein arrays for targeted proteome analysis. Our analysis strategy involved a systematic interrogation by platform to identify genomic alterations in PCC/PGL, including germline mutations, somatic mutations, fusion genes and copy number alterations. Multi-platform integration and computational analysis was then performed to (1) characterize the broad molecular correlates of prominent driver alterations; (2) identify a PCC/PGL molecular subtype classification; (3) identify disrupted pathways; and (4) identify molecular discriminants of metastatic disease. The integrated clinical and genomic datasets are available through the NCI’s Genomic Data Commons.
Germline and Somatic Mutations
Because susceptibility gene mutations are prevalent in patients with PCC/PGLs, we first analyzed DNA exome sequencing of normal specimens to identify germline mutations in the cohort. Pathogenic germline mutations were detected within eight previously reported PCC/PGL susceptibility genes in 46 patients (27% of the cohort) (Figure 1; Table S2). Our germline mutation calls agreed with available clinical testing results. SDHB (9%), RET (6%), VHL (4%) and NF1 (3%) exhibited the highest rates of germline mutation. Germline mutations in SDHD, MAX, EGLN1 (PHD2) and TMEM127 were rare at ≤ 2% each, consistent with prior studies containing cohorts of predominantly PCCs (Dahia, 2014; Favier et al., 2015).
Turning to somatic mutations, PCC/PGLs exhibited a low somatic sequence mutation rate (mean 0.67 mutations per megabase) relative to other cancer types (Lawrence et al., 2013). Analyzing somatic mutations for recurrent, statistically significant driver genes identified five genes: HRAS, NF1, EPAS1, RET and CSDE1 (MutSig2 (Lawrence et al., 2013) q < 0.05; Figure 1; Table S3). The majority of these mutations were clonal (Carter et al., 2012). Somatic HRAS mutations clustered at the Q61 hotspot, known to activate the MAPK
A
uthor Man
uscr
ipt
A
uthor Man
uscr
ipt
A
uthor Man
uscr
ipt
A
uthor Man
uscr
ipt
signaling pathway (Crona et al., 2013). Somatic EPAS1 (HIF2α) mutations occurred at hotspots (A530, P531, Y532) associated with increased HIF stabilization and transcriptional activity (Zhuang et al., 2012). Analysis for known hotspots and cancer relevant genes identified BRAF (p.G469A), IDH1 (p.R132C), FGFR1, VHL, ATRX, TP53, SETD2 and ARNT mutations.
We observed that three genes with pathogenic germline mutations also had somatic mutations in the cohort: RET, NF1 and VHL. RET mutations occurred in distinct protein-coding regions with germline mutations clustered at the codon C634 in the extracellular domain and somatic mutations clustered at the codon M918 in the intracellular tyrosine kinase domain (p < 0.001; Figure 2A), similar to the pattern seen in medullary thyroid carcinoma (Figlioli et al., 2013). RET was significantly overexpressed in mutated tumors, both germline and somatic, relative to wild-type tumors (p < 0.003, Figure 2B). In contrast, NF1 and VHL mutations did not display positional tendencies based on somatic or germline origin.
Considering the genes with pathogenic germline mutations or significant somatic mutations (i.e. the 21 genes in Figure 1), there was striking mutual exclusivity among mutations (p < 1e-4), indicating that tumors typically have at most one mutation in this gene set. Only four tumors had both germline and somatic mutations in these genes: three tumors had both SDHB germline and ATRX somatic mutations, a previously reported association (Fishbein et al., 2015), and one tumor had both RET germline (p.V804M) and somatic (p.M918T) mutations. Germline mutated PCC/PGLs also possessed somatic copy number events, indicating that these tumors are clonally derived (Figure 1). As expected, germline mutation in NF1, SDHB or VHL tended to co-occur with somatic copy number deletion of the respective locus.
This study found that the Cold shock domain–containing E1 gene (CSDE1) is significantly mutated in PCC/PGL. CSDE1, formerly known as UNR, is required developmentally and effects translation initiation, RNA stability, cell-type-specific apoptosis, differentiation and neuronal development (Kobayashi et al., 2013; Mihailovich et al., 2010). Four tumors contained CSDE1 mutations, two frameshift and two splice-site mutations, which clustered proximally within the gene. Analysis of tumor mRNA sequencing (Wilkerson et al., 2014) confirmed that both tumors with splice-site mutations had distinctive splicing alterations (Figure 2C). One tumor had an acceptor site mutation that resulted in intron retention and a truncated protein sequence (593 vs 844 amino acids) (right purple triangle in Figure 2C, Figure S1A). An additional tumor had a mutation in an intron donor site, resulting in upstream exon skipping (left purple triangle in Figure 2C, Figure S1A) and a transcript with a small, in-frame protein sequence truncation (789 vs 844 amino acids). Multi-platform integration revealed that CSDE1 mutated tumors had marked genomic deletion and underexpression of the gene, supporting a loss-of-function role (Figure 2D). Located at 1p13.2, CSDE1 provides a possible target of the broad 1p deletion observed in PCC/PGL in addition to SDHB loss. Finally, comparing the expression profiles of CSDE1 mutant PCC/ PGLs to published microarrays of Csde1 knockout in mouse embryonic stem cells (Dormoy-Raclet et al., 2007; Elatmani et al., 2011) revealed significant correlation, supporting the functional role of CSDE1 mutations in PCC/PGL (Figure S1B).
A
uthor Man
uscr
ipt
A
uthor Man
uscr
ipt
A
uthor Man
uscr
ipt
A
uthor Man
uscr
ipt
Fusion Gene Discovery and Integrated Characterization
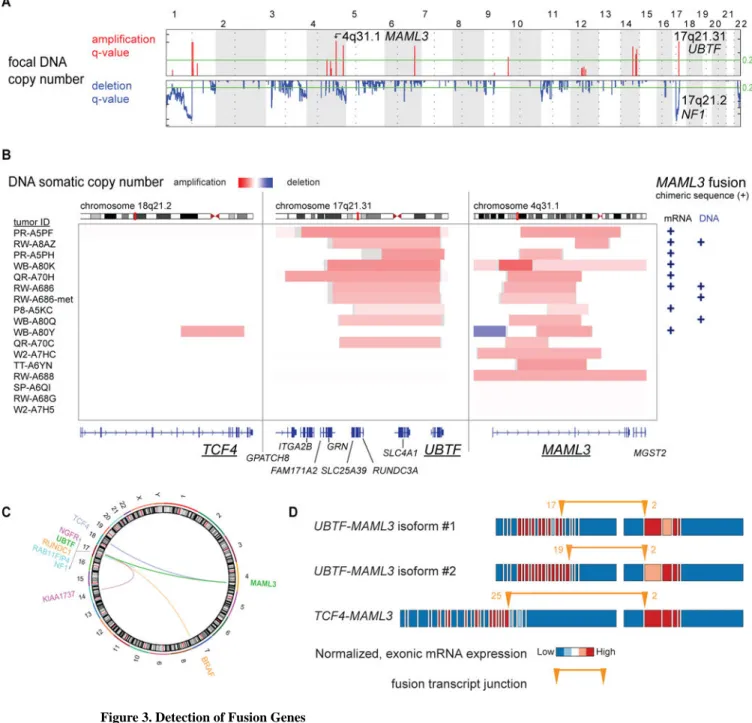
We then analyzed DNA focal copy number in PCC/PGLs using GISTIC2 (Mermel et al., 2011). Many focal deletion peaks (n = 27) were detected, including NF1 (Figure 3A), as previously reported (Burnichon et al., 2012). In contrast, focal amplification peaks were sparse (n = 7). Further analysis of the focal amplifications led to a striking finding. Ten of 16 primary tumors with focal 4q31.1 amplification also had 17q21.31 focally amplified (p < 3e-8; Figure 3B and S2A). Analysis of fusion transcripts from RNA sequencing (Wang et al., 2010) revealed that seven of these 10 co-amplified tumors (p < 2e-9) possessed in-frame RNA fusion transcripts spanning the 5′ portion of UBTF (upstream binding transcription factor) on 17q21.31 and the 3′ portion of MAML3 (a member of the Mastermind-like family of transcriptional co-activators (McElhinny et al., 2008)) on 4q31.1. UBTF-MAML3 fusion-positive tumors expressed one of two mutually exclusive fusion isoforms with the mRNA transcript starting at either exon 17 or 19 of UBTF, suggesting two different introns for the DNA breakpoints (Figure 3B; Table S4). RNA sequencing also identified one TCF4-MAML3 fusion transcript, which occurred in a tumor with focal DNA co-amplification of TCF4 on 18q21.2 and MAML3 (Figure 3B and S2A). Using the ABRA program (Mose et al., 2014) to reassemble DNA exome sequencing, chimeric DNA of the UBTF-MAML3 translocation was found in two of the mRNA fusion-positive tumors and in two additional tumors, including a primary/metastasis pair with the same DNA translocation break point (Figure 3B and Figure S2A and S2B and S2C). The sole adjacent normal tissue specimen from a MAML3 fusion-positive case did not contain the fusion, supporting tumor specificity. Providing further validation, reverse-transcription PCR of tumor RNA for the product spanning the UBTF-MAML3 fusion breakpoint confirmed both UBTF-MAML3 isoforms (Figure S2D and S2E). In all, 10 tumors were positive for a MAML3 fusion gene. The boundaries of UBTF DNA copy number amplification typically aligned with the fusion transcript location at exon 17 (Figure S2A) and the latter half of UBTF is not amplified, suggesting that DNA translocation preceded DNA amplification of the fusion gene. In other tumors, we identified an overexpressed KIAA1737-NGFR fusion gene (NGFR 3.0 fold overexpression vs cohort mean), an overexpressed RUNDC1-BRAF fusion gene (BRAF 5.2 fold overexpression) and an underexpressed NF1-RAB11FIP4 fusion gene (NF1 9.9 fold underexpression). Interestingly, all but one of these fusion genes had a break point localized to 17q (Figure 3C).
The MAML3 fusion gene appears to be a gain of function event in PCC/PGL as fusion-positive tumors substantially overexpressed MAML3 compared with fusion-negative tumors (2.7 fold overexpression, p< 5e-6). Furthermore, the expression pattern across the native exons suggests that the promoter of UBTF or TCF4 drives overexpression of MAML3, with the 5′ exons in UBTF or TCF4 and the 3′ exons of MAML3 overexpressed relative to exons not in the fusion product (Figure 3D).
Although MAML3 is conventionally known as a NOTCH transcriptional co-activator, the PCC/PGL MAML3 fusion genes do not contain the NOTCH binding site and PCC/PGL with MAML3 fusion genes do not consistently overexpress NOTCH target genes (Figure S3A). These results suggest that altered NOTCH signaling is not the primary consequence of MAML3 fusion genes, similar to another study examining a different solid tumor type with
A
uthor Man
uscr
ipt
A
uthor Man
uscr
ipt
A
uthor Man
uscr
ipt
A
uthor Man
uscr
ipt
exon 1 deleted MAML3 fusion genes (Wang et al., 2014). MAML3 fusion-positive tumors were not distinctive histologically. Searching for correlated molecular alterations that might point to MAML3 fusion gene functional consequences in PCC/PGL, we found fusion-positive tumors to have a unique and expansive methylation profile relative to MAML3 fusion-negative tumors (4,229 significant probes) (Figure 4A). The number of differentially methylated probes was far greater than expected by chance (352 probes; p < 0.002; Figure S3B). The predominant effect was hypomethylation of positive compared to fusion-negative tumors. Among these probes, increasing hypomethylation was positively correlated with mRNA overexpression of corresponding target genes (p < 4e-10; Figure S3C).
Analyzing MAML3 fusion-positive tumors by pathway analysis, we found that genes in developmental pathways, Wnt receptor signaling and Hedgehog signaling, were significantly overexpressed (Figure S3D and Figure 4B), several of which were also hypomethylated (Figure S3C). By miRNA analysis, the strongest marker of the fusion-positive tumors was an underexpression of miR-375, a negative regulator of Wnt signaling pathway member FZD8 (Miao et al., 2015) (Figure S3E and Figure 4B). Finally, RPPA analysis showed Wnt pathway members β-catenin, DVL3, and GSK3 were overexpressed in MAML3 fusion-positive tumors (Figure 4B). This non-canonical association of MAML3 with increased signaling through the Wnt pathway is also supported by a study of MAML proteins in colon cancer cell lines (Alves-Guerra et al., 2007), describing TCF target gene activation via β-catenin.
Recently, Heynen and colleagues found that MAML3 overexpression plays a role in retinoic acid resistance in neuroblastoma, a developmentally-related tumor type (Heynen et al., 2016). These authors reported an 828 gene expression signature of MAML3 activation derived from a neuroblastoma cell line transfected with an exon 1 deleted MAML3 overexpression vector compared to the untransfected parental cell line. This truncated MAML3 is similar to the PCC/PGL MAML3 fusion gene. The Heynen et al. signature was highly overexpressed in MAML3 fusion-positive PCC/PGLs compared to PCC/PGLs without the fusion (p < 3e-6; Figure 4C). In particular, analysis of the Heynen et al. signature revealed that many Wnt receptor and Hedgehog signaling genes, such as WNT4, WNT11, WNT5A, NKD1 and GLI2, were overexpressed after truncated MAML3 activation, whereas NOTCH targets were not recurrently overexpressed. Wnt and Hedgehog signaling thus, appear to be consequences of MAML3 activation. Finally, Heynen et al. demonstrated that the overexpressed MAML3 caused greater proliferation rates in the cell line model,
suggesting that the MAML3 fusion gene may be associated with an increased growth rate in PCC/PGLs.
Molecular Classification
To derive a molecular classification for PCC/PGL, we performed unsupervised consensus clustering of tumor mRNA expression profiles (Wilkerson and Hayes, 2010), detecting four statistically significant expression subtypes (SigClust (Liu et al., 2008) p < 0.001; Figure S4A and S4B). To validate our findings, we re-analyzed an independent cohort of PCC/ PGLs (Burnichon et al., 2011) and found the same four expression subtypes, indicating that the subtypes are reproducible (Figure S4C and S4D). Next, we compared the expression subtypes by the other five genomic platforms and identified many subtype-specific
A
uthor Man
uscr
ipt
A
uthor Man
uscr
ipt
A
uthor Man
uscr
ipt
A
uthor Man
uscr
ipt
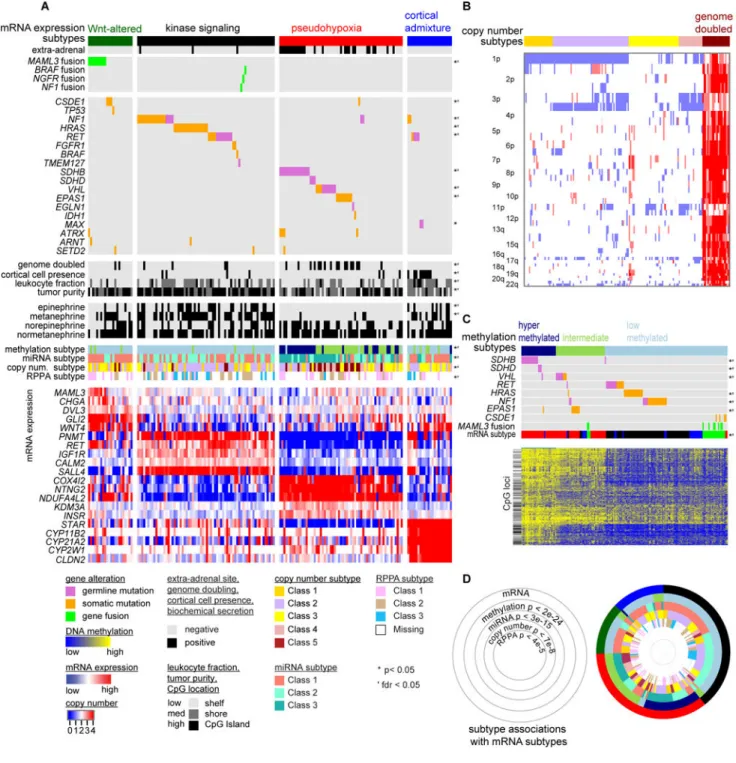
molecular alterations (Figure 5A and Figure S5). We designated the subtypes “kinase signaling,” “pseudohypoxia,” “Wnt-altered” and “cortical admixture.” Subtypes detected from clustering analyses of other platforms (methylation, copy number, miRNA and RPPA) were each significantly associated with the expression subtypes (Figure 5 and Figure S5). The Wnt-altered subtype consisted of adrenal PCCs and overexpressed genes in the Wnt and Hedgehog signaling pathways, such as WNT4 and DVL3. This subtype also had the highest overexpression of CHGA (p < 0.002), a gene relevant to chromaffin cell function. The CHGA product, chromogranin A, is a clinical marker of neuroendocrine tumors and is known to correlate with the presence of PCC/PGL and, to a certain degree, with the presence of metastatic disease (Bilek et al., 2008). Strikingly, this subtype contained all tumors having MAML3 fusion genes (p < 4e-9) and three of four with CSDE1 mutations (p < 0.01). The strong associations of these alterations with an unsupervised expression subtype are
consistent with MAML3 fusion genes and CSDE1 somatic mutations being important driver events. Alterations in both genes appear to be two independent routes to activate Wnt and Hedgehog signaling in PCC/PGL. As no mutations in germline susceptibility genes were observed within these tumors, the Wnt-altered subtype was specific to sporadic PCC. The kinase signaling subtype was observed predominantly in PCCs and had the highest expression of PNMT, which encodes the enzyme that converts norepinephrine to epinephrine. PNMT expression is associated with the adrenergic phenotype of specific hereditary PCC/PGLs (Eisenhofer et al., 2011). This subtype had somatic and germline mutations in NF1, RET, TMEM127 and HRAS, as previously reported (Burnichon et al., 2011; Castro-Vega et al., 2015), and rarer events affecting kinase signaling, including fusion genes involving NF1, BRAF and NGFR. This subtype, particularly the HRAS mutated subset, was enriched within protein expression (RPPA) cluster 3, which had increased expression of components of the RAS-MAPK signaling pathway and reduced expression of the DNA damage pathway (Figure S5A). This subtype was also enriched with DNA copy number cluster 2, as defined by 1p, 3q, and 17q deletions (Figure S5B). Nearly all (95%) NF1 germline or somatically mutated tumors also had 17q11.2 focal deletions, the vast majority (86%) of which occurred in the kinase signaling subtype.
The pseudohypoxia subtype consisted of both PCCs (57%) and PGLs (43%) and typically had negative epinephrine and metanephrine secretion. Germline mutations in SDHB, SDHD and VHL, and somatic mutations in VHL and EPAS1 were completely specific to this subtype (Figure 5A), consistent with earlier studies (Burnichon et al., 2011; Dahia et al., 2005; Welander et al., 2014). In addition to this mutational profile, the pseudohypoxia subtype displayed distinctive molecular profiles on several other platforms. Most genome-doubled tumors (74%), in which nearly all chromosomes are amplified, occurred in the pseudohypoxia subtype, mostly in conjunction with EPAS1 or VHL mutations (Figure 5A and 5B; Figure S5B). The pseudohypoxia subtype also contained two of the three
unsupervised clusters of DNA methylation (hypermethylated and intermediate) confirming earlier reports (Letouze et al., 2013), with most SDHB and SDHD germline mutations occurring in the hypermethylated subtype and nearly all VHL and EPAS1 mutations in the intermediate subtype. Lastly, miRNA cluster 3 was tightly associated with the
A
uthor Man
uscr
ipt
A
uthor Man
uscr
ipt
A
uthor Man
uscr
ipt
A
uthor Man
uscr
ipt
pseudohypoxia subtype (Figure S5C) and displayed overexpression of mir-210, a marker of tumor hypoxia (Huang et al., 2009).
Finally, the cortical admixture subtype overexpressed known adrenal cortex markers (CYP11B1, CYP21A2 and STAR) (Figure 5A). Given this, our expert pathologist re-analyzed all tumors to determine the presence of any cortical cells within the sample. A significant (p < 5e-5) association with the presence of cortical cells was found with this expression subtype (Figure S6A), otherwise histological features did not differentiate the expression subtypes. Tumors in this subtype had reduced tumor purity, determined from DNA analysis (Carter et al., 2012), and elevated leukocyte infiltration determined from DNA methylation profiles (Figure 5A). Thus, these findings suggest the possibility of impure tumor sampling. Next, we evaluated possible similarity of this subtype to adrenal cortex tissue by performing unsupervised mRNA and DNA methylation analysis on the pool of PCC/PGL tumors, available adjacent normal tissue specimens of the adrenal cortex, and TCGA adrenocortical carcinomas (Zheng et al., 2016). By mRNA analysis the cortical admixture subtype tumors overexpressed both PCC/PGL markers and adrenal cortex markers (Figure S6B). By DNA methylation analysis, cortical admixture subtype tumors typically exhibited the PCC/PGL methylation profile and not the normal adrenal cortex or adrenocortical carcinoma profiles (Figure S6C). Thus, the cortical admixture tumors have molecular features of PCC/PGL and are not merely defined by adrenal cortex molecular features alone. In addition, both germline mutations in MAX occurred in the cortical admixture subtype (p < 0.032), supporting a distinct underlying biology. MAX mutation associated PCCs have been reported to contain multiple tumor foci within one adrenal gland (Burnichon et al., 2012). We hypothesize that multi-focal disease associated with MAX mutations also may explain the presence of interspersed cortical cells in the cortical admixture subtype.
Pathway Analysis
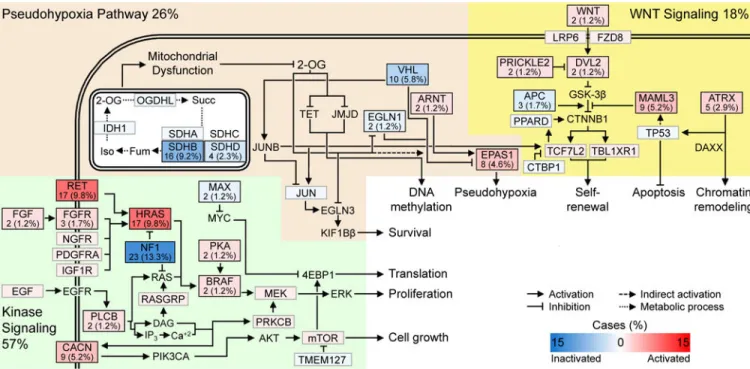
Careful manual review of the somatic and germline alterations identified signaling pathways that were disrupted in PCC/PGLs: the kinase and hypoxia signaling pathways, Krebs cycle/ electron transport, and Wnt signaling (Figure 6). The kinase signaling pathway contained alterations in NF1, HRAS and RET, as previously reported (Burnichon et al., 2011), and we now expand this set with alterations in BRAF, FGFR, NGFR and subunits of cAMP-dependent protein kinase A (PKA). Mutations in the subunits of PKA have been implicated in other adrenal pathologies; notable examples are PRKAR1A in Carney complex and PRKACA in adrenocortical carcinoma (Berthon et al., 2015). Within the hypoxia signaling pathway, we found mutually exclusive mutations in interacting proteins, including VHL, ANRT (HIF1β), EPAS1 (HIF2α) and EGLN1 (PHD2). Disruption of the hypoxia signaling pathway leads to a state of pseudohypoxia that drives cell proliferation. Many tumors had mutations in the Krebs cycle genes SDHB and SDHD, as expected, and one had an IDH1 mutation. The SDHx and IDH mutations are predicted to impair glucose consumption and metabolism leading to inhibition of 2-oxoglutarate-dependent histone and DNA demethylase enzymes, resulting in epigenetic silencing (Yang and Pollard, 2013). Several genes in the Wnt signaling pathway were altered, with MAML3 being the most common (Alves-Guerra et al., 2007). We also found mutations in ATRX, often with concurrent SDHB mutations.
A
uthor Man
uscr
ipt
A
uthor Man
uscr
ipt
A
uthor Man
uscr
ipt
A
uthor Man
uscr
ipt
ATRX mutations have been previously reported in conjunction with mutations in IDH1 (Jiao et al., 2012) and SDHB (Fishbein et al., 2015), suggesting that they are synergistic in tumor development.
Clinical outcome associations
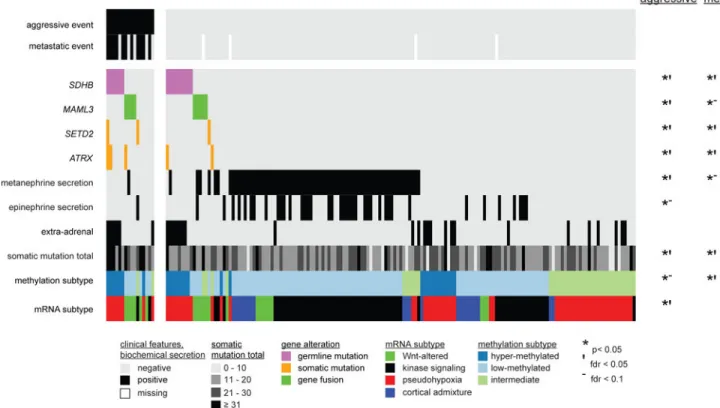
As it is both clinically important and challenging to distinguish malignant from benign PCC/ PGL, we sought to identify molecular features associated with negative clinical events. Aggressive-disease-free-survival (ADFS), the time until the occurrence of either distant metastases, local recurrence or positive regional lymph nodes, was significantly associated with nine molecular markers (Figure 7). Markers associated with poor ADFS included MAML3 fusion gene, SDHB germline mutation, somatic mutation in SETD2 or ATRX, high somatic mutation total, the Wnt-altered and pseudohypoxia expression subtypes, and the hypermethylated subtype. In contrast, plasma and/or urine metanephrine and epinephrine positivity, the kinase signaling expression subtype and the low-methylated subtype were associated with longer ADFS. Analysis of metastatic-free-survival (MFS), the time until occurrence of distant metastases, resulted in significant associations for seven of the nine prior markers, all except mRNA subtype and epinephrine positivity, and no additional markers. Analysis of Ki-67 protein expression by immunohistochemistry in a subset of PCC/ PGLs (n = 62) was found to positively correlate with metastatic disease (Figure S7A–C). Interestingly, the tumor with the highest Ki-67 expression was MAML3 fusion-positive (Figure S7D). In summary, our analysis confirmed SDHB germline mutations, ATRX somatic mutations and Ki-67 expression as clinical outcome markers (Ayala-Ramirez et al., 2011; Dahia, 2014; Fishbein et al., 2015) and identified seven additional molecular markers for clinical outcome, including the MAML3 fusion gene.
Discussion
We report a comprehensive molecular profiling with six platforms to characterize the molecular basis of PCC/PGLs. We identified a driver mutation, fusion gene, or copy number alteration in a majority of PCC/PGLs (95%), thus explaining the molecular etiology of most of the cohort. We report several additional driver alterations in PCC/PGL including CSDE1 mutations and MAML3 fusion genes. In particular, this study identified recurrent DNA translocation and fusion genes as a component of PCC/PGL tumorigenesis. The mechanisms underlying PCC/PGLs are astonishingly diverse, with both inherited and somatic drivers influencing tumorigenesis through a broad range of biological pathways. This heterogeneity is elegantly captured in the four expression subtypes, with the Wnt-altered and cortical admixture subtypes extending previous classifications. Finally, our analysis expanded markers of aggressive disease, including MAML3 fusion genes.
Based on our results, MAML3 fusion genes are an important molecular alteration in PCC/PGL tumorigenesis. The tumors with MAML3 fusions lacked other driving alterations and were associated with a specific expression subtype, Wnt pathway activation, DNA hypomethylation and poor clinical outcome. The DNA hypomethylation profile may be a consequence of widespread, aberrant MAML3 binding to the genome and promoting gene expression. This hypothesis is supported by these tumors’ inverse correlation of methylation
A
uthor Man
uscr
ipt
A
uthor Man
uscr
ipt
A
uthor Man
uscr
ipt
A
uthor Man
uscr
ipt
and gene expression at the same loci. Although our data supports that MAML3 is the target of the fusion event, we cannot exclude tumorigenic properties specifically conferred by the upstream fusion partners, UBTF or TCF4.
Fusion genes involving mastermind family members have been reported in other tumor types (Amelio et al., 2014; Enlund et al., 2004; Wang et al., 2014). In biphenotypic sinonasal sarcoma, PAX3-MAML3 fusion genes had the same MAML3 breakpoint as in PCC/PGL and were not associated with increased expression of NOTCH target genes (Wang et al., 2014). On the other hand, the CRTC1-MAML2 fusion gene in mucoepidermoid carcinomas did affect NOTCH signaling (Enlund et al., 2004) and also had a gain-of-function interaction with Myc (Amelio et al., 2014), consistent with MYC overexpression in MAML3 fusion-positive PCC/PGLs. Future work may illuminate whether mastermind fusions in other tumor types lead to Wnt signaling pathway upregulation.
Truncating mutations in CSDE1 emerged as a driver of PCC/PGL tumorigenesis, with integrated analysis indicating a tumor suppressor role. To our knowledge, CSDE1 has not been described as a driver gene in any cancer type nor been previously associated with the Wnt signaling pathway. Querying a cancer mutation a database (Cerami et al., 2012) for CSDE1 returned rare truncating mutations in other tumor types, suggesting that CSDE1 may have a driver role in other cancers.
Our results provide significant, clinically-relevant information by confirming and identifying several molecular markers — including germline mutations in SDHB, somatic mutations in ATRX and fusions involving MAML3 — that were associated with an increased risk of aggressive and metastatic disease. The molecular alterations described herein also may serve as potential drug targets. For example, SDH-mutant tumors have high levels of glutamine, and glutaminase inhibitors (Gross et al., 2014) are currently being evaluated in
NCT02071862. As the MAML3 fusion genes activate Wnt signaling, downstream inhibitors, such as antagonists of β-catenin (PRI-274) (Lenz and Kahn, 2014) and STAT3 (BB1608), merit investigation. Cancers with alternative lengthening of telomeres associated with loss of ATRX have been shown to be sensitive to ATR inhibitors (Flynn et al., 2015b). Finally, FDA-approved targeted therapies are available for patients whose tumors carry VHL, RET, BRAF, EPAS1 and FGFR1 mutations. In summary, our comprehensive characterization significantly advances the molecular understanding of PCC/PGLs and enables the advancement of precision medicine for this rare disease.
Experimental Procedures
Samples and clinical dataPCC/PGL tumor tissue, normal tissue and blood samples were obtained from patients with informed consent and with approval from local institutional review boards (IRB) at tissue source sites (see Supplemental Experimental Procedures). Cases with neoadjuvant treatment were excluded. Head and neck PGLs were not included because such tumors are often embolized prior to surgery leaving excessive necrotic tumor tissue that is insufficient for molecular analysis. Adjacent normal tissues were at least two cm away from the tumor, mostly in the adrenal cortex. An expert endocrine pathologist (A. S. T.) reviewed frozen
A
uthor Man
uscr
ipt
A
uthor Man
uscr
ipt
A
uthor Man
uscr
ipt
A
uthor Man
uscr
ipt
sections to confirm PCC/PGL diagnosis and to determine the presence of any cortical cells in the tissue.
Clinical records were analyzed by an expert subcommittee to assign clinical outcome events by consensus definitions. Tissue source sites were contacted to clarify ambiguities when needed. Metastatic events were defined as the occurrence of distant metastases in anatomical locations where chromaffin tissue is not normally present, as per WHO definition (DeLellis et al., 2004). Aggressive disease events were defined by the occurrence of distant metastases, positive regional lymph nodes, or local recurrence. In total, 16 cases were clinically
aggressive with 11 cases having distant metastases. Molecular Analysis
All tumors were processed for DNA and RNA using the AllPrep kit (Qiagen). Tissue specimens were assayed by DNA exome sequencing, mRNA sequencing, DNA methylation microarrays, microRNA (miRNA) sequencing, DNA copy number microarrays and reverse phase protein arrays (RPPA). Analysis details are described in the Supplemental
Experimental Procedures section. Data are available at https://gdc.cancer.gov/ and https:// tcga-data.nci.nih.gov/docs/publications/pcpg_2016.
Supplementary Material
Refer to Web version on PubMed Central for supplementary material.
Acknowledgments
We thank all of the patients and families who contributed to the study, Ina Felau for project management, and Jill Dolinsky, MS, CGC at Ambry Genetics, Inc for sharing mutation classification and frequency data. This study was supported by NIH grants U54 HG003273, U54 HG003067, U54 HG003079, U24 CA143799, U24 CA143835, U24 CA143840, U24 CA143843, U24 CA143845, U24 CA143848, U24 CA143858, U24 CA143866, U24 CA143867, U24 CA143882, U24 CA143883, U24 CA144025 and P30 CA016672. Sylvia L. Asa is part of the pathology imaging medical advisory board of Leica Biosystems. Andrew D. Cherniack and Matthew Meyerson received research support from Bayer AG.
Consortia
The members of The Cancer Genome Atlas Research Network for this project are Rehan Akbani, Adrian Ally, Laurence Amar, Antonio L. Amelio, Harindra Arachchi, Sylvia L. Asa, Richard J. Auchus, J. Todd Auman, Robert Baertsch, Miruna Balasundaram, Saianand Balu, Detlef K. Bartsch, Eric Baudin, Thomas Bauer, Allison Beaver, Christopher Benz, Rameen Beroukhim, Felix Beuschlein, Tom Bodenheimer, Lori Boice, Jay Bowen, Reanne Bowlby, Denise Brooks, Rebecca Carlsen, Suzie Carter, Clarissa A. Cassol, Andrew D. Cherniack, Lynda Chin, Juok Cho, Eric Chuah, Sudha Chudamani, Leslie Cope, Daniel Crain, Erin Curley, Ludmila Danilova, Aguirre A. de Cubas, Ronald R. de Krijger, John A. Demchok, Timo Deutschbein, Noreen Dhalla, David Dimmock, Winand N. M. Dinjens, Tobias Else, Charis Eng, Jennifer Eschbacher, Martin Fassnacht, Ina Felau, Michael Feldman, Martin L. Ferguson, Ian Fiddes, Lauren Fishbein, Scott Frazer, Stacey B. Gabriel, Johanna Gardner, Julie M. Gastier-Foster, Nils Gehlenborg, Mark Gerken, Gad Getz, Jennifer Geurts, Hans K. Ghayee, Anne-Paule Gimenez-Roqueplo, Thomas J. Giordano,
A
uthor Man
uscr
ipt
A
uthor Man
uscr
ipt
A
uthor Man
uscr
ipt
A
uthor Man
uscr
ipt
Mary Goldman, Kiley Graim, Manaswi Gupta, David Haan, Stefanie Hahner, Constanze Hantel, David Haussler, D. Neil Hayes, David I. Heiman, Katherine A. Hoadley, Robert A. Holt, Alan P. Hoyle, Mei Huang, Bryan Hunt, Carolyn M. Hutter, Stuart R. Jefferys, Amy R. Johnson, Steven J.M. Jones, Corbin D. Jones, Katayoon Kasaian, Electron Kebebew, Jaegil Kim, Patrick Kimes, Theo Knijnenburg, Esther Korpershoek, Eric Lander, Michael S. Lawrence, Ronald Lechan, Darlene Lee, Kristen M. Leraas, Antonio Lerario, Ignaty Leshchiner, Tara M. Lichtenberg, Pei Lin, Shiyun Ling, Jia Liu, Virginia A. LiVolsi, Laxmi Lolla, Yair Lotan, Yiling Lu, Yussanne Ma, Nicole Maison, David Mallery, Massimo Mannelli, Jessica Marquard, Marco A. Marra, Thomas Matthew, Michael Mayo, Tchao Méatchi, Shaowu Meng, Maria J. Merino, Ozgur Mete, Matthew Meyerson, Piotr A. Mieczkowski, Gordon B. Mills, Richard A. Moore, Olena Morozova, Scott Morris, Lisle E. Mose, Andrew J. Mungall, Bradley A. Murray, Rashi Naresh, Katherine L. Nathanson, Yulia Newton, Sam Ng, Ying Ni, Michael S. Noble, Fiemu Nwariaku, Karel Pacak, Joel S. Parker, Evan Paul, Robert Penny, Charles M. Perou, Amy H. Perou, Todd Pihl, James Powers, Jennifer Rabaglia, Amie Radenbaugh, Nilsa C. Ramirez, Arjun Rao, W. Kimryn Rathmell, Anna Riester, Jeffrey Roach, A. Gordon Robertson, Sara Sadeghi, Gordon Saksena, Sofie Salama, Charles Saller, George Sandusky, Silviu Sbiera, Jacqueline E. Schein, Steven E. Schumacher, Candace Shelton, Troy Shelton, Margi Sheth, Yan Shi, Juliann Shih, Ilya Shmulevich, Janae V. Simons, Payal Sipahimalani, Tara Skelly, Heidi J. Sofia, Artem Sokolov, Matthew G. Soloway, Carrie Sougnez, Josh Stuart, Charlie Sun, Teresa Swatloski, Angela Tam, Donghui Tan, Roy Tarnuzzer, Katherine Tarvin, Nina Thiessen, Leigh B. Thorne, Henri J. Timmers, Arthur S. Tischler, Kane Tse, Vlado Uzunangelov, Anouk van Berkel, Umadevi Veluvolu, Ales Vicha, Doug Voet, Jens Waldmann, Vonn Walter, Yunhu Wan, Zhining Wang, Tracy S. Wang, Joellen Weaver, John N. Weinstein, Dirk Weismann, Brandon Wenz, Matthew D. Wilkerson, Lisa Wise, Tina Wong, Christopher Wong, Ye Wu, Liming Yang, Tomas Zelinka, Jean C. Zenklusen, Jiashan (Julia) Zhang, Wei Zhang, Jingchun Zhu, Franck Zinzindohoué and Erik Zmuda.
References
Alves-Guerra MC, Ronchini C, Capobianco AJ. Mastermind-like 1 Is a specific coactivator of beta-catenin transcription activation and is essential for colon carcinoma cell survival. Cancer Res. 2007; 67:8690–8698. [PubMed: 17875709]
Amar L, Bertherat J, Baudin E, Ajzenberg C, Bressac-de Paillerets B, Chabre O, Chamontin B, Delemer B, Giraud S, Murat A, et al. Genetic testing in pheochromocytoma or functional paraganglioma. J Clin Oncol. 2005; 23:8812–8818. [PubMed: 16314641]
Amelio AL, Fallahi M, Schaub FX, Zhang M, Lawani MB, Alperstein AS, Southern MR, Young BM, Wu L, Zajac-Kaye M, et al. CRTC1/MAML2 gain-of-function interactions with MYC create a gene signature predictive of cancers with CREB-MYC involvement. Proc Natl Acad Sci U S A. 2014; 111:E3260–3268. [PubMed: 25071166]
Ayala-Ramirez M, Feng L, Johnson MM, Ejaz S, Habra MA, Rich T, Busaidy N, Cote GJ, Perrier N, Phan A, et al. Clinical risk factors for malignancy and overall survival in patients with
pheochromocytomas and sympathetic paragangliomas: primary tumor size and primary tumor location as prognostic indicators. J Clin Endocrinol Metab. 2011; 96:717–725. [PubMed: 21190975] Beard CM, Sheps SG, Kurland LT, Carney JA, Lie JT. Occurrence of pheochromocytoma in Rochester,
Minnesota, 1950 through 1979. Mayo Clin Proc. 1983; 58:802–804. [PubMed: 6645626] Berthon AS, Szarek E, Stratakis CA. PRKACA: the catalytic subunit of protein kinase A and
adrenocortical tumors. Front Cell Dev Biol. 2015; 3:26. [PubMed: 26042218]
A
uthor Man
uscr
ipt
A
uthor Man
uscr
ipt
A
uthor Man
uscr
ipt
A
uthor Man
uscr
ipt
Bilek R, Safarik L, Ciprova V, Vlcek P, Lisa L. Chromogranin A, a member of neuroendocrine secretory proteins as a selective marker for laboratory diagnosis of pheochromocytoma. Physiol Res. 2008; 57(Suppl 1):S171–179. [PubMed: 18271679]
Burnichon N, Buffet A, Parfait B, Letouze E, Laurendeau I, Loriot C, Pasmant E, Abermil N, Valeyrie-Allanore L, Bertherat J, et al. Somatic NF1 inactivation is a frequent event in sporadic
pheochromocytoma. Hum Mol Genet. 2012; 21:5397–5405. [PubMed: 22962301]
Burnichon N, Vescovo L, Amar L, Libe R, de Reynies A, Venisse A, Jouanno E, Laurendeau I, Parfait B, Bertherat J, et al. Integrative genomic analysis reveals somatic mutations in pheochromocytoma and paraganglioma. Hum Mol Genet. 2011
Carter SL, Cibulskis K, Helman E, McKenna A, Shen H, Zack T, Laird PW, Onofrio RC, Winckler W, Weir BA, et al. Absolute quantification of somatic DNA alterations in human cancer. Nat Biotechnol. 2012; 30:413–421. [PubMed: 22544022]
Castro-Vega LJ, Letouze E, Burnichon N, Buffet A, Disderot PH, Khalifa E, Loriot C, Elarouci N, Morin A, Menara M, et al. Multi-omics analysis defines core genomic alterations in
pheochromocytomas and paragangliomas. Nat Commun. 2015; 6:6044. [PubMed: 25625332] Cerami E, Gao J, Dogrusoz U, Gross BE, Sumer SO, Aksoy BA, Jacobsen A, Byrne CJ, Heuer ML,
Larsson E, et al. The cBio cancer genomics portal: an open platform for exploring
multidimensional cancer genomics data. Cancer Discov. 2012; 2:401–404. [PubMed: 22588877] Cho NH, Lee HW, Lim SY, Kang S, Jung WY, Park CS. Genetic aberrance of sporadic MEN 2A
component tumours: analysis of RET. Pathology. 2005; 37:10–13. [PubMed: 15875728]
Comino-Mendez I, de Cubas AA, Bernal C, Alvarez-Escola C, Sanchez-Malo C, Ramirez-Tortosa CL, Pedrinaci S, Rapizzi E, Ercolino T, Bernini G, et al. Tumoral EPAS1 (HIF2A) mutations explain sporadic pheochromocytoma and paraganglioma in the absence of erythrocytosis. Hum Mol Genet. 2013; 22:2169–2176. [PubMed: 23418310]
Crona J, Delgado Verdugo A, Maharjan R, Stalberg P, Granberg D, Hellman P, Bjorklund P. Somatic mutations in H-RAS in sporadic pheochromocytoma and paraganglioma identified by exome sequencing. J Clin Endocrinol Metab. 2013; 98:E1266–1271. [PubMed: 23640968]
Dahia PL. Pheochromocytoma and paraganglioma pathogenesis: learning from genetic heterogeneity. Nat Rev Cancer. 2014; 14:108–119. [PubMed: 24442145]
Dahia PL, Ross KN, Wright ME, Hayashida CY, Santagata S, Barontini M, Kung AL, Sanso G, Powers JF, Tischler AS, et al. A HIF1alpha regulatory loop links hypoxia and mitochondrial signals in pheochromocytomas. PLoS Genet. 2005; 1:72–80. [PubMed: 16103922]
DeLellis, RA.Lloyd, RV.Heitz, PU., Eng, C., editors. Pathology and Genetics of Tumours of Endocrine Organs. Lyon, France: IARC Press; 2004. World Health Organization Classification of Tumours. Dormoy-Raclet V, Markovits J, Malato Y, Huet S, Lagarde P, Montaudon D, Jacquemin-Sablon A,
Jacquemin-Sablon H. Unr, a cytoplasmic RNA-binding protein with cold-shock domains, is involved in control of apoptosis in ES and HuH7 cells. Oncogene. 2007; 26:2595–2605. [PubMed: 17086213]
Eisenhofer G, Lenders JW, Siegert G, Bornstein SR, Friberg P, Milosevic D, Mannelli M, Linehan WM, Adams K, Timmers HJ, Pacak K. Plasma methoxytyramine: a novel biomarker of metastatic pheochromocytoma and paraganglioma in relation to established risk factors of tumour size, location and SDHB mutation status. Eur J Cancer. 2012; 48:1739–1749. [PubMed: 22036874] Eisenhofer G, Lenders JW, Timmers H, Mannelli M, Grebe SK, Hofbauer LC, Bornstein SR, Tiebel O,
Adams K, Bratslavsky G, et al. Measurements of plasma methoxytyramine, normetanephrine, and metanephrine as discriminators of different hereditary forms of pheochromocytoma. Clin Chem. 2011; 57:411–420. [PubMed: 21262951]
Elatmani H, Dormoy-Raclet V, Dubus P, Dautry F, Chazaud C, Jacquemin-Sablon H. The RNA-binding protein Unr prevents mouse embryonic stem cells differentiation toward the primitive endoderm lineage. Stem Cells. 2011; 29:1504–1516. [PubMed: 21954113]
Enlund F, Behboudi A, Andren Y, Oberg C, Lendahl U, Mark J, Stenman G. Altered Notch signaling resulting from expression of a WAMTP1-MAML2 gene fusion in mucoepidermoid carcinomas and benign Warthin’s tumors. Exp Cell Res. 2004; 292:21–28. [PubMed: 14720503]
Favier J, Amar L, Gimenez-Roqueplo AP. Paraganglioma and phaeochromocytoma: from genetics to personalized medicine. Nat Rev Endocrinol. 2015; 11:101–111. [PubMed: 25385035]
A
uthor Man
uscr
ipt
A
uthor Man
uscr
ipt
A
uthor Man
uscr
ipt
A
uthor Man
uscr
ipt
Figlioli G, Landi S, Romei C, Elisei R, Gemignani F. Medullary thyroid carcinoma (MTC) and RET proto-oncogene: mutation spectrum in the familial cases and a meta-analysis of studies on the sporadic form. Mutat Res. 2013; 752:36–44. [PubMed: 23059849]
Fishbein L, Khare S, Wubbenhorst B, DeSloover D, D’Andrea K, Merrill S, Cho NW, Greenberg RA, Else T, Montone K, et al. Whole-exome sequencing identifies somatic ATRX mutations in pheochromocytomas and paragangliomas. Nat Commun. 2015; 6:6140. [PubMed: 25608029] Flynn A, Benn D, Clifton-Bligh R, Robinson B, Trainer AH, James P, Hogg A, Waldeck K, George J,
Li J, et al. The genomic landscape of phaeochromocytoma. J Pathol. 2015a; 236:78–89. [PubMed: 25545346]
Flynn RL, Cox KE, Jeitany M, Wakimoto H, Bryll AR, Ganem NJ, Bersani F, Pineda JR, Suva ML, Benes CH, et al. Alternative lengthening of telomeres renders cancer cells hypersensitive to ATR inhibitors. Science. 2015b; 347:273–277. [PubMed: 25593184]
Gross MI, Demo SD, Dennison JB, Chen L, Chernov-Rogan T, Goyal B, Janes JR, Laidig GJ, Lewis ER, Li J, et al. Antitumor activity of the glutaminase inhibitor CB-839 in triple-negative breast cancer. Mol Cancer Ther. 2014; 13:890–901. [PubMed: 24523301]
Hescot S, Leboulleux S, Amar L, Vezzosi D, Borget I, Bournaud-Salinas C, de la Fouchardiere C, Libe R, Do Cao C, Niccoli P, et al. One-year progression-free survival of therapy-naive patients with malignant pheochromocytoma and paraganglioma. J Clin Endocrinol Metab. 2013; 98:4006–4012. [PubMed: 23884775]
Heynen GJ, Nevedomskaya E, Palit S, Jagalur Basheer N, Lieftink C, Schlicker A, Zwart W, Bernards R, Bajpe PK. Mastermind-Like 3 Controls Proliferation and Differentiation in Neuroblastoma. Mol Cancer Res. 2016; 14:411–422. [PubMed: 26785999]
Hrascan R, Pecina-Slaus N, Martic TN, Colic JF, Gall-Troselj K, Pavelic K, Karapandza N. Analysis of selected genes in neuroendocrine tumours: insulinomas and phaeochromocytomas. J
Neuroendocrinol. 2008; 20:1015–1022. [PubMed: 18510707]
Huang X, Ding L, Bennewith KL, Tong RT, Welford SM, Ang KK, Story M, Le QT, Giaccia AJ. Hypoxia-inducible mir-210 regulates normoxic gene expression involved in tumor initiation. Mol Cell. 2009; 35:856–867. [PubMed: 19782034]
Jiao Y, Killela PJ, Reitman ZJ, Rasheed AB, Heaphy CM, de Wilde RF, Rodriguez FJ, Rosemberg S, Oba-Shinjo SM, Nagahashi Marie SK, et al. Frequent ATRX, CIC, FUBP1 and IDH1 mutations refine the classification of malignant gliomas. Oncotarget. 2012; 3:709–722. [PubMed: 22869205] Kobayashi H, Kawauchi D, Hashimoto Y, Ogata T, Murakami F. The control of precerebellar neuron
migration by RNA-binding protein Csde1. Neuroscience. 2013; 253:292–303. [PubMed: 24012837]
Komminoth P, Kunz E, Hiort O, Schroder S, Matias-Guiu X, Christiansen G, Roth J, Heitz PU. Detection of RET proto-oncogene point mutations in paraffin-embedded pheochromocytoma specimens by nonradioactive single-strand conformation polymorphism analysis and direct sequencing. Am J Pathol. 1994; 145:922–929. [PubMed: 7943181]
Lawrence MS, Stojanov P, Polak P, Kryukov GV, Cibulskis K, Sivachenko A, Carter SL, Stewart C, Mermel CH, Roberts SA, et al. Mutational heterogeneity in cancer and the search for new cancer-associated genes. Nature. 2013; 499:214–218. [PubMed: 23770567]
Lenz HJ, Kahn M. Safely targeting cancer stem cells via selective catenin coactivator antagonism. Cancer Sci. 2014; 105:1087–1092. [PubMed: 24975284]
Letouze E, Martinelli C, Loriot C, Burnichon N, Abermil N, Ottolenghi C, Janin M, Menara M, Nguyen AT, Benit P, et al. SDH Mutations Establish a Hypermethylator Phenotype in Paraganglioma. Cancer Cell. 2013; 23:739–752. [PubMed: 23707781]
Liu Y, Hayes DN, Nobel A, Marron JS. Statistical Significance of Clustering for High-Dimension, Low-Sample Size Data. Journal of the American Statistical Association. 2008; 103:1281–1293. McElhinny AS, Li JL, Wu L. Mastermind-like transcriptional co-activators: emerging roles in
regulating cross talk among multiple signaling pathways. Oncogene. 2008; 27:5138–5147. [PubMed: 18758483]
Mermel CH, Schumacher SE, Hill B, Meyerson ML, Beroukhim R, Getz G. GISTIC2.0 facilitates sensitive and confident localization of the targets of focal somatic copy-number alteration in human cancers. Genome Biol. 2011; 12:R41. [PubMed: 21527027]
A
uthor Man
uscr
ipt
A
uthor Man
uscr
ipt
A
uthor Man
uscr
ipt
A
uthor Man
uscr
ipt
Miao CG, Shi WJ, Xiong YY, Yu H, Zhang XL, Qin MS, Du CL, Song TW, Li J. miR-375 regulates the canonical Wnt pathway through FZD8 silencing in arthritis synovial fibroblasts. Immunol Lett. 2015; 164:1–10. [PubMed: 25619565]
Mihailovich M, Militti C, Gabaldon T, Gebauer F. Eukaryotic cold shock domain proteins: highly versatile regulators of gene expression. Bioessays. 2010; 32:109–118. [PubMed: 20091748] Mose LE, Wilkerson MD, Hayes DN, Perou CM, Parker JS. ABRA: improved coding indel detection
via assembly-based realignment. Bioinformatics. 2014; 30:2813–2815. [PubMed: 24907369] Toledo RA, Qin Y, Cheng ZM, Gao Q, Iwata S, Silva GM, Prasad ML, Ocal IT, Rao S, Aronin N, et al.
Recurrent Mutations of Chromatin-Remodeling Genes and Kinase Receptors in
Pheochromocytomas and Paragangliomas. Clin Cancer Res. 2016; 22:2301–2310. [PubMed: 26700204]
Wang K, Singh D, Zeng Z, Coleman SJ, Huang Y, Savich GL, He X, Mieczkowski P, Grimm SA, Perou CM, et al. MapSplice: accurate mapping of RNA-seq reads for splice junction discovery. Nucleic Acids Res. 2010; 38:e178. [PubMed: 20802226]
Wang X, Bledsoe KL, Graham RP, Asmann YW, Viswanatha DS, Lewis JE, Lewis JT, Chou MM, Yaszemski MJ, Jen J, et al. Recurrent PAX3-MAML3 fusion in biphenotypic sinonasal sarcoma. Nat Genet. 2014; 46:666–668. [PubMed: 24859338]
Welander J, Andreasson A, Brauckhoff M, Backdahl M, Larsson C, Gimm O, Soderkvist P. Frequent EPAS1/HIF2alpha exons 9 and 12 mutations in non-familial pheochromocytoma. Endocr Relat Cancer. 2014; 21:495–504. [PubMed: 24741025]
Wilkerson MD, Cabanski CR, Sun W, Hoadley KA, Walter V, Mose LE, Troester MA, Hammerman PS, Parker JS, Perou CM, Hayes DN. Integrated RNA and DNA sequencing improves mutation detection in low purity tumors. Nucleic Acids Res. 2014; 42:e107. [PubMed: 24970867]
Wilkerson MD, Hayes DN. ConsensusClusterPlus: a class discovery tool with confidence assessments and item tracking. Bioinformatics. 2010; 26:1572–1573. [PubMed: 20427518]
Yang M, Pollard PJ. Succinate: a new epigenetic hacker. Cancer Cell. 2013; 23:709–711. [PubMed: 23763995]
Zheng S, Cherniack AD, Dewal N, Moffitt RA, Danilova L, Murray BA, Lerario AM, Else T, Knijnenburg TA, Ciriello G, et al. Comprehensive Pan-Genomic Characterization of Adrenocortical Carcinoma. Cancer Cell. 2016; 29:723–736. [PubMed: 27165744]
Zhuang Z, Yang C, Lorenzo F, Merino M, Fojo T, Kebebew E, Popovic V, Stratakis CA, Prchal JT, Pacak K. Somatic HIF2A gain-of-function mutations in paraganglioma with polycythemia. N Engl J Med. 2012; 367:922–930. [PubMed: 22931260]
A
uthor Man
uscr
ipt
A
uthor Man
uscr
ipt
A
uthor Man
uscr
ipt
A
uthor Man
uscr
ipt
Significance
Pheochromocytomas and paragangliomas (PCC/PGLs) are rare neuroendocrine tumors with a unique genetic background and few options for treating metastatic disease. Comprehensive molecular analysis revealed that PCC/PGLs have a low genome alteration rate with a remarkable diversity of driver alterations including germline and somatic mutations, and somatic fusion genes. This diversity coalesced into molecular subtypes, including the discovery of a Wnt-altered subtype driven by MAML3 fusion gene and CSDE1 somatic mutation. This subtype correlates with poor clinical outcome, providing opportunities for molecular diagnosis and prognosis in patients. The diversity of single drivers among PCC/PGL makes these tumors a model for future targeted therapy and pan-cancer molecular etiology research.
A
uthor Man
uscr
ipt
A
uthor Man
uscr
ipt
A
uthor Man
uscr
ipt
A
uthor Man
uscr
ipt
Highlights
• Comprehensive molecular profiling of 173 pheochromocytoma and paraganglioma tumors.
• Single drivers in tumors by germline mutation, somatic mutation, or fusion gene.
• MAML3 fusion gene and CSDE1 somatic mutation define a Wnt-altered subtype.
• Prognostic markers of metastatic disease include the MAML3 fusion gene.
A
uthor Man
uscr
ipt
A
uthor Man
uscr
ipt
A
uthor Man
uscr
ipt
A
uthor Man
uscr
ipt
Figure 1. Germline and Somatic Genome Alterations
Genomic features in rows and primary tumors (n = 173) in columns; shading indicates the effect of a mutation on protein sequence. Significant somatically mutated genes (MutSig2, q < 0.05) indicated by an asterisk (*).
See also Table S1 and S2 and S3.
A
uthor Man
uscr
ipt
A
uthor Man
uscr
ipt
A
uthor Man
uscr
ipt
A
uthor Man
uscr
ipt
Figure 2. Integrated Alterations in RET and in CSDE1
(A) Location of somatic and germline RET mutations within the protein sequence. (B) RET mRNA expression of mutation positive (+) and mutation negative (−) tumors. Boxplot horizontal lines indicate 25th, 50th, and 75th percentiles, lines extend to the furthest point less than or equal to 1.5 times the interquartile range. Points indicate primary tumors, with horizontal jitter added to aid visualization.
(C) Mutations within CSDE1 gene structure.
(D) Association of CSDE1 mRNA expression versus CSDE1 DNA copy number, points represent primary tumors.
See also Figure S1.
A
uthor Man
uscr
ipt
A
uthor Man
uscr
ipt
A
uthor Man
uscr
ipt
A
uthor Man
uscr
ipt
Figure 3. Detection of Fusion Genes
(A) Focal copy number amplifications and deletions from GISTIC analysis.
(B) DNA copy number alterations at the TCF4, UBTF and MAML3 loci for tumors with MAML3 amplification; rectangles indicate DNA breakpoints with shading proportional to DNA copy number. mRNA or DNA fusion sequence positivity indicated by “+”.
(C) Circos diagram of mRNA fusion genes. Color denotes fusion mates.
(D) Exon expression diagrams for representative tumors from each MAML3 fusion gene species. Colors indicate relative differential expression across exons. Orange arrows indicate fusion breakpoints and exon number.
See also Table S2 and S4 and Figure S2.
A
uthor Man
uscr
ipt
A
uthor Man
uscr
ipt
A
uthor Man
uscr
ipt
A
uthor Man
uscr
ipt
Figure 4. Molecular correlates of MAML3 fusion
(A) Differentially methylated probes among tumors by MAML3 fusion status.
(B) Log2 ratios for select mRNA, miRNA and DNA methylation markers (false-discovery rate [FDR] < 0.05). Log2 ratios for select RPPA markers (Kruskal-Wallis tests: β-catenin p < 0.022, GSK3 p < 0.14, DVL3 p < 0.18). GSK3 refers to both GSK3α and GSK3β because the antibody used interacts with both. For display, RPPA expression were increased by the minimum value of each marker to provide positive values for the log2 ratio calculation. Log2 ratios calculated using primary tumors. Arrows indicate regulatory relationships, i.e. methylation within a particular gene region or a miRNA binding partner.
(C) Expression scores based on published MAML3 signature (Heynen et al., 2016). (See Supplemental Procedures). Boxplot horizontal lines indicate 25th, 50th, and 75th percentiles,
A
uthor Man
uscr
ipt
A
uthor Man
uscr
ipt
A
uthor Man
uscr
ipt
A
uthor Man
uscr
ipt
lines extend to furthest point less than or equal to 1.5 times the interquartile range. Points indicate primary tumor values, with horizontal jitter added to aid visualization.
See also Figure S3.
A
uthor Man
uscr
ipt
A
uthor Man
uscr
ipt
A
uthor Man
uscr
ipt
A
uthor Man
uscr
ipt
Figure 5. Integrated Molecular Subtypes
(A) mRNA subtypes. Primary tumors (n = 173) appear in columns, and clinical and genomic features displayed in rows. Categorical features analyzed using Fisher’s exact tests;
continuous features were analyzed using Kruskal-Wallis tests. Select differentially expressed genes displayed below each subtype.
(B) DNA copy number (Carter et al., 2012) clustering. Primary tumors are columns (n = 173).
(C) DNA methylation clustering. Primary tumors (n = 173) appear in columns. Features tested for association with methylation subtypes by same method as in (A).
A
uthor Man
uscr
ipt
A
uthor Man
uscr
ipt
A
uthor Man
uscr
ipt
A
uthor Man
uscr
ipt
(D) Ring plot displaying cross-platform subtype association. p prefers to chi-square tests on platform subtype vs mRNA expression subtype.
See also Table S2 and Figures S4 and S5 and S6.
A
uthor Man
uscr
ipt
A
uthor Man
uscr
ipt
A
uthor Man
uscr
ipt
A
uthor Man
uscr
ipt
Figure 6. Recurrently Altered Pathways
Selected pathways recurrently altered by germline mutations, non-silent somatic variants and somatic fusion genes. Pathway heading percentages reflect alteration rate in the cohort (n = 173). Box shading reflects the alteration rate, with red – activating and blue –
inactivating. Protein alteration frequencies and percentages displayed within the respective boxes. Grey boxes have alteration rates ≤ 1%. Succ – succinate; iso – isocitrate; fum – fumarate; 2OG – 2-oxogluterate.
A
uthor Man
uscr
ipt
A
uthor Man
uscr
ipt
A
uthor Man
uscr
ipt
A
uthor Man
uscr
ipt
Figure 7. Molecular Discriminants of Clinical Outcome
Primary tumors are columns (n = 173). Molecular and clinical features are rows. Somatic mutation total is the number of somatic mutations in a tumor. Marker and outcome associations were determined by log rank tests (p).
See also Figure S7.
A
uthor Man
uscr
ipt
A
uthor Man
uscr
ipt
A
uthor Man
uscr
ipt
A
uthor Man
uscr
ipt
A
uthor Man
uscr
ipt
A
uthor Man
uscr
ipt
A
uthor Man
uscr
ipt
A
uthor Man
uscr
ipt
Table 1Summary of Data Types
Data Type Platforms Cases (n) Data Access
TCGA Core Sample Set (n = 173 total cases)
Whole-exome DNA sequencing Illumina; SureSelect v2 173 controlled: BAM files
open: somatic mutations
DNA copy number Affymetrix SNP 6.0 173 controlled: CEL files
open: copy number
mRNA sequencing Illumina 173 controlled: BAM files
open: expression
miRNA sequencing Illumina 173 controlled: BAM files
open: expression
CpG DNA methylation Illuminia Infinium HM 450 173 open